Programa de Pós-graduação em Saneamento, Meio Ambiente e Recursos Hídricos da UFMG 1
UNIVERSIDADE FEDERAL DE MINAS GERAIS
P
ROGRAMA DEP
ÓS-
GRADUAÇÃO EMS
ANEAMENTO,
M
EIOA
MBIENTE ER
ECURSOSH
ÍDRICOSEVALUATION OF MEMBRANE SEPARATION
PROCESS FOR THE TREATMENT OF GOLD
MINING EFFLUENT
Laura Hamdan de Andrade
EVALUATION OF MEMBRANE SEPARATION
PROCESS FOR THE TREATMENT OF GOLD
MINING EFFLUENT
Laura Hamdan de Andrade
EVALUATION OF MEMBRANE SEPARATION
PROCESS FOR THE TREATMENT OF GOLD
MINING EFFLUENT
Tese apresentada ao Programa de Pós-graduação em Saneamento, Meio Ambiente e Recursos Hídricos da Universidade Federal de Minas Gerais, como requisito parcial à obtenção do título de Doutor em Saneamento, Meio Ambiente e Recursos Hídricos.
Área de concentração: Meio Ambiente
Linha de pesquisa: Caracterização, prevenção e controle da poluição
Orientador: Profa. Dra. Míriam Cristina Santos Amaral
Belo Horizonte
Escola de Engenharia da UFMG
4
Laura Hamdan de Andrade
EVALUATION OF MEMBRANE SEPARATION
PROCESS FOR THE TREATMENT OF GOLD
MINING EFFLUENT
Thesis presented to the Post-Graduate Program in Sanitation, Environment and Water Resources of the Federal University of Minas Gerais, as a partial requirement to obtain the title of Doctor in Sanitation, Environment and Water Resources.
Focus area: Environment
Research line: Characterization, prevention and control of pollution
Advisor: Prof. Dra. Miriam Cristina Santos Amaral
Belo Horizonte
School of Engineering, Federal University of Minas Gerais
Página com as assinaturas dos membros da banca examinadora, fornecida pelo Colegiado do
i
AGRADECIMENTOS
Mais uma etapa chega ao fim... Foram 4 anos de muito aprendizado, desafios e crescimento; e
agora é hora de finalizar um capítulo da vida para começar a escrever vários outros.
Agradeço a todos que contribuíram com a realização dessa tese! Primeiramente, à minha
orientadora Miriam. Obrigada por ter me apresentado o incrível mundo das membranas, quando
eu ainda era aluna de graduação, e por ter contribuído tanto para minha formação. Obrigada por
confiar no meu trabalho e por ter me oferecido tantas ótimas oportunidades de crescimento e
conhecimento ao longo de todos esses anos de convívio.
Agradeço a todos os bolsistas que participaram do projeto pelo indispensável apoio no
laboratório. Gi, Gabi e Luiza Procópio, obrigada por nos ajudarem a obter os primeiros e
comemorados dados da nanofiltração. Luiza da Barros, obrigada por seu cuidado e dedicação
com o projeto, pela sua grande disponibilidade e vontade de ajudar, e por largar a indústria para
vir agregar competência à área acadêmica (rs). Wadson, não tenho nem palavras para te
agradecer! Como gosto de dizer, sem o Wadson, eu não teria doutorado. Obrigada por sua
alegria contagiante, por seu ombro amigo, pelas brincadeiras infinitas que deixaram todo esse
processo mais prazeroso e por sua incalculável boa vontade e disponibilidade para ajudar.
Aos professores da banca, Prof. Cláudio Habert, Prof. Cristiano Piacsek e Profa. Liséte Lange,
que gentilmente aceitaram avaliar e contribuir com o melhoramento desse trabalho.
Agradeço imensamente ao Romulo, que faz minha vida mais feliz e completa e me dá força e
apoio para superar os desafios. Obrigada pela paciência, compreensão e carinho de sempre.
Ao meu pai Álvaro e meus irmãos, Danilo, Vitor e Gustavo, pelo amor, confiança e apoio. À
Zetinha pelos cuidados amorosos, pela preocupação e por tornar os dias mais saborosos. Ao
Gibbs, meu tutuquinho, companhia doce em todos os momentos, que me alegra tanto e me faz
rir todos os dias.
Agradeço à minha mãe, que não está aqui para comemorar esse momento, mas que com certeza
estaria transbordando de orgulho e alegria. Obrigada por ter me ensinado com gestos e
Programa de Pós-graduação em Saneamento, Meio Ambiente e Recursos Hídricos da UFMG ii A todos os colegas e amigos do GEAPS e do DESA, com quem tive a excelente oportunidade
de conviver durante todo esse tempo. Em especial, agradeço à Barbrinha por sua verdadeira
amizade, infinita ajuda e generosidade. Obrigada por ser um exemplo de gentileza e bondade
para todos. Um dia quero ser inteligente e ganhar coxinhas igual a você! À Kerninha, minha
amiga para toda a vida, mesmo que esteja em outro hemisfério. Obrigada pelas ótimas
conversas, risadas e conselhos e por ser um modelo de competência profissional, retidão e
dedicação. À Alice, que tanto nos ensinou com sua luta e superação, por sua grande ajuda,
companheirismo e vontade de contribuir de sempre. À Natalie por se dedicar tanto ao
crescimento de todo o nosso grupo. À Pri por sua doçura e invejável bom humor. À Bia pela
amizade e ótima companhia. À Thaís por toda sua boa vontade e valiosa ajuda. À Olívia pela
contribuição com o projeto. A todos outros colegas que fazem parte do GEAPS: André, Carol,
Rosi, Eduardo, Marcelo, Mari, Ana, e vários outros, pelo companheirismo. E aos amigos que
seguiram outros caminhos, mas que deixaram sua eterna marca no meu coração: Paulets,
Danusa, Nath, Marcella, Rê, Fábio, Gabriel, Tainá.
À Flávia, Altair, Naiara, Lucélia e toda equipe da empresa parceira por acreditarem no nosso
projeto e nos proporcionarem as condições para que ele pudesse se tornar realidade.
Gostaria de agradecer também a todos que contribuíram para realização das diversas etapas do
trabalho: Mirna e Lucilaine (DESA/UFMG), sempre tão atenciosas; Orlando (Engenharia
Metalúrgica/UFMG), pela grande contribuição com as análises de ângulo de contato; Profa.
Helen e João (COPPE/UFRJ), pela disponibilidade em nos ajudar com o potencial zeta;
Alexandre (Engenharia Química/UFMG), pelas análises de absorção atômica; Profa. Luzia e
Késsia (Química/CEFET), pela análise de infravermelho; Jéssica, Breno e Renata (Centro de
Microscopia da UFMG), e tantos outros...
Finalmente, agradeço à Capes pela bolsa concedida.
E a todos amigos e familiares que participaram de alguma forma da realização dessa tese.
iii
RESUMO
Essa tese objetivou realizar uma avaliação sistêmica e detalhada dos processos integrados de
ultrafiltração (UF) e nanofiltração (NF) aplicados ao tratamento de efluente de mineração de
ouro, o qual é caracterizado por elevadas concentrações de sulfato, cálcio e arsênio e pH ácido.
As condições operacionais tipo de processo (osmose inversa ou NF), tipo de membrana,
aplicação de pré-tratamento, pH de alimentação, temperatura e grau de recuperação de
permeado (GR) foram avaliadas em escala de bancada. As melhores condições encontradas
foram: membrana de nanofiltração NF90, com pré-tratamento com UF, ajuste do pH da
alimentação para 5,0 e temperatura ambiente. O elevado grau de supersaturação do sulfato de
cálcio limitou o GR do primeiro estágio de NF a 40%. O procedimento de limpeza química
também foi estudado, e a melhor eficiência de limpeza foi a obtida com recirculação de solução
de HCl 0,2% por 90 minutos. Por outro lado, pressão de operação, velocidade de escoamento,
adição de anti-incrustante, aplicação de limpeza física e frequência de limpeza química foram
avaliados em escala piloto. Observou-se que o aumento da pressão e a aplicação de limpeza
física não trouxeram benefícios ao processo, enquanto o aumento da velocidade de escoamento
reduziu incrustação e aumentou a eficiência de retenção de solutos. A adição de anti-incrustante
também reduziu o decaimento de fluxo de permeado para GR maiores que 40%. A estabilidade
da membrana foi avaliada por meio da sua exposição ao efluente e conjuntamente ao efluente
e à solução de limpeza. As variações de rejeição e permeabilidade das membranas ao longo do
tempo não foram muito expressivas, e as mesmas demonstraram bom desempenho mesmo após
285 dias de exposição. As condições para a precipitação intermediária do concentrado do
primeiro estágio da NF foram estudadas. As condições otimizadas para a precipitação de arsênio
e cálcio foram, respectivamente, relação molar Fe/As 4,0 e pH 7,0 e relação molar CO3/Ca 3,5
e pH 11,5. A baixa ocorrência de incrustação irreversível demonstrou ser possível operar com
altos GRs no segundo estágio de UF-NF. Apesar de a inclusão de precipitação intermediária e
segundo estágio de UF-NF aumentar o custo do tratamento de US$ 1.34/m³ para US$ 6.28/m³,
ela permite a geração de 187 m³/h de água de reúso. Dessa forma, esse estudo demonstrou o
potencial das tecnologias UF e NF para tratamento dos efluentes de mineração de ouro visando
ao reúso de água.
Palavras-chave: Efluente de mineração de ouro; Nanofiltração; Ultrafiltração; Condições
Programa de Pós-graduação em Saneamento, Meio Ambiente e Recursos Hídricos da UFMG iv
ABSTRACT
This study aimed to carry out a systematic and detailed evaluation of integrated ultrafiltration
(UF) and nanofiltration (NF) applied to the treatment of gold mining effluent, which is
characterized by high concentrations of sulfate, calcium and arsenic and acid pH. The operating
conditions type of process (NF or reverse osmosis), membrane type, application of
pre-treatment, feed pH, temperature and permeate recovery rate (RR) were evaluated in bench scale
trials. The best conditions found were: NF90 nanofiltration membrane, pre-treatment with UF,
feed pH adjustment up to 5.0, and filtration carried out at room temperature. The high
supersaturation index of calcium sulfate limited the first-stage NF RR at 40%. The chemical
cleaning procedure was also studied and the better cleaning efficiency was found for
recirculation of 0.2% HCl solution for 90 minutes. Moreover, operating pressure, cross-flow
velocity, antiscalant dosage, application of physical cleaning and chemical cleaning frequency
were evaluated on a pilot scale plant. It was observed that the increase in pressure and physical
cleaning did not bring benefits to the process, while increasing the cross-flow velocity was able
to reduce fouling and increase solute retention efficiency. The addition of antiscalant also
reduced the permeate flux decay for RR greater than 40%. The stability of the membrane was
evaluated by its exposure to the effluent and to both the effluent and the cleaning solution. The
membranes rejection and permeability variations over time were not very significant, and they
have demonstrated good performance even after 285 days of exposure. The conditions for
intermediate precipitation of the first-stage NF concentrate were studied. The optimized
conditions for the precipitation of arsenic and calcium were, respectively, molar ratio Fe/As 4.0
and pH 7.0, and molar ratio CO3/Ca 3.5 and pH 11.5. It was possible to achieve a 60% RR in
the second-stage UF-NF without occurrence of scaling or irreversible fouling, which indicated
the possibility of operation at higher RR. Despite the fact that the inclusion of intermediate
precipitation and second stage UF-NF increases the cost of the treatment from US$ 1.34 / m³ to
US$ 6.28 / m³, it also allows the generation of 187 m³/h of reusable water. Thus, this study
demonstrated the high potential of UF and NF technologies for the treatment of gold mining
effluents aiming at water reuse.
Key-words: Gold mining wastewater; Nanofiltration; Ultrafiltration; Operating conditions;
v
SUMÁRIO
LIST OF FIGURES ... VII
LIST OF TABLES ... IX
LIST OF ABBREVIATIONS, ACRONYMS AND SYMBOLS ... XI
1 CHAPTER ... 1
1.1 BACKGROUNDANDJUSTIFICATION ... 2
1.2 OBJECIVES... 5
1.2.1 General objective ... 5
1.2.2 Specific objectives... 6
1.3 DOCUMENTSTRUCTURE ... 6
2 CHAPTER ... 8
2.1 INTRODUCTION ... 9
2.2 MATERIALSANDMETHODS ... 13
2.2.1 Effluents from gold mining ... 13
2.2.2 Experimental setup ... 18
2.2.3 Membranes ... 19
2.2.4 Experimental procedure ... 20
2.2.5 Analytical methods ... 28
2.3 RESULTSANDDISCUSSION ... 29
2.3.1 UF pretreatment ... 29
2.3.2 Influence of feed pH on UF pretreatment ... 30
2.3.3 Evaluation of several NF and RO membranes ... 30
2.3.4 Influence of feed pH on NF fouling ... 34
2.3.5 Influence of feed pH on NF retention ... 36
2.3.6 Influence of temperature on NF fouling ... 39
2.3.7 NF permeate recovery rate ... 41
2.3.8 Permeate reuse ... 44
2.4 CONCLUSION ... 44
3 CHAPTER ... 46
3.1 INTRODUCTION ... 47
3.2 MATERIALSANDMETHODS ... 49
3.2.1 Effluents from gold mining and description of the effluent treatment process ... 49
3.2.2 Fouling evaluation ... 50
3.2.3 Evaluation of NF membrane cleaning ... 52
3.2.4 Assessment of membrane stability to the effluent and the cleaning solution ... 54
3.2.5 Evaluation of morphological and chemical characteristics of membranes and foulants ... 56
3.3 RESULTSANDDISCUSSION ... 58
3.3.1 Fouling evaluation ... 58
3.3.2 Cleaning membrane evaluation ... 60
3.3.3 Evaluation of membrane stability to the effluent and the cleaning solution ... 63
3.4 CONCLUSIONS ... 72
4 CHAPTER ... 74
4.1 INTRODUCTION ... 75
4.2 MATERIALSANDMETHODS ... 78
4.2.1 Effluents from gold mining and description of the effluent treatment process ... 78
4.2.2 Experimental setup ... 78
4.2.3 Experimental procedure ... 80
4.2.4 Economic aspects ... 87
4.3 RESULTSANDDISCUSSION ... 88
4.3.1 Evaluation of NF at different operating pressures ... 88
Programa de Pós-graduação em Saneamento, Meio Ambiente e Recursos Hídricos da UFMG vi
4.3.3 Concentration test with and without antiscalant ... 92
4.3.4 Evaluation of physical cleaning ... 97
4.3.5 Evaluation of chemical cleaning... 99
4.3.6 Bench and pilot scale integrated UF-NF performance ... 102
4.3.7 Economic aspects ... 104
4.4 CONCLUSIONS ... 105
5 CHAPTER ... 107
5.1 INTRODUCTION ... 108
5.2 MATERIALSANDMETHODS ... 111
5.2.1 Effluents from gold mining and description of the effluent treatment process ... 111
5.2.2 Experimental setup ... 112
5.2.3 Nanofiltration experimental procedure ... 113
5.2.4 Arsenic coprecipitation ... 116
5.2.5 Calcium precipitation ... 118
5.2.6 Analytical methods ... 119
5.2.7 Economic aspects ... 119
5.3 RESULTSANDDISCUSSION ... 121
5.3.1 Advantages of using a two-step intermediate chemical precipitation... 121
5.3.2 Arsenic coprecipitation ... 124
5.3.3 Calcium precipitation ... 127
5.3.4 Intermediate precipitation at optimum conditions ... 131
5.3.5 Evaluation of pH on second-stage NF ... 132
5.3.6 Evaluation of permeate recovery rate of second-stage NF ... 133
5.3.7 Economic aspects ... 136
5.4 CONCLUSIONS ... 138
6 CHAPTER ... 140
7 CHAPTER ... 144
vii
LIST OF FIGURES
Figure 2.1 - Schematic illustration of (a) UF and (b) NF/RO units and (c) schematic and photograph of the NF/RO membrane cell ... 19 Figure 2.2 - Ratio of permeate flux (J) to initial permeate flux (J0) as a function of time for
effluent from gold mining NF, with and without UF pretreatment ... 29 Figure 2.3 - Ratio of effluent permeate flux (J) to initial permeate flux (J0) as a function of
recovery rate and feed pH ... 34 Figure 2.4 - NF90 membrane zeta potential with electrolyte solution and synthetic effluent . 35 Figure 2.5 - Effect of temperature on J/J0 for nanofiltration of mining effluent. ... 40
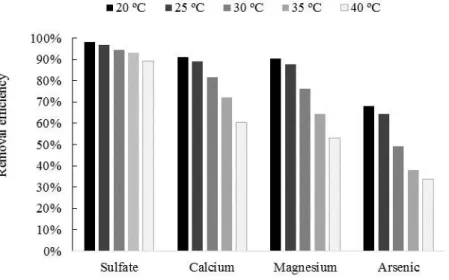
Figure 2.6 - Effect of temperature on efficiency of NF retention of sulfate, calcium,
magnesium and arsenic ions ... 40 Figure 2.7 – Permeate flux, theoretical pure water flux at instant effective pressure and
conductivity as a function of the recovery rate... 41 Figure 3.1 – Scheme of the treatment system proposed for gold mining effluent ... 49 Figure 3.2 – Permeate flux over initial flux (J/J0) to gold mining effluent nanofiltration... 58
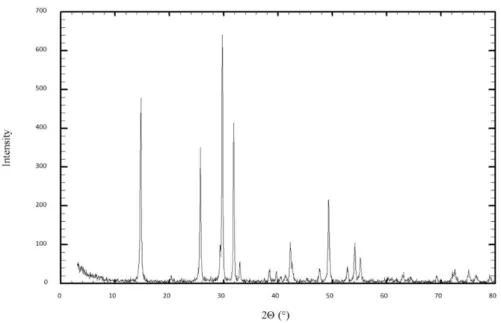
Figure 3.3 – X- ray diffractogram from the precipitate formed over the membrane during the
fouling test ... 59
Figure 3.4 – SEM micrographs and EDS spectrum from (a) the virgin membrane and (b) after
2,200 minutes of filtration ... 60 Figure 3.5 – Cleaning efficiency of several chemical agents ... 61
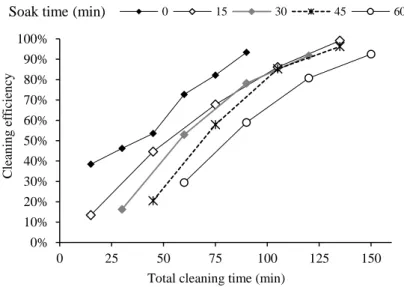
Figure 3.6 – Cleaning efficiencies obtained with 0.2% HCl solution over different cleaning
times. The total cleaning time includes soak and recirculation times. ... 62
Figure 3.7 – Water permeability variation as a function of time of exposure to the membrane
in contact with effluent (NFeff) and in contact with effluent and cleaning solution (NFeff +
clean) ... 64
Figure 3.8 – Retention of (a) magnesium sulfate and (b) glucose as a function of the exposure
time for the membrane in contact with effluent (NFeff) and in contact with effluent and
cleaning solution (NFeff + clean) ... 65
Figure 3.9 – SEM images of the NF90 membranes: (a) virgin, (b) exposed to the effluent after
285 days, and (c) exposed to the effluent and the cleaning solution after 285 days ... 66
Figure 3.10 – AFM images of the NF90 membranes: (a) virgin, (b) exposed to the effluent
after 285 days, and (c) exposed to the effluent and the cleaning solution after 285 days ... 66
Figure 3.11 – Experimental rejection data for methanol as a function of permeate flux and the
curves obtained from the nonlinear fit ... 67
Figure 3.12 – Infrared spectrums in the region between 1800 to 400 cm-1 to NF 90 membrane
exposed only to the effluent and to the combination of effluent and cleaning agent ... 71 Figure 4.1 – Schematic of UF and NF bench-scale unit ... 79 Figure 4.2 – Schematic of UF and NF pilot-scale unit ... 80 Figure 4.3 – Permeate flux and ratio of permeate flux to initial flux (J/J0) for different NF
Programa de Pós-graduação em Saneamento, Meio Ambiente e Recursos Hídricos da UFMG viii Figure 4.6 – Retention efficiencies of conductivity, sulfate, calcium, and arsenic at different
cross-flow velocities ... 91
Figure 4.7 – Nanofiltration permeate flux after 4 hours filtration and respective required pump power ... 92
Figure 4.8 – Conductivity retention efficiency and ratio of permeate flux by initial permeate flux for different permeate recovery rates with and without antiscalant dosage. Operating conditions: pilot-scale plant, feed flow rate 144 L/h, operating pressure 6 bar. ... 94
Figure 4.9 – (a) Permeate flux, and (b) permeate conductivity for the concentration test on bench and pilot scale without antiscalant ... 96
Figure 4.10 – NF permeate flux with and without forward flush physical cleaning. Operating conditions: pilot-scale plant, feed flow rate 90 L/h, operating pressure 6 bar, with antiscalant. ... 97
Figure 4.11 – NF permeate flux as function of time. The dashed line indicates the chemical cleaning. Operating conditions: pilot-scale plant, feed flow rate 90 L/h, operating pressure 6 bar, with antiscalant, no application of forward flush. ... 99
Figure 4.12 – Resistances to filtration after 100 and 215-hour continuous NF ... 99
Figure 4.13 – Characterization of UF feed, UF permeate and NF permeate in terms of (a) sulfate, (b) arsenic, (c) calcium and (d) magnesium. Dashed lines represented NF chemical cleanings. ... 101
Figure 4.14 – Permeate flux and permeability measured for bench and pilot NF ... 103
Figure 5.1 – Proposed treatment system for gold-mining effluent ... 112
Figure 5.2 - Schematic illustration of (a) UF and (b) NF units ... 113
Figure 5.3 – Calcium sulfate SIm versus RR of the second-stage NF, when no intermediate treatment of the first-stage NF concentrate was used ... 123
Figure 5.4 – Equilibrium concentrations of the cations Ca + and Mg + with the anions SO -, CO - and OH-, versus solution pH. ... 124
Figure 5.5 – Response surface of: (a) arsenic removal efficiency; (b) arsenic concentration in the dry slurry; and (c) coprecipitation cost, versus molar ratio of Fe/As and reaction pH ... 125
Figure 5.6 – Theoretical calcium removal efficiency for each potential RR value of the second-stage NF to maintain the SIm equal to 2.0 ... 128
Figure 5.7 – Response surface of: (a) calcium removal efficiency; and (b) precipitation cost, versus molar ratio of CO3/Ca and reaction pH ... 129
Figure 5.8 – Relation between flux and initial flux for the second-stage NF at different pH 132 Figure 5.9 – Retention efficiency of conductivity, sulfate and arsenic for the second-stage NF at different pH ... 133
Figure 5.10 – Permeate flux, osmotic pressure and fouling resistance as a function of second-stage NF permeate recovery rate ... 134
Figure 5.11 – Permeate and concentrate conductivity as a function of permeate recovery rate ... 135
ix
LIST OF TABLES
Table 2.1 – Minimum, maximum, average and standard deviation of the physico-chemical
parameters of twelve samples of the effluents studied ... 15
Table 2.2 - Characteristics of the five tested membranes ... 20
Table 2.3 - Characteristics of the real and synthetic effluent used for analysis of membrane surface zeta potential ... 25
Table 2.4 - Ratio of final UF permeate flux to initial flux (Jf/J0) and physic-chemical characteristics of raw effluent and UF permeates for different pH values ... 30
Table 2.5 - Membranes performance to treat the effluent from gold mining regarding intrinsic membrane resistance, fouling resistance and final permeate flux ... 31
Table 2.6 - Results for physico-chemical parameters of the raw effluent and permeates obtained with several membranes and their respective retention efficiencies... 32
Table 2.7 - NF90 membrane pollutant retention efficiencies for feed with different pH values ... 37
Table 2.8 - Hydrated radius of effluent ions ... 37
Table 2.9 - Percentage of permeate flux decrease during filtration due to concentration polarization and reversible and irreversible fouling formation ... 43
Table 2.10 – Supersaturation index of CaSO4 on membrane surface at different RR values .. 43
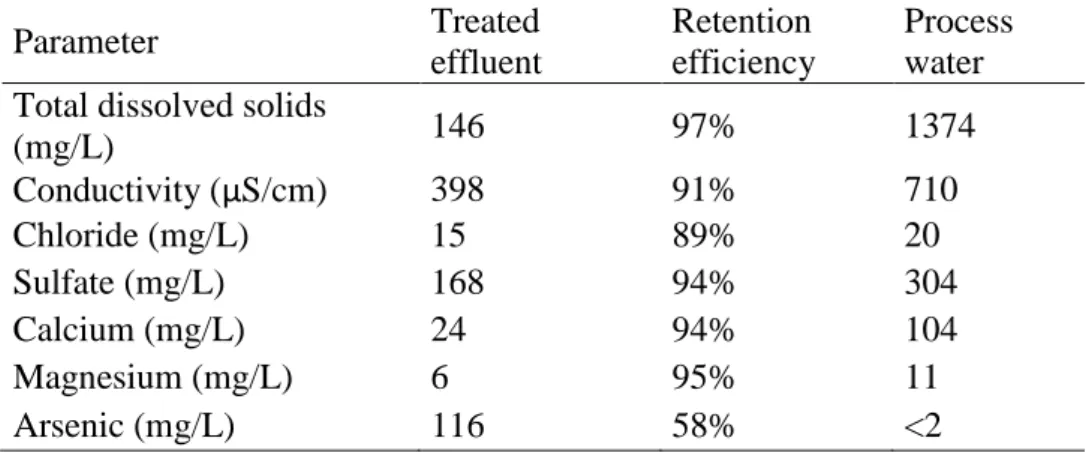
Table 2.11 – Quality parameters for the final treated gold mining effluent and cooling water and treatment retention efficiencies ... 44
Table 3.1 – Characterization of gold mining effluent and NF permeate ... 58
Table 3.2 – Resistance of gold mining effluent nanofiltration ... 60
Table 3.3 – Contact angle measurements of the virgin membrane and the membrane exposed to the effluent and to the effluent and the cleaning solution ... 65
Table 3.4 – Root mean square roughness (RMS) measurements of the NF90 membranes: virgin, exposed to the effluent, and exposed to the effluent and the cleaning solution for 285 days ... 67
Table 3.5 – Reflection coefficient values (), solute permeability (Pi), and pore radius (rp) for methanol ... 67
Table 3.6 – Main IR bands of polysulfone (PSF) and polyamide (PA) components of NF90 membrane in the region between 1800 and 800 cm-1 ... 72
Table 4.1 – Operating conditions of the pilot scale tests ... 82
Table 4.2 – Concentration polarization factor calculated for each operating pressure ... 89
Table 4.3 - Flow conditions tested... 91
Table 4.4 – CaSO4 supersaturation index at the membrane surface (SIm) for different permeate recovery rates during effluent nanofiltration without antiscalant. Operating conditions: pilot-scale plant, feed flow rate 90 L/h, operating pressure 6 bar, without antiscalant. ... 93
Table 4.5 – Retention efficiencies of conductivity, sulfate, calcium, and arsenic during operation with and without forward flush ... 98
Table 4.6 – Average physico-chemical characteristics and operating parameters of the UF of mixed gold mining effluent ... 102
Table 4.7 – Physico-chemical parameters of bench and pilot scale NF feed and permeate ... 104
Table 4.8 – Mining effluent treatment costs by UF and NF ... 104
Table 5.1 - Rotational central composite design of arsenic coprecipitation ... 117
Table 5.2 - Rotational central composite design of calcium precipitation ... 119
Programa de Pós-graduação em Saneamento, Meio Ambiente e Recursos Hídricos da UFMG x Table 5.4 – Characteristics of the effluent before and after chemical intermediate precipitation ... 131 Table 5.5 – Resistances determined after the concentration test of the second-stage NF ... 135 Table 5.6 – CaSO4 supersaturation index at the membrane surface (SIm) for different
permeate recovery rates of second-stage NF ... 136
Table 5.7 – Mining effluent treatment costs by two-stage UF and NF associated with
xi
LIST OF ABBREVIATIONS, ACRONYMS AND SYMBOLS
ΔC - Sum of the difference in molar concentrations of concentrate and permeate
𝑎 - Activity of component i on membrane surface
AFM - Atomic force microscopy
ATR-FTIR - Attenuated total reflection Fourier transform infrared
– Pre-exponential factor of Arrhenius equation
– Concentration of the specie i on bulk solution
– Concentration of the specie i on membrane/solution interface
– Concentration of the specie i on permeate
– Concentration in nanofiltration permeate
– Concentration in ultrafiltration permeate
– Concentration in the raw effluent
𝐻– Hydraulic diameter
– Diffusion coefficient of component i
EDS - Energy dispersive X-ray spectrometer
- Apparent activation energy for pure water transport through the membrane
FD – Flux decrement
Programa de Pós-graduação em Saneamento, Meio Ambiente e Recursos Hídricos da UFMG xii
ℎ . – Flux decrement due to chemically irreversible fouling
ℎ . – Flux decrement due to chemically reversible fouling
– Total flux decrement
h – Half the thickness of the feed spacer
ICP-OES – Inductively coupled plasma optical emission spectrometrometer
– Distilled water flux of the cleaned membrane
– Effluent flux
– Distilled water flux of the fouled membrane
– Distilled water flux of the virgin membrane
– Permeate flux
– Distilled water permeability of cleaned membrane
– Distilled water permeability of fouled membrane
– Mass transfer constant of specie i
′ - Solubility product constant based on molar concentration
– Distilled water permeability of virgin membrane
MF – Microfiltration
NF – Nanofiltration
- Viscosity-corrected water permeability
xiii
– Feed flow rate
– Membrane cell input channel radius
– Average logarithmic radius of the cell
– Membrane pore radius
– Radius of the solute
R – Gas constant
– Radius of stainless steel membrane cell
ℎ − – Chemically reversible fouling resistance
Re – Reynolds number
– Irreversible fouling resistance
– Fouling filtration resistance
– Reversible fouling resistance
– Membrane filtration resistance
RO – Reverse osmosis
ℎ − – Physically irreversible fouling resistance
ℎ − – Physically reversible fouling resistance
RR – Recovery rate
RRMS– Root-mean-squared roughness
Programa de Pós-graduação em Saneamento, Meio Ambiente e Recursos Hídricos da UFMG xiv
Sc – Schmidt number
- Supersaturation index over membrane/solution interface
SEM - Scanning electron microscopy
Sh – Sherwood number
SHP – Steric Hindrance Pore
SS – Suspended solids
T – Temperature
– Feed cross flow velocity
XRD - X-ray diffraction
- Activity coefficient of component i on membrane surface
ΔG – Variation of Gibbs free energy
Δπ– Difference in osmotic pressure of solution at concentrate and permeate streams
σ– Reflection coefficient
υ – Kinematic viscosity
𝜇– Dynamic viscosity
1
CHAPTER
___________________________________________________________________________
1.1 BACKGROUND AND JUSTIFICATION
Brazil has historically occupied a prominent position in the world production of gold. Between
1700 and 1850, Brazil entered its “Gold Cycle” period where the extraction and export of gold
and diamond were the main economic activities. During this period, Brazil was the world's
largest gold producer, mainly exploring the surface gold ore deposits in the Iron Quadrangle
region. Nevertheless, it was only in the 80s that the gold production in Brazil sharply increased
from approximately 20 to over 100 tones, because of the beginning of mining in Serra Pelada
region and increase in companies’ investment (PORTO et al., 2002). Nowadays, the Brazilian gold production has decreased, partly because of the depletion of the natural reserves and partly
because of the reduction in gold price; and it reached, in 2013, 79.6 tones (DNPM, 2014).
Gold has an extremely important monetary role as a reserve asset; and a large amount of all the
gold produced throughout history is now stored in central banks of several countries. Moreover,
the importance of gold is also closely related to jewelry production. Lastly, many other
industries, such as electro-electronic, chemical, perfumery, textiles, paper, and plastic, similarly
need gold in its processes (NERY and SILVA, 2001). Nevertheless, despite the economic
benefits of gold exploration and processing, it can cause various environmental impacts,
including the generation of wastewater with high pollution potential.
The idea of unlimited natural resources that could be used unrestrictedly by man is no longer
scientifically accepted. Modern society strives to guarantee the preservation of the environment,
allowing future generations to enjoy the natural resources needed for survival. As a result,
institutions responsible for environmental protection are gaining strength, and expanding its
involvement in companies’ supervision and pollution control through an increasingly restrictive
legislation. In terms of pollution control and rational water usage, in addition to imposing
increasingly restrictive wastewater discharge standards, there is a global tendency towards the
establishment of taxes for both water intake, and wastewater discharge. The industries situation
becomes progressively more critical once the supply of fresh water with appropriate quality to
conventional treatments has decreased gradually, which can create serious conflicts over water
use.
Although Brazil has a privileged and relatively stable water supply condition, the country has
already felt the effects of water shortage because of uneven water distribution and water
the country. The availability of water for public supply has been considerably impaired by this
climatic change; especially the semiarid region of Brazil, and the Southeast metropolitan areas,
which are densely populated and have higher water demand (ANA, 2014). This water shortage
may lead to increased water price, or even the restriction of water supply to other users.
Therefore, water reuse has become an environmentally and economically feasible solution for
industries. Water reuse can improve the industry's public image, and increase the industry
profits because of reduced expenses with water purchase and/or capitation, and decreased
dependency on local water sanitation companies. From an environmental perspective, water
reuse contributes to a reduction in natural water capitation, and allows the use of this natural
resource for nobler purposes, such as public water supply. It also leads to a decrease in
wastewater discharge, which reduces the environmental impacts of industrial sectors.
However, advanced treatment technologies with efficient pollutants removal are vital to safely
implement wastewater reuse in industrial sectors. While water reuse in industrial, domestic and
agricultural applications is a reality in many developed countries (ASANO et al., 2007), in
some countries, such as Brazil, it is still difficult to implement. This scenario is mainly caused
by lack of knowledge of the advanced processes, lack of investment to adapt the old treatment
systems to the new demands, public resistance to new technologies, and dependence on
imported products. Therefore, because of these limitations, the use of conventional processes
still prevails in Brazil. However, the main conventional wastewater treatment techniques are
characterized by high plant footprint, high operational cost, and low removal efficiency per
process. Therefore, research projects in advanced processes for wastewater treatment, such as
membrane separation one, at the same time increase the knowledge and disseminate these
technologies in the country, allowing scientific, technical and technological development. This
directly contributes to a more efficient treatment of effluents and an increasingly viable water
reuse practice in Brazil.
In the gold mining industries, the effluents are usually treated by neutralization, precipitation
and sedimentation processes (LANGSCH et al., 2012). Although this treatment system can
produce a treated effluent that complies with the Brazilian legislation for wastewater discharge,
it can hardly generate a water with the quality required for reuse (WANG et al., 2007). In this
case, the main limitation for water reuse is the high total solids concentration of the treated
corrosion problems. As a result, membrane separation processes, especially the ones that can
reject dissolved solids, are promising technologies for the treatment of this effluent aiming at
generation of reuse water.
According to Habert et al. (2006), membrane separation processes are those that use a selective
barrier (membrane) which can promote the separation of components of a solution or
suspension under a driving force. The membrane separation technologies have significantly
developed in recent years, as they have unique characteristics compared to conventional
industrial separation processes. Some examples of these unique characteristics include: the
absence of phase change for separation (as required for distillation), therefore minimizing
energy requirements; they do not require high chemicals addition (as liquid-liquid extraction);
allow the processing of thermolabile substances because they can operate at room temperature;
have high selectivity; are easily scaled because they have modular design; and do not require
extensive labor. Among the membrane separation processes, the importance of nanofiltration
and reverse osmosis must be emphasized since these processes are capable of retaining
dissolved salts and molecules, and have wide applicability in wastewater treatment and water
reuse (ACERO et al., 2010 a; KURT et al., 2012; QI et al., 2011).
Despite the successful cases involving membrane separation processes for the treatment of
mining effluents (AL-ZOUBI et al., 2010 a; BUZZI et al., 2011; RICCI et al., 2015; VACLAV
and EVA, 2005), further evaluation of the process type, membrane type, best operational
conditions and chemical cleaning processes for each specific application is still needed.
Besides, studies with synthetic effluents still predominate in literature. These studies do not
consider the effect of effluent matrix in process performance and cannot be used for scaling up
purposes. Additionally, the evaluation of membrane stability over effluent exposure time is
essential for estimating the membrane lifetime, and for discussing the application viability.
Furthermore, pilot scale tests are needed to consolidate the bench scale results; however,
because of many technical and economic constraints involved in pilot scale tests, few studies
with this approach were found in the literature. Lastly, few papers discuss the management of
the concentrate produced in membrane separation processes; this concentrate is a residue, and
needs to be treated and/or appropriately disposed. In membrane separation processes,
concentrate management is especially complex when the initial effluent has high concentration
of dissolved solids, since in this case the permeate recovery rate is usually low, and the
Therefore, the innovation of this thesis lies in: a) The evaluation of the application of membrane
separation processes in the treatment of real gold mining effluents, specially focused on the
process valuation through the generation of reuse water, on an understanding of the variables
that can influence the membrane retention and fouling, and on the evaluation of the membrane
stability after prolonged exposure to mining effluent; b) The study of the continuous operation
of an ultrafiltration and nanofiltration pilot scale unit treating gold mining effluent, and the
comparison of these results with those obtained in the bench scale unit; c) The proposal and
evaluation of an innovative treatment route for mining effluents, which includes the integration
of two-stage ultrafiltration-nanofiltration with a two-step intermediate precipitation; the first
step aimed at arsenic removal, and the second at calcium removal, in order to treat the
nanofiltration concentrate and increase the overall permeate recovery rate in the second
nanofiltration stage.
The hypotheses tested in this thesis were: a) that membrane separation processes (particularly
ultrafiltration and nanofiltration) are technically and economically advantageous in the
treatment of gold mining effluents, and that these processes can produce a treated effluent
suitable for industrial reuse; b) that the evaluation of a continuous operation in a pilot scale unit
can provide important information that could not be observed in bench scale tests; c) that the
innovative treatment route comprised of the two nanofiltration stages and the two-step
intermediate precipitation can increase the overall permeate recovery rate and treat the
nanofiltration concentrate.
1.2 OBJECIVES
1.2.1 General objective
The aim of this thesis was to evaluate membrane separation processes for the treatment of two
gold mining effluents (i.e. the effluent from the sulfuric acid production plant, and water from
the calcined dam) and production of reuse water. It focused on the evaluation of the best
operational conditions and membrane cleaning procedure, on the study of membrane stability,
1.2.2 Specific objectives
The specific objectives are:
1. Compare the applicability of nanofiltration versus reverse osmosis for the treatment of two
mixed gold mining effluents (effluent from the sulfuric acid production plant and water from
the calcined dam) and define the most suitable;
2. Study how the feed pH, process temperature and permeate recovery rate influence the effluent
nanofiltration on a bench scale unit;
3. Evaluate the best chemical cleaning agent, the cleaning procedure type (with or without
recirculation), and the duration of the chemical cleaning for the nanofiltration membrane;
4. Investigate the chemical and structural stability of the nanofiltration membrane exposed to
the mining effluent and to the cleaning solution;
5. Evaluate operating conditions (cross-flow velocity, operating pressure, antiscalant agent
usage, and physical and chemical cleaning frequency) in a pilot scale nanofiltration unit and
compare bench and pilot scale results;
6. Develop and study a treatment route based on integration of two nanofiltration stages with a
two-steps intermediate precipitation (the first step for arsenic removal and the second for
calcium removal), as alternative to increase reuse water production and to treat and dispose the
concentrate;
7. Conduct an investment estimate of the membrane processes and intermediate chemical
precipitation applied to the treatment of gold mining effluents.
1.3 DOCUMENT STRUCTURE
This thesis is divided into seven chapters. Chapter 1 is introductory. It contains the
context/justification and the main objectives of work, and publications derived from this thesis.
Chapter 2 is entitled "Operating conditions evaluation of membrane separation processes
applied to gold mining effluent". The specific objectives 1 and 2 are contemplated in this
The specific objectives 3 and 4 are addressed in Chapter 3. Its title is "Nanofiltration applied in
gold mining effluent treatment: evaluation of chemical cleaning and membrane stability".
In Chapter 4, "Comprehensive bench and pilot scale investigation of NF for gold mining
effluent treatment: membrane performance and fouling control strategies", addresses the
specific objectives 5 and 7.
Chapter 5 is entitled "Treatment of gold mining effluent by a two-stage nanofiltration process:
arsenic and calcium intermediate chemical precipitation”. It is associated to the specific
objectives 6 and 7.
Finally, in Chapter 6, "General conclusions", it may be found the main achievements of the
2
CHAPTER
___________________________________________________________________________
OPERATING CONDITIONS EVALUATION OF
MEMBRANE SEPARATION PROCESSES APPLIED
2.1 INTRODUCTION
Gold mining and ore processing are activities of great economic importance. Gold has been
used in many different applications, from raw material for jewelry manufacturing and monetary
reserve, to more technological applications such as the production of catalysts and
nanoparticles. On the other hand, gold ore exploitation and processing bring forth
environmental hazards that may go from natural habitat destruction to highly polluted effluent
release that may contaminate the environment (GETANEH and ALEMAYEHU, 2006).
Effluents from gold ore processing may carry high concentrations of heavy metals (such as As,
Cd, Cr, and Hg), as these elements are often present in minerals disseminated within the gold
ore (CHAN and DUDENEY, 2008; LANGSCH et al., 2012). Additionally, when the ore
contains sulfide minerals, processing may generate acid effluent (AKCIL and KOLDAS, 2006).
These effluents are usually treated by neutralization, precipitation and sedimentation (AKCIL
and KOLDAS, 2006; CORREIA, 2008; LANGSCH et al., 2012), although other technologies
such as anaerobic bioreactors (WILDEMAN et al., 2006), sorption (ACHEAMPONG and
LENS, 2014; MAGRIOTIS et al., 2014), coagulation and flocculation (ONCEL et al., 2013;
YAN et al., 2012), and crystallization (FERNÁNDEZ-TORRES et al., 2012) may also be used.
Nevertheless, these methods may be insufficient to adjust effluent properties to meet discharge
and/or reuse standards; require high consumption of chemical reagents; and generate large
volumes of metal-contaminated sludge (WANG et al., 2007).
Membrane separation processes, specifically nanofiltration (NF) and reverse osmosis (RO), are
effective technologies to retain salts and metals from aqueous medium (AL-RASHDI et al.,
2013; PAGES et al., 2013) presenting high potential to treat mining effluents for water reuse.
NF is an intermediate process between RO and ultrafiltration (UF) that may retain dissolved
molecules with molar weight ranging between 200 and 1,000 g/mol and multivalent ions (YU
et al., 2010). Many works have shown that NF is an efficient system for secondary or tertiary
treatment of effluents intended to supply water for industrial, agricultural and/or indirect reuse
as potable water (ACERO et al., 2010 a; ACERO et al., 2010 b; KOYUNCU et al., 2000; SHU
et al., 2005). The use of NF has been increasing due to advantages such as reliability, ease of
operation, low power consumption and high efficiency (FU and WANG, 2011).
RO systems use membranes that are permeable to water, but substantially impermeable to salts
weight (BAKER, 2004). One of the main applications of RO membranes is seawater
desalination (FU and WANG, 2011). Moreover, RO membranes have increasingly become
popular water recovery technology for industrial effluents (KURT et al., 2012; QI et al., 2011).
Sierra (2013) studied NF process for treating an acid mine drainage from an abandoned mercury
mine. NF was able to retain up to 99% of aluminum, iron and arsenic content, and 97% of
sulfate content. Other authors (AL-ZOUBI and AL-THYABAT, 2012) tested NF to treat an
effluent from a phosphate mine. Retention efficiencies between 61% and 69% for chloride,
nearly 100% for sulfate, and 83% for total solids were obtained, ensuring a treated effluent with
similar quality to the raw water that fed the system. Chan and Dudney (2008) evaluated
wastewater from gold ore bioleaching treated by neutralization, precipitation and sedimentation
followed by a post-treatment with RO. It was found that more than 90% of the arsenic that had
not been removed by the first treatment was retained by the membrane. Vaclav and Eva (2005)
studied a RO pilot plant operation treating three different mine wastewater types, and attained
total solid retention efficiencies ranging between 88% and 98%. Another study evaluated NF
and RO membrane performance to treat two synthetic acid mine drainage, including one with
high and other with low metal content (AL-ZOUBI et al., 2010 a). It was found that NF
membrane was more suited for such use as it handled higher permeate flux at lower power
consumption, although its rejections were smaller than RO membrane.
Despite the successful cases using different membranes for treating mining plant effluents,
membrane fouling limits membrane application in some cases, since it leads to an increase in
cost due to increased energy demand, additional labor requirements for maintenance, chemical
cleaning costs, and shorter membrane lifetime (SCHÄFER et al., 2005). Accordingly, fouling
control is essential for increasing membrane operational lifetime and thus reducing process
costs (ARNAL et al., 2011).
Surface fouling matter composition and structure depend on several factors, such as feed
composition and membrane surface properties (MADAENI and SAMIEIRAD, 2010). Fouling
control strategies include feed pre-treatment, membrane selection, and operation mode
(SCHÄFER et al., 2005). Thus, for each specific application, there remains the need for further
examination of the most appropriate system (NF or RO) and membrane type selection,
rate. Such assessment would be targeted to find ways to decrease membrane fouling formation,
increase retention efficiencies, reduce costs and optimize the whole system.
More effective pretreatment can reduce fouling and increase membrane lifetime. Literature
suggests that preliminary retention of colloids and fine suspended solids from effluents is
required to prevent severe fouling and avoid module damage or system obstruction
(MARCUCCI et al., 2003). Membrane separation processes, such as microfiltration (MF) and
UF, are often used as pretreatment for NF or RO systems, since these processes are more
competitive than conventional pretreatments (such as coagulation, flocculation, sedimentation,
or filtration). MF and UF produce high-quality effluent with low fouling potential and do not
require sludge treatment; this enables considerable savings in terms of equipment maintenance,
repair, and sludge dumping costs (MARCUCCI et al., 2003; VEDAVYASAN, 2000). System
productivity is high, since the backwash water from the MF/UF unit can be recycled to the feed
tank when no chemicals are added.
There are many mechanisms related to solute rejection through NF membranes, including steric
hindrance, the Donnan effect, and dielectric effects (NGUYEN et al., 2009). Thus, factors such
as membrane pore size, surface charge, and pore charge directly influence solute retention.
Commercial NF membranes are usually hydrophilic and are prone to hydration and ionization
in aqueous solution; the conformation and ionization of their polymeric chains will therefore
change in different surrounding conditions, especially at different feed pH values and ionic
strengths. Due to the nanoscale pore dimensions (~1 nm) and electrically charged materials of
the NF membrane, even a minor change in the pore size or charge pattern can have a significant
impact on membrane permeability and solute retention (LUO and WAN, 2013). Research has
consequently revealed that membrane solute retention efficiency can be highly dependent on
feed pH, which in turn can significantly affect the selection of operating conditions for a specific
effluent (CAPAR et al., 2006).
Analysis of the effect of feed pH on NF performance is quite complicated since both membrane
and solution properties vary significantly with solution pH; these variations are also dependent
on membrane material and solute characteristics. Although there has already been extensive
study and modeling of NF membrane performance for both single and multi-element solutions
of known composition at different feed pH values (CHILDRESS and ELIMELECH, 2000;
performance when treating complex effluents cannot be easily predicted (KRIEG et al., 2005).
Some authors have studied NF of real water or effluent at different feed pH values (CAPAR et
al., 2006; QIN et al., 2003; WANG et al., 2007); however, retention mechanisms and
membrane fouling were not thoroughly discussed. Understanding the effect of feed pH on NF
and then manipulating this can serve to improve wastewater treatment by enhancing the
separation performance and reducing fouling.
The effect of feed pH is even more important when NF membranes are used for the treatment
of acid mining effluent. Since low pH can cause changes in the membrane’s polymeric
structure, pH adjustment may be important not only to improve rejection efficiency and
permeate flux, but also to increase membrane lifetime. Moreover, pH adjustment is necessary
for water reuse or even for effluent discharge into water bodies, and this can be performed
before or after treatment or pretreatment.
According to the literature, feed temperature can also influence both permeate flux and solute
retention capacity (AMAR et al., 2009; DANG et al., 2014; KAYA et al., 2009; NILSSON
et al., 2008). Dang et al. (2014) and Amar et al. (2009) observed that increasing temperature
led to reduced retention of ionic and non-ionic solutes, but the effect on the latter was
significantly more marked. These results were attributed to increased pore size, which reduces
the effect of steric hindrance responsible for retention of the neutral solute. These observations
can also be explained by an increase in solute diffusion and an expansion of membrane matrix
at higher temperatures (KAYA et al., 2009).
Industrial processes often include operations associated with combustion, reactions at high
temperatures, steam production, distillation, etc.; these produce high-temperature wastewaters
streams. When processing gold ores, roasting (during which the ore sulfide is combusted and
converted into SO2/SO3) is often employed. Due to the high temperatures of the roaster, the
temperature of the effluent generated at this stage is above ambient temperature. Thus, it is also
necessary to assess the impact of temperature on the NF process, when this is applied to effluent
from gold ore processing.
In addition to pH and temperature, other operating parameters have a strong influence on NF
process performance. The permeate recovery rate (RR) is the relation between the permeate and
the feed volumes or flow rates. It is considered one of the main design parameters of systems
UF usually operate at 90-96% RR, for NF and RO these values are substantially lower (BI et
al., 2014). Since these membranes are much more permeable to water than to solutes, increasing
the RR induces an increase in salt concentration near membrane surface, and as well in the
concentrate osmotic pressure and in fouling formation. Thus, for a constant operating pressure,
increasing the RR on one hand improves system productivity, but on the other, leads to a
reduction in permeate flux.
Therefore, the study shown in this Chapter aims to investigate the use of NF and RO for gold
mining effluent treatment to obtain water for industrial reuse. Initially, different NF and RO
membranes were tested and the one with the greatest application potential was selected. Then,
tests were accomplished in order to evaluate the effect of operating conditions (feed pH,
temperature and permeate recovery rate) on membrane performance.
2.2 MATERIALS AND METHODS
2.2.1 Effluents from gold mining
Two effluents from a gold mining company in Brazil were studied, i.e., an effluent from a
sulfuric acid production plant and the water from the calcined dam. At this company, the gold
ore extracted from an underground mine undergoes processing (crushing, gravity separation
and flotation), and the concentrate is transferred to a pyrometallurgical processing unit. At this
stage, it is subjected to a roasting process by which gases containing sulfur dioxide and calcined
solids are produced. At the sulfuric acid production plant, SO2-rich gas is converted into SO3,
and then it is adsorbed in an acid solution. The effluent from the sulfuric acid production plant
was the first one to be analyzed.
The calcined solids undergo a hydrometallurgical process in which the gold is leached with a
sodium cyanide solution. The solid residue is separated from the gold-rich extractant solution
through a series of thickeners with counter-current flow. Finally, cyanide is oxidized and the
sludge residue is placed in a calcined dam. The second effluent was the supernatant water from
this dam.
In this study, the effluents were mixed at a 1:1 ratio (corresponding to actual wastewater flow
rates generated by the company, which are 140 m³/h of effluent from the sulfuric acid
membrane treatment system. The mixture of effluents is henceforth referred to as "gold mining
effluent."
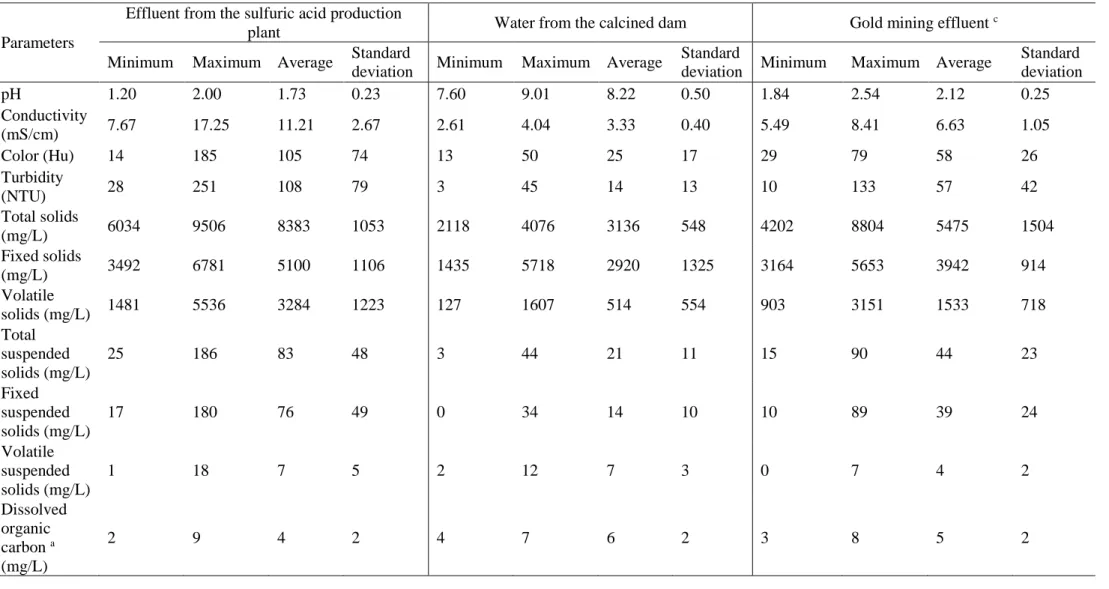
Twelve samples of each effluent were taken over almost two and a half years, between October
2013 and January 2016. The Table 2.1 shows the characterization of effluents and the mixture
between them. Analyses were conducted as explained in Section 2.2.5. As can be noted, the
effluent from the calcined dam has a basic pH, while the sulfuric acid production plant
wastewater has very acid pH and a high concentration of total solids, arsenic, aluminum, iron
and zinc. Neither effluent has an elevated concentration of suspended solids and organic matter.
On the other hand, the concentrations of sulfate, calcium, and magnesium are high in both
effluents and limit the reuse of wastewater.
Table 2.1 – Minimum, maximum, average and standard deviation of the physico-chemical parameters of twelve samples of the effluents studied
Parameters
Effluent from the sulfuric acid production
plant Water from the calcined dam Gold mining effluent
c
Minimum Maximum Average Standard
deviation Minimum Maximum Average
Standard
deviation Minimum Maximum Average
Standard deviation pH 1.20 2.00 1.73 0.23 7.60 9.01 8.22 0.50 1.84 2.54 2.12 0.25 Conductivity
(mS/cm) 7.67 17.25 11.21 2.67 2.61 4.04 3.33 0.40 5.49 8.41 6.63 1.05 Color (Hu) 14 185 105 74 13 50 25 17 29 79 58 26 Turbidity
(NTU) 28 251 108 79 3 45 14 13 10 133 57 42 Total solids
(mg/L) 6034 9506 8383 1053 2118 4076 3136 548 4202 8804 5475 1504 Fixed solids
(mg/L) 3492 6781 5100 1106 1435 5718 2920 1325 3164 5653 3942 914 Volatile
solids (mg/L) 1481 5536 3284 1223 127 1607 514 554 903 3151 1533 718 Total
suspended solids (mg/L)
25 186 83 48 3 44 21 11 15 90 44 23 Fixed
suspended solids (mg/L)
17 180 76 49 0 34 14 10 10 89 39 24 Volatile
suspended solids (mg/L)
1 18 7 5 2 12 7 3 0 7 4 2 Dissolved
organic carbon a
(mg/L)
Parameters
Effluent from the sulfuric acid production
plant Water from the calcined dam Gold mining effluent
c
Minimum Maximum Average Standard
deviation Minimum Maximum Average
Standard
deviation Minimum Maximum Average
Standard deviation Carbonate a
(mg/L) 1 1 1 0 80 107 96 11 41 54 48 5 Sulfate
(mg/L) 3061 6481 4713 1296 997 1944 1681 299 2091 4126 3135 866 Chlorine
(mg/L) 4 254 63 89 4 500 226 161 53 370 162 127 Calcium
(mg/L) 273 895 606 292 405 629 519 123 290 507 403 79 Magnesium
(mg/L) 193 547 360 145 31 317 132 127 81 420 186 137 Aluminum
(mg/L) b - - 108 - - - 0.1 - - - 68 -
Cobalt
(mg/L) b - - 1 - - - 0.4 - - - 1 -
Copper
(mg/L) b - - 13 - - - 0.2 - - - 8 -
Iron (mg/L) b - - 100 - - - 0.2 - - - 34 -
Manganese
(mg/L) b - - 25 - - - < 0.1 - - - 22 -
Nickel
(mg/L) b - - 1 - - - 0.2 - - - 1 -
Potassium
(mg/L) b - - 41 - - - 52 - - - 44 -
Sodium
(mg/L) b - - 30 - - - 168 - - - 77 -
Zinc (mg/L)
Parameters
Effluent from the sulfuric acid production
plant Water from the calcined dam Gold mining effluent
c
Minimum Maximum Average Standard
deviation Minimum Maximum Average
Standard
deviation Minimum Maximum Average
Standard deviation Arsenic 5+ a
(mg/L) 92 163 128 50 4 5 4 1 96 96 96 0 Arsenic 3+a
(mg/L) 792 954 873 114 1 3 2 2 378 469 424 64 Total arsenic
a (mg/L) 885 1117 1001 164 4 9 7 3 474 565 519 64
a Only five samples were analyzed by these parameters b Only two samples were analyzed by these parameters
2.2.2 Experimental setup
Figure 2.1 shows a schematic view of the pretreatment UF and NF/RO bench scale setup. The
maximum allowed operating pressure of the UF setup was 0.7 bar, with this provided by a
diaphragm pump of maximum flow 138 L/h equipped with a speed controller. Pressure was
measured using a manometer and was adjusted via a needle-type valve.
With respect to NF/RO setup, the maximum allowed operating pressure was 15 bar, with this
provided by a rotary vane pump (Procon) of maximum flow 530 L/h. A needle valve was used
to adjust the feed flow rate and trans-membrane pressure. The stainless steel cell had a diameter
of 9.8 cm and an effective filtration area of 75 cm². A 28 mil (711 µm) feed spacer was placed
over the membrane to promote effluent distribution. Permeate flux was determined by
measuring the volume of permeate produced over 60 s for NF and 120 s for RO using a
graduated cylinder.
(a)
(c)
Figure 2.1 - Schematic illustration of (a) UF and (b) NF/RO units and (c) schematic and photograph of the NF/RO membrane cell
2.2.3 Membranes
Pretreatment was conducted via UF, performed with a commercial submerged membrane
module (ZeeWeed by Zenon) with a filtration area of 0.047 m2, a PVDF-based polymer, and
average pore diameter of 0.04 µm.
The performances of five NF/RO membranes were evaluated during the treatment of the
effluent from gold mining. RO membranes were TFC-HR and BW30, while NF membranes
were MPF34, NF90, and NF270. The characteristics of the membranes studied, as provided by
the suppliers, unless otherwise specified, are shown in Table 2.2. The membranes were
Table 2.2 - Characteristics of the five tested membranes
Characteristic TFC-HR BW30 MPF34 NF90 NF270
Supplier Koch
Membranes Dow Filmtech Koch Membranes Dow
Filmtech Dow Filmtech
Membrane material
Polyamide Composite
Polyamide
Composite Composite
Polyamide Composite
Polypiperazine Composite
NaCl
Rejection 99.55% a 99.5% b 35% c 85-95% b n.a.
MgSO4
Rejection n.a. n.a. n.a. >97%
d 97% d
Molecular weight cutoff (Da)
100 e 100 f 200 g 100 h 200-300 g
pH range for continuous operation
4 to 11 2 to 11 0 to 14 3 to 10 3 to 10
n.a. Not available
a Feed solution containing 2,000 mg/L of NaCl, filtration at 15.5 bar, 25°C, and recovery rate of 15%. b Feed solution containing 2,000 mg/L of NaCl, filtration at 4.8 bar, 25°C, and recovery rate of 15%. c Feed solution containing 50,000 mg/L of NaCl.
d Feed solution containing 2,000 mg/L of MgSO4, filtration at 4.8 bar, 25°C, and recovery rate of 15%. e Reference: XU et al., 2005
f Reference: GAUTAM and MENKHAUS, 2014 g Reference: WANG and TANG, 2011
h Reference: ZULAIKHA et al., 2014
2.2.4 Experimental procedure
Experiments were conducted using UF and NF/RO membranes to investigate the effect of type
of membrane, pH, temperature and permeate recovery rate on permeate flux, rejection of total
Before each test, UF membrane was cleaned with a 200 ppm NaClO solution in an ultrasound
bath for 20 min. The membrane was then flushed with distilled water. All UF experiments were
conducted at 0.3 bar.
NF/RO membrane samples were also cleaned by soaking in citric acid solution at pH 2.5
followed by 0.1% NaOH solution in an ultrasound bath for 20 min prior to use. Before each
experiment, NF/RO membranes were flushed and compacted with distilled water at 10 bar until
the permeate flux stabilized.
While filtrating effluent, the NF/RO setup was operated in semi-continuous mode with
concentrate recycling to the feed tank. All NF/RO experiments were conducted at 10 bar and
feed flow rate of 144 L/h, which resulted in 1.9 m/s cross-flow velocity and a Reynolds number
(Re) of 847. The Re was calculated according to Equation 2.1.
= 𝐻
𝜇 Equation 2.1
where is the density (kg/m³) of the effluent, which was assumed to be equal to the water;
is the feed cross flow velocity (m/s); 𝐻 is the hydraulic diameter (m) and 𝜇 is the dynamic
(N.s/m²) viscosity.
The feed cross flow velocity ( ) was calculated by Equation 2.2 (MINNIKANTI et al., 1999).
= Equation 2.2
wherein is the feed flow rate (m³/s); h is the half the thickness of the spacer (m); and
is the average logarithmic radius of the cell, which is calculated by Equation 2.3.
= − Equation 2.3
wherein R is the radius of the stainless steel cell (m); and is the membrane cell input channel
2.2.4.1 UF pretreatment
The benefits of gold mining effluent pretreatment with UF were assessed. For this purpose, 2 L
of raw effluent were stored and 3.3 L were ultrafiltered. Nanofiltration of pretreated and raw
effluents were carried out for 2 hours using NF90 membrane. NF permeates of pretreated and
raw gold mining effluents were analyzed for total solids (Section 2.2.5).
NF permeate flux was measured each 15 minutes. The feed temperature was monitored and
permeate flux measures were normalized to 25 ºC. Normalization was accomplished through
two correction factors, one related to fluid viscosity and the other to membrane polymeric
structure. The fluid viscosity correction factor was defined as the ratio of water viscosity at the
temperature of permeation to water viscosity at 25 °C (DRAK et al., 2000). The second
correction factor was related to the activation energy for water permeation and was calculated
using the Arrhenius equation (KURT et al., 2012) (Equation 2.4).
= . exp − 𝑊
. Equation 2.4
where is viscosity-corrected water permeability (m³/h.m².Pa), is the apparent activation
energy for pure water transport through the membrane (J/mol), is the pre-exponential factor
(m³/h.m².Pa), R is a gas constant (J/mol.K), and T is temperature (K). and were
calculated by measuring distilled water permeability at 20 ºC, 24 ºC, 28 ºC, 32 ºC, and 36 ºC
and fitting the experimental data.
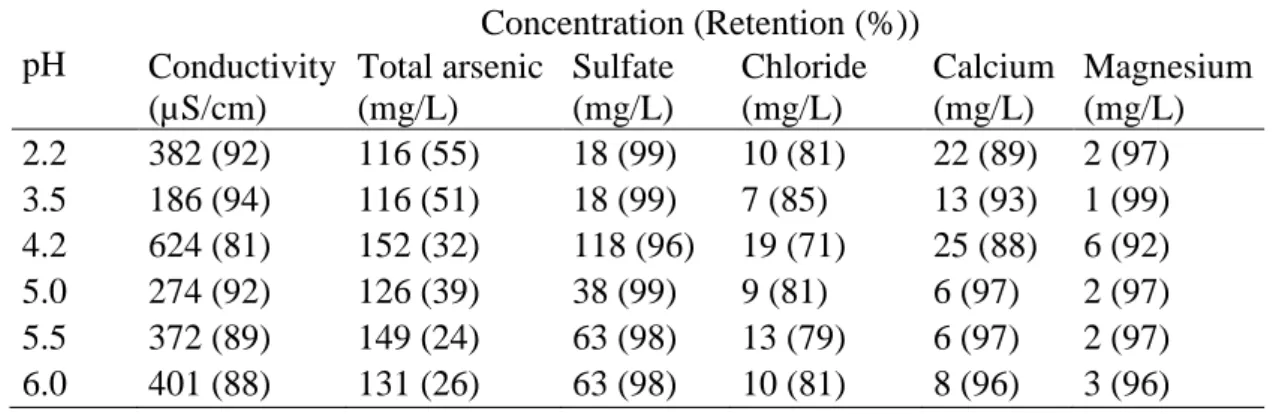
2.2.4.2 Influence of feed pH on UF pretreatment
Process water cannot have acidic pH, as to prevent possible wear and corrosion of equipment
and piping. Thus, for reuse of the treated effluent, its pH must be adjusted to approximately 7.0
(ASANO et al., 2007). Such adjustment can be performed before or after the pretreatment and
the NF/RO treatment. Therefore, UF was tested at several pH values, namely 2.2 (original
effluent pH), 3.5, 4.2, 5.0, 5.5, and 6.0.
A 5.0 M NaOH solution was used for the effluent pH adjustment. After adjustment, 6.6 liters
of effluent was ultrafiltered up to a permeate recovery rate of 60%. UF permeate flux were
monitored. The conductivity and concentrations of arsenic, sulfate, chloride, calcium and