No 577 ISSN 0104-8910
Is There a Price Puzzle in Brazil? An
Application of Bias–Corrected Bootstrap
Os artigos publicados são de inteira responsabilidade de seus autores. As opiniões
neles emitidas não exprimem, necessariamente, o ponto de vista da Fundação
Is There a Price Puzzle in Brazil? An
Application of Bias-Corrected Bootstrap
Rubens Penha Cysne
yDecember 3, 2004
Abstract
Using data from the United States, Japan, Germany , United King-dom and France, Sims (1992) found that positive innovations to short-term interest rates led to sharp, persistent increases in the price level. The result was con…rmed by other authors and, as a consequence of its non-expectable nature, was given the name "price puzzle" by Eichen-baum (1992). In this paper I investigate the existence of a price puzzle in Brazil using the same type of estimation and benchmark identi…ca-tion scheme employed by Christiano et al. (2000). In a methodological improvement over these studies, I qualify the results with the construc-tion of bias-corrected bootstrap con…dence intervals. Even though the data does show the existence of a statistically signi…cant price puzzle in Brazil, it lasts for only one quarter and is quantitatively immaterial.
1
Introduction
The term "price puzzle" has been introduced in the Vector-Auto-Regression (VAR) literature by Eichenbaum’s (1992) comment to a paper by Sims (1992).
I thank the participants of workshops at the Department of Economics of the Univer-sity of Chicago and at the Graduate School of Economics of the Getulio Vargas Foundation for their comments. I am also thankful to Lutz Kilian, for making available some of the computer codes used in this work. The usual disclaimer applies. Key Words: Price Puz-zle, Bootstrap, Bootstrap-After-Bootstrap,VAR, Vector-Auto-Regression, Bias-Corrected Bootstrap. JEL: J30, I30, D33.
yProfessor at the Getulio Vargas Foundation Graduate School of Economics
In this paper, Sims used the VAR methodology and found out that positive innovations to short-term interest rates led to sharp, persistent increases in the price level in Japan, France, United States, Germany and United King-dom. The data were monthly and included, for each country, a short-term interest rate, a monetary aggregate, a consumer-price index, an industrial-production index, an index of the foreign exchange value of domestic currency and a commodity price index.
The positive response of prices to the interest rate was found by Sims (1992) to be particularly strong and persistent in France and Japan. In the other countries the responses were weaker and would eventually (in a 48-month horizon) become negative. Running the VAR without the commodity price index and the exchange rate did not substantially modify the results.
Even though there are some models 1 capable of delivering periods of
in‡ation after a monetary contraction, the common view points out in the opposite direction, thereby the term "price puzzle".
Sim’s explanation to the puzzle is primarily based on the bias in the estimation of the coe¢cients, on account of possibly-missing variables. He argues that the monetary authority often has information regarding in‡a-tionary pressures not captured in the history of the variables included in the VAR. For instance, by knowing of a supply shock, and that in‡ationary pressure is about to arrive, the authorities can take the preemptive action of raising interest rates, thereby generating a positive (though spurious) corre-lation between prices and interest rates.
One theoretical consequence of this "missing-variable" explanation is that the same bias (of the estimated parameters of the model) should a¤ect all other responses, not only the one related to the price index. Under such circumstances, the fact that the response of the other variables to an increase of interest rates behaved accordingly to the common sense would lose part of its appeal.
The "missing variable" also implies a subsequent search for one or more variables to be included in the VAR. This has been made, with relative success, by Sims and Zha (1999) and by Christiano et al. (1997 and 2000). These works show that the inclusion of one single leading variable (usually some speci…c commodity price index) can do the job: the so called "price puzzle" often disappears.
A …rst purpose of this paper is to investigate if the same type of phenom-enon (prices reacting positively to an increase of the interest rate) happens with quarterly Brazilian data ranging from 1980/1 to 2004/2. Some previous
1Christiano et al. (2000) mentions, e.g., Beaudry and Devereaux (1995), Fuerst (1992)
assessments of this paper using Brazilian data are duly referred to in section 3.1.
A second purpose is to illustrate the use of bias-corrected bootstrap in the construction of con…dence intervals for impulse-response functions.
Regarding the technicalities concerning the estimation of the VAR (the type of orthogonalization, the assumption of …xed coe¢cients over the whole sample range2, which variables to include, the type of estimation (if in levels
of …rst di¤erences)) I will strictly follow Christiano et al. (2000) and will not consider alternative estimations procedures. Therefore, my answer to the problem is conditional on using Christiano et al.’s (2000) speci…cations. The only degree of freedom I will explicitly consider regards the number of lags to include in the VAR.
The reason for following Christiano et al.’s (2000) speci…cations is that these authors were able to generate the puzzle, as well as to solve it (by adding an extra variable), with di¤erent sets of data. Using their speci…cations, therefore, allows for the establishment of a well known benchmark for the purpose of comparisons.
One important improvement of the analysis I develop here, relatively to the ones by Sims (1992), by Eichenbaum (1992), and by Christiano et al. (2000), is the inclusion of con…dence bands generated by the method of bias-corrected bootstrap. Sims (1992) does not provide con…dence intervals. Eichenbaum uses the parametric Monte Carlo integration procedure of Doan (1990), whereas Christiano et al. (2000) employ the standard bootstrap technique. It happens, though, that these procedures do not perform well in small samples, due to the bias of the estimators of the A.R. processes. Here I use the bias-corrected methodology proposed by Kilian (1998).
2
The Bias-Corrected Con…dence Bands
As shown by Tjostheim and Paulsen (1983), Nicholls and Pope (1988) and Pope (1990), among others, the application of the standard bootstrap pro-cedures to auto-regressive models generates replicates which are necessarily biased, on account of the small-sample bias of the estimators of the parame-ters. In order to deal with this problem, speci…cally regarding the con…dence intervals for impulse-response functions constructed from VAR estimates, Kilian (1998) proposed correcting the bias prior to bootstrapping the esti-mate.
2See Fiorencio and Moreira (1999) for a VAR analysis in which the coe¢cients are
This correction is important. When based on the standard techniques, the bias and skewness of the impulse-response estimators in small samples can lead to very inaccurate intervals. Exemplifying with a previous paper by Bernanke and Gertler (1995), Kilian (1998) has shown that some key stylized facts of the VAR literature can fail to be supported by the data, when bias-corrected bootstrap bands are used3,4.
In general, the bias correction can be accomplished by a nested-bootstrap procedure, in which the inner bootstrap is used to correct for the bias of the coe¢cients, and the outer bootstrap to generate the con…dence bands of the impulse-response functions. Kilian (1998) called this procedure bootstrap-after-bootstrap.
Kilian also points out that the employment of a closed-form solution to the bias proposed by Pope (1990) can simplify the procedure, by making the inner bootstrap unnecessary. Pope’s solution is available for the case of demeaned VARs run in levels, with a nonzero intercept, and without trend. The main result reads:
Theorem 1 (Pope (1990)): Let A^n be the least-squares estimator of A in
the m-dimensional AR(1): Xt = AXt 1 +Zt; in which Xt and Zt are mx1
and A is mxm, based on a sample of size n. Make:
Cn(s) = 1
n 1
n 1
X
i=1
Ui sUiT
where Ut=Xt Xn; Xn the sample mean. Suppose that, for some" >0; E k Cn(0) 1
k1+" (k : k states for the operator norm) is bounded as n ! 1
and that the innovations Zt are a martingale di¤erence sequence such that
all moments of Zt up to and including the sixth, conditional on the past,
are …nite and have values independent of t. Let G denote the conditional covariance of Zt; and suppose that k A k< 1: Then, as n ! 1; the bias Bn=EA^n A is of the form:
Bn= b
n +O(n
3=2
) (1)
3In the Monte Carlo studies carried out by Kilian (1998, p.222), the relative frequency
at which the 95% con…dence interval covers the true impulse response (in a model like the one used here) can be as low as 50% when standard bootstrap methods are employed. The bias-corrected bootstrap, on the other hand, presents a frequency around 90-95%. In general, the amount by which the bias-corrected bootstrap outperforms his competitors depends on the persistence of the process, on the sample size and on the inclusion or not of a time trend.
4The bias-corrected bootstrap detailed here has been primarily designed for stationary
where b is given by:
b=Gh(I AT) 1
+AT(I (AT)2
) 1
+X (I AT) 1i
(0) 1
(2)
The sum is over eigenvalues of A;weighted by their multiplicities, and (j) = EXtXtT+j:
Proof. See Pope (1990).
Since the type of VAR speci…cation assumed by Pope (1990) is the same I shall use here, I perform the bias correction through the employment of (1) and (2). The key point to note is that the bias for the bootstrap is re-estimated, and new coe¢cients are generated, in each re-sample of the bootstrap.
3
Empirical Results
3.1
Previous Evidences Using Brazilian Data
In an analysis the main purpose of which was comparing the e¤ectiveness of monetary policy in three di¤erent periods of the Brazilian economy ((1975-1985), (1985-1994) and (1994-2000)), Minella (2001, section 3.3, 2003) pro-vides estimates that can add to our interests here. His estimates were based on monthly data and did not include the data on bank reserves. His impulse-response bands were constructed using Doan’s (1990) Monte Carlo procedure (standard in the software RATS). Most of the time, Minella works with in-‡ation, rather than with the price level. For our purposes here, only the regressions ran in levels are of direct interest. In such cases, which only cover the third subsample (Figures 5 and 7 in the original) no "price puzzles" are found5. The same conclusion is obtained by Fiorencio and Moreira (1999,
Tables 3A and 3B, in this case using constant parameters) concerning both periods before and after the Real Plan.
5Regarding the regressions run in growth rates, Minella (2001, 2003) found no
3.2
New Measurements
Lety,p,r,resandmdenote, respectively, the log of realGDP, the logarithm of the price index, the short term interest rate, the logarithm of total (bank) reserves and the logarithm ofM1. The primitive data onp,m andrare from
IBRE-FGV’s6 data bank. The quarterly GDP index and bank reserves are
from IPEA7.
Since the purpose here is the assessment of the existence of a price puzzle, in all econometric evaluations the policy instrument is the short-term interest rate. As mentioned before, the benchmark speci…cation is the same as in Christiano et al. (2000). Particularly regarding the ordering of the variables in the VAR, I use8: y, p, r, res, m.
Under this ordering of the variables, the information set assumed to be available to the government at time t, when choosing the interest rate to target, includes the current and lagged values of y and p, as well as lagged values of r, res and m. As a consequence of the ordering of the variables in the VAR and of the Cholesky-orthogonalization assumption, neither the price level at time t nor the GDP at time t are supposed to change as a consequence of a contemporaneous interest-rate shock. This can be noticed in Figure 1, in Figure 2, and in Table 1 of this work.
3.3
The Overall Dynamics of the Model
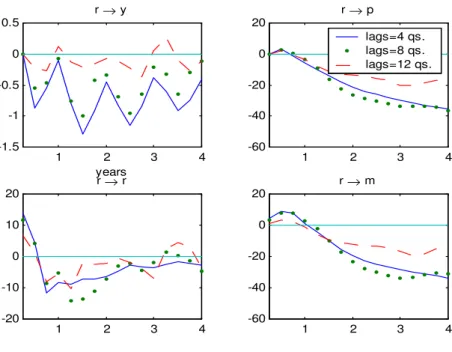
I start by running the VARs with four, eight and twelve lags. Each equation in the system includes the lags of the variables and an intercept. In particular, this time frame is supposed to capture possible seasonalities of the data. The sample period has been mentioned before. Figure 1 plots the most important response, for our concerns, of a one-standard-deviation shock to the interest rate. In Figures 1 and 2 (but not in Table 1), the response of the variables in logarithm have been multiplied by 100. The total horizon is equal to 16 quarters9.
6Instituto Brasileiro de Economia da Fundação Getulio Vargas. 7Instituto de Pesquisa Econômica Aplicada.
8Christiano et al. (2000) also includes the logarithm of the non-borrowed reserves
(NBR) betweenresand m:I do not include this variable here.
9The maximum estimated absolute value of the eigenvalues of the A.R. matrix for 4, 8
and 12 lags are, respectively, 0.9815, 0.9829 and 0.9930. Reestimations of the VAR over the same sample period lead to values of the Akaike Information Criterion, respectively, for the model with 4, 8 and 12 lags, of 1.0969 1.1392 and -0.7527. This suggests the use of the model with 12 lags. Even though we are dealing with a small sample, I also performed a log-likelihood test under a null of 12 lags and an alternative of 8 lags. Asymptotically,
1 2 3 4 -1.5 -1 -0.5 0 0.5
r→ y
years
1 2 3 4
-60 -40 -20 0 20
r→ p
lags=4 qs. lags=8 qs. lags=12 qs.
1 2 3 4
-20 -10 0 10 20
r→ r
1 2 3 4
-60 -40 -20 0 20
r→ m
Figure 1: Response of y, p, r and res to a shock in r.
As one can notice from Figure 1, the response of prices and reserves to a one-standard-deviation shock of interest rates look very much alike, either for 4, 8 or 12 lags. Regarding GDP, the inclusion of 12 lags leads to a recovery of real GDP before the end of the …rst year, the same pattern not being observable in the case of 4 and 8 lags. As one would expect, the e¤ect of raising interest rates on GDP is negative in all cases. The response of total reserves to the interest rate is positive till the end of the …rst year, and negative afterwards.
Particularly regarding the e¤ect on prices, our main concern here, all alternatives lead to a very close pattern. By the eye, the …rst impression from the upper-right …gure above is that there is indeed a very small price puzzle in Brazil, for a period of around three months10, but of a very small
value found was 367:2, con…rming the Akaike-Criterion option for 12 lags. Sims’ (1980) bias-corrected version of this test calls for multiplying this statistics by (n1 n2)=n1;where
n1 is the number of periods e¤ectively used in the regressions and n2 is the number of parameters estimated in the equation with the highest number of parameters. This leads to a new statisticss= 367:2 (86 61)=86 = 106.74. The new p-value of0:3049does not point out so de…nitely in favor of12lags.
10In Sims (1992), the positive response of prices to an interest-rate shock can last from
magnitude. The proper statistical answer to this question, though, requires the construction of adequate con…dence bands for the response functions.
3.4
Is There a Price Puzzle in Brazil?
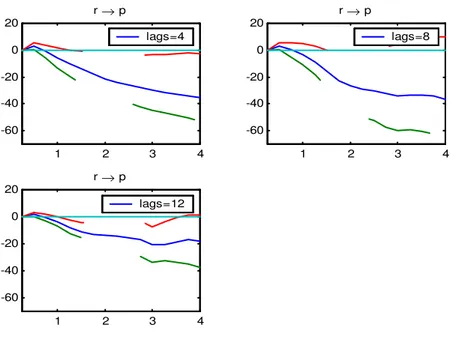
In this subsection I concentrate on the main point in this paper: checking if the response of prices to interest rates happens to be positive for some time. With this purpose, Figure 2 displays the estimated impulse-response func-tions, as well as the 90% nominal coverage bias-corrected bootstrap bands for a number of lags equal to 4, 8 and 12, and a horizon of 48 months. The dotted lines depict, in the obvious way, the lower and upper con…dence in-tervals. The con…dence intervals correspond to the 5th and 95th percentiles
of 1000 bias-corrected bootstrap replications of the I.R. function. The solid line depicts the response of prices (p). Note that we are dealing here with a relatively small sample. The overall sample has 98 data points of each variable. In the worst-case scenario of 12 lags, for instance, only 86 points are e¤ectively used in the regressions. Therefore, the OLS estimation of each equation in this case has only 86 5 12 1 = 25 degrees of freedom. For this reason, con…dence bands based on limiting distributions would not be adequate. This makes a point for the use of alternative methods, the bias-corrected bootstrap in particular.
It is clear from Figure 2 that there is no price puzzle for horizons superior to one year. This allows us to concentrate our attention only in the initial periods. The values of the lower band (lb), upper band (ub) and of prices, till the third quarter, for VARs ran with 4, 8 and 12 lags, are given by the table below:
As the data shows, there does exist a positive response of prices to an increase interest rates. However, it is statistically signi…cant for just one quarter, and has the magnitude no greater than3:2%in a quarter. In the case with 4 lags, for instance, this corresponds to around 28% (0:03197=0:1158)
of one (conditional) standard deviation of (the logarithm of) prices11.
11The number0:1158, the one-step-ahead forecast error of prices (a relatively high error
1 2 3 4 -60
-40 -20 0 20
r→ p
lags=4
1 2 3 4
-60 -40 -20 0 20
r→ p
lags=8
1 2 3 4
-60 -40 -20 0 20
r→ p
lags=12
4
Shortcomings
The statistical analysis developed here has at least two shortcomings. First, the non-diagonal terms of the covariance matrix are not close to zero, making the results dependent on the ordering of estimation of the VAR. Therefore, the conclusions are contingent to the ordering y,p, r, resand m:
Second, during the period covered by the data, the Brazilian economy went through six di¤erent stabilization Plans and several institutional changes12.
Even though one can argue that some of these stabilization plans could be inferred from the data we use here, it is reasonable to assume that the sigma algebra generated by such stochastic processes is a poor approximation of the information available to economic agents in general.
5
Conclusion
In this paper I have investigated the possibility of the existence of a price puzzle in Brazil, as it happened with United States, Japan, Germany , Britain and France, according to the VARs estimated by Sims (1992), Eichenbaum (1992) and Christiano et al. (2000), among others. I have addressed the problem using the same estimation procedures employed by Christiano et al. (2000). As a methodological improvement over these studies, I have provided bootstrap con…dence bands based on bias-corrected estimated coe¢cients.
The conclusion of the work, contingent on the estimation procedures and on the provisos detailed above, is that even though the data does show that prices increase when interest rates increase, the e¤ect is quantitatively and temporally insigni…cant. It lasts for only one quarter and has a magnitude no greater than3:2%;or around28%of the standard deviation of (the logarithm of) prices.
References
[1] Beaudry, Paul and Michael B. Devereux, 1995, Money and the Real Exchange Rate with Sticky Prices and Increasing Returns. Carnegie Rochester Conference Series on Public Policy, Vol. 43, pages 55 - 101.n
[2] Bernanke, Ben S., and Mark Gertler, 1995, Inside the Black Box: The Credit Channel of Monetary Policy Transmission, Journal of Economic Perspectives 9, 27–48
[3] Christiano, Lawrence J., Martin Eichenbaum and Charles L. Evans, 1997, Sticky Price and Limited Participation Models: A Comparison. European Economic Review, Vol. 41, No. 6, pages 1201-1249.
[4] Christiano, Lawrence, Martin Eichenbaum and Charles Evans, 2000, “Monetary policy shocks: what have we learned and to what end?” In Michael Woodford and John Taylor, eds., Handbook of Macroeconomics North Holland.
[5] Cysne, Rubens P. (2002), "Micro and Macroeconomic Aspects of the Brazilian Reforms" in "Brazil in the 1990s: An Economy in Transition", edited by Baumann, R., Palgrave Macmillan, New York.
[6] Doan, Thomas A., 1990, RATS User’s Manual, Version 3.10 (Evanston, IL: VAR Econometrics).
[7] Eichenbaum, Martin, 1992, Comments on Interpreting the macroeco-nomic time series facts: The e¤ects of monetary policy, by Christopher Sims. European Economic Review 36, 1001-1012. North-Holland.
[8] Fiorencio, Antonio, and Ajax R. B. Moreira (1999), “Latent Indexation and Exchange Rate Passthrough”, Rio de Janeiro, IPEA, Texto para Discussão no. 650, Jun.
[9] Fuerst, Timothy, 1992, Liquidity, Loanable Funds, and Real Activity. Journal of Monetary Economics, Vol. 29, No. 1, February, 3 - 24.
[10] Kilian, L., 1998, Small-Sample Con…dence Intervals for Impulse-Response Functions. The Review of Economics and Statistics, 80, 218-230.
[11] Minella, A., (2001), Monetary Policy and In‡ation in Brazil (1975-2000): a VAR Estimation, Working Paper Series 33, Central Bank of Brazil.
[12] Minella, A., (2003), Monetary Policy and In‡ation in Brazil (1975-2000): a VAR Estimation, Rev. Bras. Econ. vol.57 no.3 Rio de Janeiro.
[13] Nicholls, D. F., and A. L. Pope, 1998, Bias in the Estimation of Multi-variate Autoregressions, Australian Journal of Statistics 30A, 296–309.
[15] Sims, Christopher A., 1980, Macroeconomics and Reality, Econometrica, 48:1-48.
[16] Sims, Christopher A., 1992, Interpreting the macroeconomic time series facts: The e¤ects of monetary policy, European Economic Review 36, 975-1001 North-Holland.
[17] Sims, Christopher A. and Tao Zha, 1999, Error Bands for Impulse Re-sponses, Econometrica, vol. 67(5), pages 1113-1156.
´
Ultimos Ensaios Econˆomicos da EPGE
[551] Humberto Luiz Ataide Moreira e David Martimort.Common agency with infor-med principals. Ensaios Econˆomicos da EPGE 551, EPGE–FGV, Jun 2004.
[552] Luiz Renato Regis de Oliveira Lima e Zhijie Xiao. Purchasing power parity and the unit root tests: A robust analysis. Ensaios Econˆomicos da EPGE 552, EPGE–FGV, Jul 2004.
[553] Daniel Gottlieb, Aloisio Pessoa de Ara´ujo, e Humberto Luiz Ataide Moreira.
A model of mixed signals with applications to countersignaling an the GED. Ensaios Econˆomicos da EPGE 553, EPGE–FGV, Jul 2004.
[554] Lucas J´over Maestri e Carlos Eugˆenio Ellery Lustosa da Costa. The risk– properties of human capital and the design of government policies. Ensaios Econˆomicos da EPGE 554, EPGE–FGV, Jul 2004.
[555] Daniel Gottlieb e Lucas J´over Maestri. Banning information as a redistributive device. Ensaios Econˆomicos da EPGE 555, EPGE–FGV, Jul 2004.
[556] Leonardo Pio Perez e Pedro Cavalcanti Gomes Ferreira. Efeitos macroe-conˆomicos e custos sociais de uma transic¸˜ao entre regimes de previdˆencia no Brasil. Ensaios Econˆomicos da EPGE 556, EPGE–FGV, Jul 2004.
[557] Rubens Penha Cysne. Inflation and income inequality: A link through the job– search process. Ensaios Econˆomicos da EPGE 557, EPGE–FGV, Ago 2004.
[558] Rubens Penha Cysne. A search–theoretic explanation for the negative correla-tion between labor income and impatience. Ensaios Econˆomicos da EPGE 558, EPGE–FGV, Ago 2004.
[559] Rubens Penha Cysne.Income inequality:The role of impatience in a job–search process. Ensaios Econˆomicos da EPGE 559, EPGE–FGV, Ago 2004.
[560] Rubens Penha Cysne. Towards a measure of income inequality freed from the volatility caused by variations in the rate of unemployment. Ensaios Econˆomicos da EPGE 560, EPGE–FGV, Ago 2004.
[561] Rubens Penha Cysne.On the positive correlation between income inequality and unemployment. Ensaios Econˆomicos da EPGE 561, EPGE–FGV, Ago 2004.
[562] Rubens Penha Cysne. A general–equilibrium closed–form solution to the wel-fare costs of inflation (Forthcoming, Revista Brasileira de Economia). Ensaios Econˆomicos da EPGE 562, EPGE–FGV, Ago 2004.
[565] Marcelo Cˆortes Neri e Marcelo Casal Xerez. Desenho de um sistema de metas sociais. Ensaios Econˆomicos da EPGE 565, EPGE–FGV, Set 2004.
[566] Paulo Klinger Monteiro, Rubens Penha Cysne, e Wilfredo Maldonado.Inflation and Income Inequality: A Shopping–Time Aproach (Forthcoming, Journal of Development Economics). Ensaios Econˆomicos da EPGE 566, EPGE–FGV, Set 2004.
[567] Rubens Penha Cysne. Solving the Non–Convexity Problem in Some Shopping– Time and Human–Capital Models. Ensaios Econˆomicos da EPGE 567, EPGE– FGV, Set 2004.
[568] Paulo Klinger Monteiro.First–Price auction symmetric equlibria with a general distribution. Ensaios Econˆomicos da EPGE 568, EPGE–FGV, Set 2004.
[569] Samuel de Abreu Pessˆoa, Fernando A. Veloso, e Pedro Cavalcanti Ferreira. On The Tyranny of Numbers: East Asian Miracles in World Perspective. Ensaios Econˆomicos da EPGE 569, EPGE–FGV, Out 2004.
[570] Rubens Penha Cysne. On the Statistical Estimation of Diffusion Processes – A Partial Survey (Revised Version, Forthcoming Brazilian Review of Econome-trics). Ensaios Econˆomicos da EPGE 570, EPGE–FGV, Out 2004.
[571] Aloisio Pessoa de Ara´ujo, Humberto Luiz Ataide Moreira, e Luciano I. de Cas-tro Filho.Pure strategy equilibria of multidimensional and Non–monotonic auc-tions. Ensaios Econˆomicos da EPGE 571, EPGE–FGV, Nov 2004.
[572] Paulo C´esar Coimbra Lisbˆoa e Rubens Penha Cysne. Imposto Inflacion´ario e Transferˆencias Inflacion´arias no Mercosul e nos Estados Unidos. Ensaios Econˆomicos da EPGE 572, EPGE–FGV, Nov 2004.
[573] Renato Galv˜ao Flˆores Junior. Os desafios da integrac¸˜ao legal. Ensaios Econˆomicos da EPGE 573, EPGE–FGV, Dez 2004.
[574] Renato Galv˜ao Flˆores Junior e Gustavo M. de Athayde. Do Higher Moments Really Matter in Portfolio Choice?. Ensaios Econˆomicos da EPGE 574, EPGE– FGV, Dez 2004.
[575] Renato Galv˜ao Flˆores Junior e Germ´an Calfat. The EU–Mercosul free trade agreement: Quantifying mutual gains. Ensaios Econˆomicos da EPGE 575, EPGE–FGV, Dez 2004.