PIEPGE
fUNDAÇÃO GETULIO VARGAS
'4
FGV
EPGE
SEMINÁRIOS DE PESQUISA
ECONÔMICA DA EPGE
Is There a Price Puzzle in Brazil? An
Application of Bias-Corrected
Bootstrapping
RUBENS PENHA CVSNE
(EPGE/FGV)
-Data: 02/12/2004 (Quinta-feira)
Horário: 16h
Local:
Praia de Botafogo, 190 - 110 andar
Auditório nO 1
Coordenação:
1s There a Price Puzzle in Brazil? An
Application of Bias-Corrected Bootstrap*
Rubens Penha Cysne
tN ovember 29, 2004
Abstract
Using data from the United States, Japan, Germany , United King-dom and France, Sims (1992) found that positive innovations to short-term interest rates led to sharp, persistent increases in the price leveI. The result was confirmed by other authors and, as a consequence of its non-expectable nature, was given the name "price puzzle" by Eichen-baum (1992). In this paper I investigate the existence of a price puzzle in Brazil using the same type of estimation and benchmark identifica-tion scheme employed by Christiano et aI. (2000). In a methodological improvement over these studies, I qualify the results with the construc-tion of bias-corrected bootstrap confidence intervals. Even though the data does show the existence of a statistically significant price puzzle in Brazil, it lasts for .only one quarter and is quantitatively immateriaI.
1 Introd uction
The term "price puzzle" has been introduced in the Vector-Auto-Regression (VAR) literature by Eichenbaum's (1992) comment to a paper by Sims (1992).
*I thank the participants of workshops at the Department of Economics of the Uni-versity of Chicago for their comments. I am particularly thankful to Lutz Kilian, for making available some of the computer codes used in this work. The usual disclaimer applies. Key Words: Price Puzzle, Bootstrap, Bootstrap-After-Bootstrap,VAR, Vector-Auto-Regression, Bias-Corrected Bootstrap. JEL: J30, I30, D33.
In this paper, Sims used the VAR methodology and found out that positive innovations to short-term interest rates led to sharp, persistent increases in the price leveI in Japan, France, United States, Germany and United King-dom. The data were monthly and included, for each country, a short-term interest rate, a monetary aggregate, a consumer-price index, an industrial-production index, an index of the foreign exchange value of domestic currency and a commodity price indexo
The positive response of prices to the interest rate was found by Sims (1992) to be particularly strong and persistent in France and Japan. In the other countries the responses were weaker and would eventually (in a 48-month horizon) become negative. Running the VAR without the commodity price index and the exchange rate did not substantially modify the results.
Even though there are some mo deIs 1 capable of delivering periods of
infiation after a monetary contraction, the common view points out in the opposite direction, thereby the term "price puzzle".
Sim's explanation to the puzzle is primarily based on the bias in the estimation of the coeflicients, on account of possibly-missing variables. He argues that the monetary authority often has information regarding infia-tionary pressures not captured in the history of the variables included in the VAR. For instance, by knowing of a supply shock, and that infiationary pressure is about to arrive, the authorities can take the preemptive action of raising interest rates, thereby generating a positive (though spurious) corre-lation between prices and interest rates.
One theoretical consequence of this "missing-variable" explanation is that the same bias (of the estimated parameters of the model) should affect all other responses, not only the one related to the price indexo Under such circumstances, the fact that the response of the other variables to an increase of interest rates behaved accordingly to the common sense would lose part of its appeaI.
The "missing variable" also implies a subsequent search for one or more variables to be included in the VAR. This has been made, with relative success, by Sims and Zha (1999) and by Christiano et aI. (1997 and 2000). These works show that the inclusion of one single leading variable (usually some specific commodity price index) can do the job: the so called "price puzzle" often disappears.
A first purpose of this paper is to investigate if the same type of phenom-enon (prices reacting positively to an increase of the interest rate) happens with quarterly Brazilian data ranging from 1980/1 to 2004/2. Some previous
assessments of this paper using Brazilian data are duly referred to in section
3.l.
A second purpose is to illustrate the use of bias-corrected bootstrap in the construction of confidence intervals for impulse-response functions.
Regarding the technicalities concerning the estimation of the VAR (the type of orthogonalization, the assumption of fixed coefficients over the whole sample range2 , which variables to include, the type of estimation (if in leveIs of first differences)) I will strictly follow Christiano et aI. (2000) and will not consider alternative estimations procedures. Therefore, my answer to the problem is conditional on using Christiano et aI. 's (2000) specifications. The only degree of freedom I will explicitly consider regards the number of lags to include in the VAR.
The reason for following Christiano et aI.'s (2000) specifications is that these authors were able to generate the puzzle, as well as to solve it (byadding an extra variable), with different sets of data. Using their specifications, therefore, allows for the establishment of a well known benchmark for the purpose of comparisons.
One important improvement of the analysis I develop here, relatively to the ones by Sims (1992), by Eichenbaum (1992), and by Christiano et aI. (2000), is the inclusion of confidence bands generated by the method of bias-corrected bootstrap. Sims (1992) does not provide confidence intervaIs. Eichenbaum uses the parametric Monte Carlo integration procedure of Doan (1990), whereas Christiano et aI. (2000) empIoy the standard bootstrap technique. It happens, though, that these procedures do not perform well in small sampIes, due to the bias of the estimators of the A.R. processes. Here I use the bias-corrected methodology proposed by Kilian (1998).
2 The Bias-Corrected Confidence Bands
As shown by Tjostheim and Paulsen (1983), Nicholls and Pope (1988) and Pope (1990), among others, the appIication of the standard bootstrap pro-cedures to auto-regressive mo deIs generates replicates which are necessarily biased, on account of the small-sample bias of the estimators of the parame-ters. In order to deal with this probIem, specifically regarding the confidence intervaIs for impuIse-response functions constructed from VAR estimates, Kilian (1998) proposed correcting the bias prior to bootstrapping the esti-mate.
This correction is important. When based on the standard techniques, the bias and skewness of the impulse-response estimators in small samples can lead to very inaccurate intervals. Exemplifying with a previous paper by Bernanke and Gertler (1995), Kilian (1998) has shown that some key stylized facts of the VAR literature can fai! to be supported by the data, when bias-corrected bootstrap bands are used3 ,4.
In general, the bias correction can be accomplished by a nested-bootstrap procedure, in which the inner bootstrap is used to correct for the bias of the coefficients, and the outer bootstrap to generate the confidence bands of the impulse-response functions. Kilian (1998) called this procedure bootstrap-after -bootstrap.
Kilian also points out that the employment of a closed-form solution to the bias proposed by Pope (1990) can simplify the procedure, by making the inner bootstrap unnecessary. Pope's solution is avai!able for the case of demeaned VARs run in leveIs, with a nonzero intercept, and without trend. The main result reads:
Theorem 1 (Pape (1990)): Let Ân be the least-squares estimator of A in the m-dimensional AR(1): Xt = AXt - 1
+
Zt, in which Xt and Zt are mx1and A is mxm, based on a sample of size n. Make:
where Ut = Xt -
X
n ,X
n the sample mean. Suppose that, for some ê>
O, E 11Cn(O)-l
IIHe
セi@.
11 states for the operator norm) is bounded as n ---+ 00and that the innovations Zt are a martingale difference sequence such that all moments of Zt up to and including the sixth, conditional on the past, are finite ând have values independent of t. Let G denote the" conditional covariance of Zt, and suppose that 11 A 11< 1. Then, as n ---+ 00, the bias
Bn
=
EÂn - A is of the form:b
Bn = - -
+
O(n-3/2) (1)n
3In the Monte Carlo studies carried out by Kilian (1998, p.222), the relative frequency at which the 95% confidence interval covers the true impulse response (in a model like the one used here) can be as low as 50% when standard bootstrap methods are employed. The bias-corrected bootstrap, on the other hand, presents a frequency around 90-95%. In general, the amount by which the bias-corrected bootstrap outperforms his competitors depends on the persistence of the process, on the sample size and on the inclusion or not of a time trend.
where b is given by:
The sum is over eigenvalues of A, weighted by their multiplicities, and r(j) =
exエxセェN@
Proof. See Pope (1990) . •
Since the type of VAR specification assumed by Pope (1990) is the same I shall use here, I perform the bias correction through the employment of (1) and (2). The key point to note is that the bias for the bootstrap is re-estimated, and new coefficients are generated, in each re-sample of the bootstrap.
3 Empirical Results
3.1 Previous Evidences Using Brazilian Data
In an analysis the main purpose of which was comparing the effectiveness of monetary policy in three different periods of the Brazilian economy ((1975-1985), (1985-1994) and (1994-2000)), Minella (2001, section 3.3, 2003) pro-vides estimates that can add to our interests here. His estimates were based on monthly data and did not include the data on bank reserves. His impulse-response bands were constructed using Doan's (1990) Monte Carlo procedure (standard in the software RATS). Most of the time, Minella works with in-fiation, rather than with the price leveI. For our purposes here, only the regressions ran in leveIs are of direct interest. In such cases, which only cover the third subsample (Figures 5 and 7 in the original) no "price puzzles" are found5 . The same conclusion is obtained by Fiorencio and Moreira (1999, Tables 3A and 3B, in this case using constant parameters) concerning both periods before and after the Real Plano
3.2 New Measurements
Let y, p, r, res and m denote, respectively, the log ofreal GDP, the logarithm of the price index, the short term interest rate, the logarithm of total (bank) reserves and the logarithm of MI . The primitive data on p, m and r are from
IBRE-FGV's6 data bank. The quarterly GDP index and bank reserves are from IPEA7.
Since the purpose here is the assessment of the existence of a price puzzle, in all econometric evaluations the policy instrument is the short-term interest rate. As mentioned before, the benchmark specification is the same as in Christiano et aI. (2000). Particularly regarding the ordering of the variables in the VAR, I useB: y, p, r, res, m.
Under this ordering of the variables, the information set assumed to be available to the government at time
t,
when choosing the interest rate to target, includes the current and lagged values of y and p, as well as laggedvalues of r, res and m. As a consequence of the ordering of the variables in the VAR and of the Cholesky-orthogonalization assumption, neither the price leveI at time
t
nor the GDP at timet
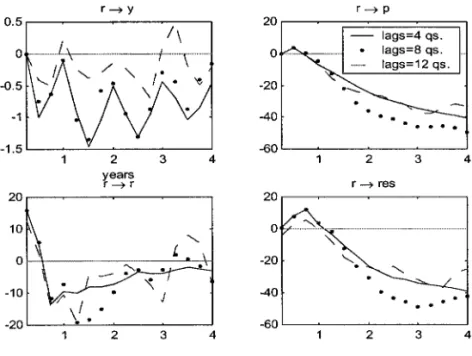
are supposed to change as a consequence of a contemporaneous interest-rate shock. This can be noticed in Figure 1, in Figure 2, and in Table 1 of this work.3.3 The Overall Dynamics of the Model
I start by running the VARs with four, eight and twelve lags. Each equation in the system includes the lags ofthe variables and an intercepto In particular, this time frame is supposed to capture possible seasonalities of the data. The sample period has beeu mentioned before. Figure 1 plots the most importam response, for our concerns, of a one-standard-deviation shock to the interest rate. In Figures 1 and 2 (but not in Table 1), the response of the variables in logarithm have been multiplied by 100. The total horizon is equal to 16 quarters9
.
As one can notice from Figure 1, the response of prices and reserves to a one-standard-deviation shock of interest rates look very much alike, either for 4, 8 or 12 lags. Regarding GDP, the inclusion of 12 lags leads to a
6Instituto Brasileiro de Economia da Fundação Getulio Vargas. 'Instituto de Pesquisa Econômica Aplicada.
8Christiano et a!. (2000) also includes the logarithm of the non-borrowed reserves (NBR) between res and m. I do not include this variable here.
9The maximum estimated absolute value of the eigenvalues of the A.R. matrix for 4, 8
LMMMMMMMMMMMMMMMMMMMMMMMMMMMMMMMMMセセMMMMMM
イセケ@ イセ@ p
0.5 20
1\ - lags=4 qs.
- · .. ·_·_·f .. ᄋM|セ@ O
.
lags=8 qs."/,,
.
lags=12 qs.-0.5 \ I • セ@ -20 '--':
-1 -40
.
. . . .
-1.5 -60
2 3 4 2 3 4
years
イセ@ r イセ@ res
20 20
O セ@ ... セセセセ@
"
-20
"
.
-40
. . . .
-20 -60
2 3 4 2 3 4
Figure 1: Responses of y, p, r and res to a shock in r.
recovery of real GDP before the end of the first year, the same pattern not being observable in the case of 4 and 8 lags. As one would expect, the effect of raising interest rates on GDP is negative in all cases. The response of total reserves to the interest rate is positive till the end of the first year, and negative afterwards.
Particularly regarding the effect on prices, our main concern here, all alternatives lead to a very dose pattern. By the eye, the first impression from the upper-right figure above is that there is indeed a very small price puzzle in Brazil, for a period o{around three monthslO, but of a very small
magnitude. The proper statistical answer to this question, though, requires the construction of adequate confidence bands for the response functions.
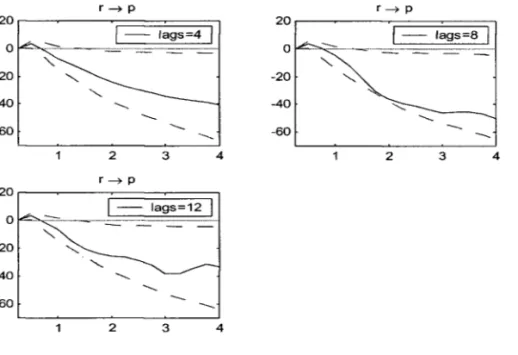
3.4 Is There a Price Puzzle in Brazil?
In this subsection I concentrate on the main point in this paper: checking if the response of prices to interest rates happens to be positive for some time. With this purpose, Figure 2 displays the estimated impulse-response func-tions, as well as the 90% nominal coverage bias-corrected bootstrap bands
for a number of lags equal to 4, 8 and 12, and a horizon of 48 months. The dotted lines depict, in the obvious way, the lower and upper confidence in-tervals. The confidence intervals correspond to the 5th and 95th percentiles
of 1000 bias-corrected bootstrap replications of the LR. function. The solid
line depicts the response of prices (p).
イセ@ p
RPイMセMMMMセ]]セ]]セ@
1-
la95=8I
o
-20
-40
-60 -60
2 3 4 2 3 4
イセ@ p
-60
2 3 4
Figure 2: Confidence Bands for the Response of Prices to Interest Rates
lags=4 =
t=l
t=2
t=3
lb
o
0.05458
0.04012
0.02043
ub
O O0.03628
0.00611
-0.01123
-0.06182
-0.06803
-0.14381
1
ags=8 =
t=l
t=2
t=3
lb
O0.05420
0.03966
0.01811
ub
O O0.03870
0.00660
-0.06587
0.00250
-0.04535
-0.14241
1
ags=12
=t=l
t=2
t=3
lb
O0.05542
0.03973
0.01764
ub
O O0.03578
0.00585
-0.00995
-0.06667
-0.06481
-0.14082
As the data shows, there does exist a positive response of prices to an increase interest rates. However, it is statistically significant for just one quarter, and has the magnitude no greater than 3.9% in a quarter. In the case with 8 lags, for instance, this corresponds to around 31% (0.03870/0.1240) of one (conditional) standard deviation of (the logarithm of) pricesll .
4
Conclusion
In this paper I have investigated the possibility of the existence of a price puzzle in Brazil, as it happened with United States, Japan, Germany , Britain and France, according tô the VARs estimated by Sims (1992), Eichenbaum (1992) and Christiano et aI. (2000), among others. I have addressed the problem using the same estimation procedures employed by Christiano et al (2000). As a methodological improvement over these studies, I have provided bootstrap confidence bands based on bias-corrected estimated coefficients.
The conclusion of the work is that, even though the data does show that prices increase when interest rates increase, the effect is quantitatively and temporally insignificant. It lasts for only one quarter and has a magnitude no greater than 3.9%, or around 31 % of the standard deviation of (the logarithm of) prices.
I
セ@
,
.
References
[1] Beaudry, Paul and Michael B. Devereux, 1995, Money and the Real Exchange Rate with Sticky Prices and Increasing Returns. Carnegie Rochester Conference Series on Public Policy, VoI. 43, pages 55 -
101.\
[2] Bernanke, Ben S., and Mark Gertler, 1995, Inside the Black Box: The Credit Channel of Monetary Policy Transmission, Journal of Economic Perspectives 9, 27-48
[3] Christiano, Lawrence J., Martin Eichenbaum and Charles L. Evans, 1997, Sticky Price and Limited Participation Models: A Comparison. European Economic Review, VoI. 41, No. 6, pages 1201-1249.
[4] Christiano, Lawrence, Martin Eichenbaum and Charles Evans, 2000, "Monetary policy shocks: what have we learned and to what end?" In Michael Woodford and John Taylor, eds, Handbook of Macroeconomics North Holland.
[5] Doan, Thomas A., 1990, RATS User's Manual, Version 3.10 (Evanston, IL: VAR Econometrics).
[6] Eichenbaum, Martin, 1992, Comments on Interpreting the macro eco-nomic time series facts: The effects of monetary policy, by Christopher Sims. European Economic Review 36, 1001-1012. North-Holland.
[7] Fiorencio, Antonio, and Ajax R. B. Moreira (1999), "Latent Indexation and Exchange Rate Passthrough", Rio de Janeiro, IPEA, Texto para -Discussão no. 650, Jun.
[8] Fuerst, Timothy, 1992, Liquidity, Loanable Funds, and Real Activity. Journal of Monetary Economics, VoI. 29, No. 1, February, 3 - 24.
[9] Kilian, L., 1998, Small-Sample Confidence Intervals for Impulse-Response Functions. The Review of Economics and Statistics, 80, 218-230.
[10]
Minella, A., (2001), Monetary Policy and Infiation in Brazil (1975-2000):a VAR Estimation, Working Paper Series 33, Central Bank of BraziI.
[12] Nicholls, D. F., and A. L. Pope, 1998, Bias in the Estimation of Multi-variate Autoregressions, Australian Journal of Statistics 30A, 296-309.
[13] Pope, Alun L., 1990, Biases of Estimators in Multivariate Non-Gaussian Autoregressions. Journal of Time Series Analysis 11, 249-258.
[14] Sims, Christopher A., 1992, Interpreting the macroeconomic time series facts: The effects of monetary policy, European Economic Review 36, 975-1001 North-Holland.
[15] Sims, Christopher A. and Tao Zha, 1999, Error Bands for Impulse Re-sponses, Econometrica, voI. 67(5), pages 1113-1156.
[16] Tj0stheim, Dag, and Jostein Paulsen, 1983, Bias of Some Commonly-Used Time Series Estimates. Biometrika 70, 389-399
ャIアセNNエ@
セセ||セセ@
FUNDAÇÃOGETUUO
VARGAS
BIBLIOTECA MÁRIO
HENRlQUE S:;,;ONSEN
-
AS-
Ssy_セ@r
I
QセO[ャjHZエpッケ@11 000355815