DOI: 10.5562/cca2766
Application of the Mössbauer Spectroscopy to Study
Harmonically Modulated Electronic Structures: Case Study
of Charge- and Spin-Density Waves in Cr and Its Alloys
Stanislaw Mieczyslaw Dubiel
AGH University of Science and Technology, Faculty of Physics and Applied Computer Science, PL-30-059 Kraków, Poland Author’s e-mail address: [email protected]
RECEIVED: October 5, 2015 REVISED: January 14, 2016 ACCEPTED: January 15, 2016
THIS PAPER IS DEDICATED TO DR.SVETOZAR MUSIĆ ON THE OCCASION OF HIS 70TH BIRTHDAY
Abstract: Relevance of the Mössbauer spectroscopy in the study of harmonically modulated electronic structures i.e. spin-density waves (SDWs) and charge-density waves (CDWs) is presented and discussed. First, the effect of various parameters pertinent to the SDWs and CDWs is outlined on simulated 119Sn spectra and distributions of the hyperfine field and the isomer shift. Next, various examples of the 119Sn spectra
measured on single-crystals and polycrystalline samples of Cr and Cr-V are reviewed.
Keywords: Mössbauer spectroscopy, chromium, Cr-V alloys, spin-density waves, charge-density waves.
INTRODUCTION
HERE are crystalline systems in which the electronic structure is harmonically modulated. The modulation of charge is known as charge-density waves (CDWs), and the one of spin as spin-density waves (SDWs). If both quan-tities are modulated one speaks about a co-existence of the CDWs and SDWs. The CDWs were found to exist in quasi-1D linear chain compounds like TaS3and NbSe3, 2Dlayered transition-metal dichalcogenides such as TaS2, VS2, or NbSe2, 3D metals like -Zrand Cr or compounds like Mn3Si and UCu2Si2.[1] The best known system with SDWs is metallic Cr. Its SDWs which originate from s- and d-like electrons and show a variety of interesting properties were studied with different experimental techniques.[2] The most fundamental is their relationship to a density of electrons at the Fermi surface (FS). Between the Néel temperature of 313 K and the so-called spin-flip temperature, TSF 123 K, the SDWs in chromium are transversely polarized i.e. the wave vector, q , is perpendicular to the polarization vector, p. Below TSF they are longitudinally polarized. One of the basic parameters pertinent to the harmonically modulated structures is periodicity, . The modulation is
commensurate with the lattice if n · a, where a is the lattice constant and n is an integer, the modulation is incommensurate if n · a. The commensurability or incommensurability can be also expressed in terms of the wave vector which for the commensurate structures fulfils the equation q = 2 / a. For the incommensurate structures, like the one in chromium, q 2 / a. The latter feature can be measured by a parameter, such that q 2(1–)/a. The periodicity can be alternatively expressed as *a / (1–). In the latter case * = a for the commensurate structures and * > a for incom-mensurate ones. This definition of the periodicity is quite unfortunate, especially for the commensurate structures, as it leads to terming “commensurate” the usual antiferromagnetic structure which has nothing to do with the harmonic modulation. The periodicity of incom-mensurate structures can be also measured using the following definition: a a / . In the case of chromium SDWs are incommensurate and their periodicity a varies continuously between 20 a at 4 K and 28 a at RT.[1] In other words, there is no unique definition of the periodicity of harmonically modulated electronic struc-tures throughout the literature.
Croat. Chem. Acta 2016, 88(4), 523–530 DOI: 10.5562/cca2766 Concerning the application of the Mössbauer
spectroscopy (MS) to study the harmonically modulated electronic structures its relevance was recognized already in 1961 by Wertheim who made the first attempt to study the SDWs in Cr using the effect on 57Fe nuclei which were introduced as probe atoms.[3] However, the trial was unsuccessful as the measured low temperature spectrum did not show any magnetic splitting. Instead, it had the form of a slightly broadened single line. The first successful application of MS was that by Street and Window who used the effect on 119Sn nuclei introduced into Cr matrix as probe atoms.[4–6] The main difference in the two experiments lies in the fact that 57Fe atoms are magnetic whereas 119Sn ones are not. Theoretical calculations predict that magnetic impurities strongly interact with the SDWs causing their pinning i.e. the amplitude of the SDWs measured on the magnetic probe atom is zero or very small. This obviously was the reason for the failure of the Wertheim’s experiment. On the other hand, non-magnetic atoms do not interact with the SDWs i.e. they do not disturb them; consequently they can be used as suitable probe atoms. The experiments carried out by Street and Window gave evidence for that.[4–6] Since then several experimental and theoretical papers relevant to the issue were published.[7–25] Concerning the former, the following ones are worth mentioning: (1) observation of the spin-flip transition in Cr,[7] (2) determination of the third-order harmonics of the SDWs in Cr,[8] (3) determination of the effect of grain boundaries on the SDWs in Cr,[14] (4) determination of the effect of vanadium on the SDWs in Cr,[18] (5) study of the critical behavior of Cr around the Néel temperature,[20] (6) observation of a huge spin-density enhancement in the pre surface zone of a single-crystal Cr.[21–23,25] In theoretical papers pertinent to the SDWs and CDWs studies depicted the effect of (a) spin-density parameters such as periodicity, amplitude and sign of higher-order harmonics on (a) the 119Sn spectra and hyperfine field distributions (for SDWs)[9,15,16], (b) the 119Sn spectra and charge-density distributions (for CDWs),[15] and (c) the 119Sn spectra and electric field gradient harmonic modulation.[19]
SELECTED RESULTS AND THEIR
DISCUSSION
CDWs
Coulomb interaction between two hole surfaces of the FS is the source of the CDWs. The CDW’s order parameter is proportional to the square of the SDW’s order parameter,[26] so the CDWs can be expressed in terms of a series of even harmonics:
0 2
1
CDW N isin(2 )
i
I I iα φ
(1)where I2i is the amplitude of the 2i-th harmonics, = q r (q is the wave and r is the position vector) and a phase shift. The calculated value of I2 relative to the average charge density,[27,28]Io, ranges between 10–3 and 10–2 which agrees well both with the X-ray diffraction[29] and 119Sn Mössbauer[30] measurements.
SIMULATED 119Sn MÖSSBAUER SPECTRA A Mössbauer spectrum can be simulated taking into account one periodicity, . At first a number of higher-order harmonics and their amplitudes are selected and the resulting CDW is constructed. Next, is divided into N equal intervals as shown in Figure 1a. A single-line sub spectrum having the Lorentzian shape, having 1 mm s–1 full width at half maximum and the isomer shift, S, proportional to the amplitude of the CDW in the corresponding interval is next constructed. The sum of all N-sub spectra gives the final spectrum corresponding to the chosen CDW. As seen in Figure 1c, its shape significantly differs from the Lorentzian shape and it rather resembles a broadened doublet. The distribution of the isomer shift can be derived either from the CDW itself or from the spectrum as indicated in Figure 1d. Details of the procedure are given elsewhere.[15]
COMMENSURATE CDWs, a n · a
The shape of the spectra is sensitive both to the periodicity, n, as well as to the phase shift, .[15,24] However, the
DOI: 10.5562/cca2766 Croat. Chem. Acta 2016, 88(4), 523–530 difference between the spectra is large for small values of
n (< 10) while for n > 10 it becomes smaller and eventually does not depend either on n or .
INCOMMENSURATE CDWs, n · a
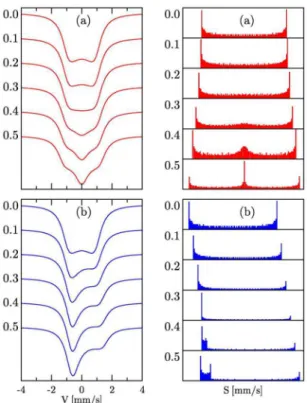
In this case the spectra are sensitive to the amplitudes and signs of harmonics as well as to the phase shift. To illustrate these effects a set of spectra and underlying distributions of the isomer shift are shown in Figure 2. It is evident that both the amplitude as well as phase shift can significantly affect the shape of the spectra.
SDWs
The Coulomb interaction between the electron and the hole surfaces of FS gives rise to the SDWs.[31] They can be expressed in terms of a series of odd harmonics:
2 1 1
SDW N i sin (2 1)
i
H i α φ
(2)In the following it will be presented the effect of the periodicity (for the commensurate SDWs), amplitudes and signs of harmonics on the shape of the 119Sn Mössbauer spectra and underlying histograms of the spin-density distributions.
SIMULATED SPECTRA AND SPIN-DENSITY DISTRIBUTIONS
Protocol of Construction
The hyperfine field has the inversion symmetry hence for a construction of a spectrum characteristic of the SDW it is enough to consider the half periodicity. It is divided into N equally spaced intervals, and for each of them a sub spectrum is constructed with the splitting proportional to the amplitude of the SDW in a given interval. The shape of the lines is Lorentzian, the line width at half maximum equal to 1 mm s–1 and the relative intensities of the lines within the sextet equal to 3:2:1. Examples of the sub spectra and the overall one obtained by summation of the all N sub spectra are shown in Figure 3b. A histogram of the hyperfine field distribution is presented as well - Figure 3d. It can be derived numerically either from the spectrum itself or from the shape of the SDW. The histogram is known as the Overhauser profile and its analytical formula is as follows:[9]
2 2
2 1
( )
o
p H
π H H
(3)
The most characteristic features of the p(H), the probability of finding a H value in the range [H, H + dH], is: (a) a cut-off at the most probable field, Ho, and a tail for H < Ho. Details of the procedure are reported elsewhere.[13]
COMMENSURATE SDWs, n · a
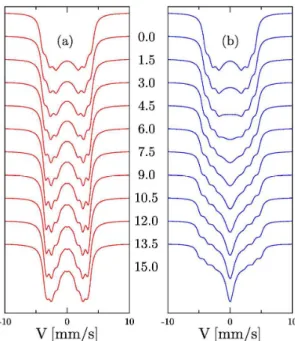
In this case the effect of the periodicity, n, and that of the phase shift, , can be investigated. Two cases are illustrated in Figure 4 viz. (a) = 0o (blue) and (b) = 90o (red). It is clear that the actual shape of the spectrum depends on n.
Figure 2. Simulated 119Sn spectra and corresponding
histograms of the isomer shift distribution for (a) CDW = 0.5sin + I4sin2, and (b) CDW = 0.5sin2 + I4cos4. The
figures labeling the spectra and the histograms stand for the value of I4.[15]
Croat. Chem. Acta 2016, 88(4), 523–530 DOI: 10.5562/cca2766 The dependence is especially strong for low values of n.
Two further features are evident viz. (a) for = 2na the shape of the spectra is the same for the two cases, and (b) for higher n-values the difference between the two types of the spectra becomes smaller and the spectrum’s shape approaches the one characteristic of the incommensurate SDWs (compare the spectrum for n=30 with the one shown in Figure 5 for H1 = 60 kOe).
INCOMMENSURATE SDWs
Fundamental Harmonic, H1
The purely sinusoidal SDW can be described as follows:
1sin
H H α (4)
In this case the effect of the amplitude, H1, can be figured out. A set of the spectra obtained for H1 ranging between 20 and 100 kOe is shown in Figure 5. Noteworthy, the spectrum labelled with 60 is similar to the real spectrum measured at 295 K on a single-crystal sample of chromium[8] while the one labelled with 100 resembles the spectrum measured at 4.2 K on the same sample.[20]
Third-Order Harmonic, H3
This harmonic is of particular interest because it is the sec-ond most important, and, it was revealed in chromium, the system in which the existence of the SDWs has been well evidenced with neutrons and Mössbauer spectroscopy.[8,31]
To illustrate the effect of H3 and its sign 119Sn spectra were simulated for the following two SDWs:
1 3
1 3
sin sin3
sin sin3
H H α H α
H H α H α
(5)
The value of H1 was kept constant at 60 kOe while H3 was changed between 0 and 15 kOe. The output of the
Figure 4. Simulated 119Sn spectra for the commensurate SDW
with the periodicity ranging between n = 2 and n = 30 (in units of the lattice constant, a). Two cases are shown: (a) H = 60sin (blue) and (b) H = 60cos (red).
Figure 5. 119Sn spectra simulated for the incommensurate
SDW H = H1sin with different values of H1 in kOe.
Figure 6. 119Sn spectra simulated for different values of the
third-order harmonics, H3, ranging between 0 and 15 kOe.
The spectra shown in (a) are for H3 > 0, and those seenin (b)
DOI: 10.5562/cca2766 Croat. Chem. Acta 2016, 88(4), 523–530 simulations is displayed in Figure 6 (spectra), and in Figure 7 (histograms).
Both the spectra and the corresponding histograms of the hyperfine field distributions show high sensitivity to the amplitude and the sign of H3. These features make the 119Sn Mössbauer spectroscopy a suitable tool for studying issues relevant to the SDWs which are known to be very sensitive to various kinds of lattice imperfections like foreign atoms, defects, grain boundaries, strain, etc. Consequently, in a studied sample in which any of these imperfections are present, the virgin SDWs are changed (deformed). For example magnetic impurities pin the SDWs, vanadium quenches while manganese supports the SDWs. In other words, the measurements performed on such samples do not give the proper information on the virgin SDWs.
SDWs and CDWs in Chromium
In metallic chromium SDWs and CDWs co-exist and the wave vector of the latter is twice the wave vector of the SDWs.[32] However, there is no unique explanation of the origin of the CDWs. As discussed in Ref.31 there are three different possible interpretations of the results pertinent to the issue. Whatever the origin of the concomitant SDWs and CDWs in chromium, 119Sn Mössbauer spectroscopy is a very suitable tool to study the two phenomena as it, via the
Figure 8. 119Sn Mössbauer spectra measured on a single-crystal sample of Cr doped by diffusion with 0.1 at % 119Sn at room
temperature and at 4.2 K (upper panel), and derived therefrom shapes of the SDW (half periodicity) and CDW (full periodicity) (bottom panel).[24]
Figure 7. Histograms of the hyperfine field distribution corresponding to the 119Sn spectra shown in Figure 6. The
labels stand for the value of the H3 amplitude in kOe. The
histograms shown in (a) are for H3 > 0, and those seen in (b)
Croat. Chem. Acta 2016, 88(4), 523–530 DOI: 10.5562/cca2766 hyperfine field and the isomer shift, gives a simultaneous
information on the SDWs and CDWs, respectively.
SINGLE CRYSTAL Cr-DETERMINATION OF H3 AND I2 119Sn Mössbauer spectra recorded at room temperature (RT) and at 4.2 K on a single-crystal sample of Cr doped with 0.1 at % 119Sn are shown in the upper panel of Figure 8. The shapes of the underlying SDW and CDW are shown in the bottom panel of the same figure. Concerning the SDW, one can easily notice that the amplitude increased from 57 kOe at RT[8] to 94 kOe at 4.2 K.[18] Furthermore, the analysis of the spectra in terms of the higher-order harmonics yielded the sign (positive) and the amplitude of H3. The relative value of the latter is 2.6 % at 4.2 K and 1.4 % at 295 K. These values are in line with 1.65 % determined at 200 K by the neutron diffraction experiment.[31]
The analysis of the spectra in terms of concomitant SDWs and CDWs also permitted determination of the
CDW shapes and their amplitudes. Concerning the former, the shape and the periodicity is different at the two temperatures. The origin of that is unknown and the effect needs further study. On the other hand, the amplitude hardly depends on temperature and it amounts to 5∙10–2 mm s–1.
EFFECT OF GRAIN SIZE
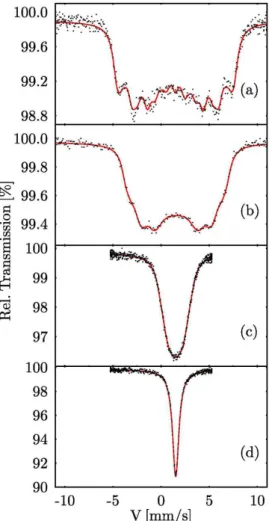
SDWs are expected to strongly interact with various kinds of lattice imperfections including grain boundaries. To verify this expectation 119Sn spectra were recorded at RT on three polycrystalline samples of Cr with different grain sizes.[14] The shape of the spectra shown in Figure 9 evidently depends on the size of grains what can be understood in terms of interaction between the SDWs and the grain boundaries. The spectra could be successfully analyzed in terms of [Eq. (2)] as described in detail elsewhere.[14] In addition to H3, H5 and H7 harmonics had to be included to obtain statistically good fits.
Figure 9. 119Sn spectra recorded at RT on (a) single-crystal
Cr, and (b)–(d) polycrystalline Cr with different size of grains decreasing from (b) to (d).[14]
Figure 10. 119Sn spectra recorded at 4.2 K on single-crystals
of (a) Cr, and (b)–(d) Cr100–xVx with (b) x = 0.5; (c) x = 2.5; and
DOI: 10.5562/cca2766 Croat. Chem. Acta 2016, 88(4), 523–530 EFFECT OF VANADIUM
Substituting Cr by V drastically quenches the SDWs. Addition of 4 at % V is enough to extinguish them completely. This quenching effect is regarded as the proof for regarding the SDWs in Cr as related to the density of electrons at the FS. 119Sn Mössbauer spectroscopy has also proved to be the pertinent method to study the issue.[18] Examples of the spectra recorded at 4.2K on single-crystals of Cr and Cr100–xVx (x = 0.5, 2.5, 5) doped by diffusion with a small amount of 119Sn are shown in Figure 10. Spectral parameters related to the SDWs viz. the average hyperfine field and the maximum hyperfine field decrease with x at the same rate as the Néel temperature, the average magnetic moment and the incommensurability wave vector.
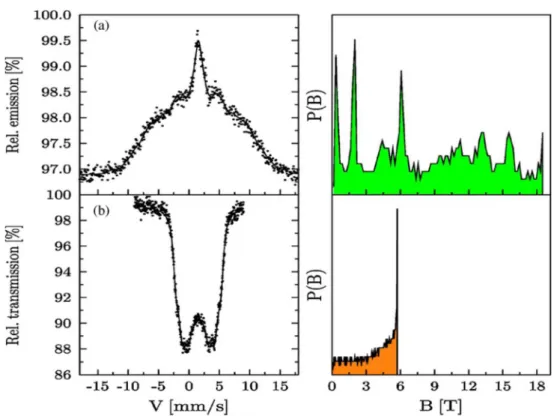
EFFECT OF SURFACE AND/OR IMPLANTATION Physical properties of surface are, in general, different than the bulk properties. Concerning magnetic properties of the surface of Cr, theoretical calculations predict that the mag-netic moment of Cr atoms lying within few layers adjacent to the surface is enhanced by factor of 3.5–5.[33–36] To verify these predictions 119Sn conversion electron spectra (CEMS) were recorded at room on a single-crystal (110) Cr foil implanted with 119Sn ions. The range of the implantation was 16 nm what corresponds to 2a.[21–23,25] The meas-ured spectrum alongside with the corresponding histogram
of the hyperfine field distribution is displayed in Figure 11. The spectrum measured in a transmission mode on a similar sample but doped with the 119Sn atoms by diffusion and the related histogram are added for the sake of comparison. The enhancement of the hyperfine field (spin-density) ranges between 2.4 and 3, so it is comparable with the theoretical predictions. The depth of the implantation corresponds, however, to about 110 monolayers i.e. is by factor 30–50 time higher than the theoretically predicted thickness. On the other hand, 110 monolayers correspond merely to 2a, and for the SDWs it is rather the periodicity not the lattice monolayer that should be regarded as the relevant figure of merit.
CONCLUSIONS
The paper can be summarized with a general conclusion that the Mössbauer spectroscopy can be used as the relevant technique for investigation of virgin properties of the harmonically modulated electronic structures i.e. SDWs and CDWs. In particular it permits:
1. Distinction between the commensurate and incommensurate SDWs provided the periodicity of the former is 13 lattice constants. 2. Determination of the amplitude and sign of
higher order harmonics.
3. Study the effect of grain size and foreign atoms.
Croat. Chem. Acta 2016, 88(4), 523–530 DOI: 10.5562/cca2766 However,
(i) Measurements must be carried out using non-magnetic probe atoms e.g. 119Sn what signifi-cantly reduces the applicability of the method. (ii) Investigated samples must be as perfect as
possi-ble i.e. single-crystals, free of impurities and other imperfections.
REFERENCES
[1] T. Butz (editor)in Nuclear Spectroscopy on Charge
Density Waves Systems, Kluwer Academic Publ.,
1992, pp. 7–311.
[2] E. Fawcett, Rev. Mod. Phys. 1988, 60, 209. [3] G. K. Wertheim, J. Appl. Phys. 1961, 32, 110S. [4] R. Street, B. Window, Proc. Phys. Soc. London 1966,
89, 587.
[5] R. Street, B. C. Munday, B. Window, J. R. Williams, Appl. Phys. 1968, 39, 1050.
[6] B. Window, J. Phys. C 1970, 2, S210. [7] S. M. Dubiel, Phys. Rev. B 1984, 29, 2816.
[8] S. M. Dubiel, G. Le Caër, Europhys. Let. 1987, 4, 487. [9] G. Le Caer, S. M. Dubiel, J. Magn. Magn. Mater.
1990, 92, 251.
[10] S. M. Dubiel, J. Magn. Magn. Mater. 1992, 104–105, 1999.
[11] S. M. Dubiel, J. Magn. Magn. Mater. 1992, 124, 31. [12] S. M. Dubiel, Acta Phys. Pol. A 1993, 84, 83. [13] J. Cieslak, S. M. Dubiel, Nuclear Instr. & Methods B
1995, 95, 131.
[14] S. M. Dubiel, J. Cieslak, Phys. Rev. B 1995, 51, 9341. [15] J. Cieslak, S. M. Dubiel, Nuclear Instr. & Methods B
1995, 101, 295.
[16] J. Cieslak, S. M. Dubiel, Acta Phys. Pol. A 1995, 88, 1143. [17] S. M. Dubiel, J. Cieslak, J. Magn. Magn. Mater. 1995,
148, L384.
[18] S. M. Dubiel, J. Cieslak, F. E. Wagner, Phys. Rev. B 1996, 53, 268.
[19] J. Cieslak, S. M. Dubiel, Acta Phys. Pol. A1997, 91, 1131.
[20] S. M. Dubiel, J. Cieslak, Europhys. Lett. 2001, 53, 383. [21] S. M. Dubiel, J. Cieslak, J. Zukrowski, H. Reuter, Phys.
Rev. B 2001, 63, 060406(R).
[22] S. M. Dubiel, J. Cieślak, Phys. Stat. Sol. (a) 2002, 191, 577.
[23] J. Cieślak, S. M. Dubiel, Phys. Stat. Sol. (a) 2003, 196, 181.
[24] S. M. Dubiel in Recent Research Developments in Physics, Vol. 4, (Ed. S. G. Pandalai), Tansworld Research Network, 2003, pp. 835–859.
[25] J. Cieślak, S. M. Dubiel, F. Eichhorn, M. Menzel, H. Reuther, J. Alloys Comp. 2007, 442, 235.
[26] R. S. Fishman, S. H. Lie, Phys. Rev. B 1992, 45, 12306. [27] C. Y. Young, J. B. Sokoloff, J. Phys. F: Metal Phys.
1974, 4, 1304.
[28] Y. Tsunoda, M. Mori, N. Kunitomi, Y. Teraoka, J. Kanamori, Solid State Commun. 1974, 14, 287. [29] M. Mori, Y. Tsunoda, J. Phys. Condens. Matter 1993,
5, L77.
[30] S. M. Dubiel, J. Cieslak, Solid State Commun. 1995, 96, 1003.
[31] R. Pynn, W. Press, S. M. Shapiro, S. A. Werner, Phys. Rev. B 1976, 63, 174301.
[32] X. W. Jiang, R. S. Fishman, J. Phys.: Condens. Matter 1997, 9, 3417.
[33] G. Allan, Phys. Rev. B 1979, 19, 4774.
[34] R. H. Victora, M. L. Falicov, Phys. Rev. B1985, 31, 7335.