Prion Protein (PrP) Knock-Out Mice Show Altered Iron
Metabolism: A Functional Role for PrP in Iron Uptake and
Transport
Ajay Singh, Qingzhong Kong, Xiu Luo, Robert B. Petersen, Howard Meyerson, Neena Singh*
Department of Pathology, Case Western Reserve University, Cleveland, Ohio, United States of America
Abstract
Despite overwhelming evidence implicating the prion protein (PrP) in prion disease pathogenesis, the normal function of this cell surface glycoprotein remains unclear. In previous reports we demonstrated that PrP mediates cellular iron uptake and transport, and aggregation of PrP to the disease causing PrP-scrapie (PrPSc) form results in imbalance of iron homeostasis in prion disease affected human and animal brains. Here, we show that selective deletion of PrP in transgenic mice (PrPKO) alters systemic iron homeostasis as reflected in hematological parameters and levels of total iron and iron regulatory proteins in the plasma, liver, spleen, and brain of PrPKOmice relative to matched wild type controls. Introduction of radiolabeled iron (59FeCl
3) to Wt and PrPKO mice by gastric gavage reveals inefficient transport of 59Fe from the duodenum to the blood stream, an early abortive spike of erythropoiesis in the long bones and spleen, and eventual decreased59Fe content in red blood cells and all major organs of PrPKO mice relative to Wt controls. The iron deficient phenotype of PrPKOmice is reversed by expressing Wt PrP in the PrPKObackground, demonstrating a functional role for PrP in iron uptake and transport. Since iron is required for essential metabolic processes and is also potentially toxic if mismanaged, these results suggest that loss of normal function of PrP due to aggregation to the PrPSc form induces imbalance of brain iron homeostasis, resulting in disease associated neurotoxicity.
Citation:Singh A, Kong Q, Luo X, Petersen RB, Meyerson H, et al. (2009) Prion Protein (PrP) Knock-Out Mice Show Altered Iron Metabolism: A Functional Role for PrP in Iron Uptake and Transport. PLoS ONE 4(7): e6115. doi:10.1371/journal.pone.0006115
Editor:Joseph El Khoury, Massachusetts General Hospital and Harvard Medical School, United States of America
ReceivedFebruary 4, 2009;AcceptedMay 20, 2009;PublishedJuly 1, 2009
Copyright:ß2009 Singh et al. This is an open-access article distributed under the terms of the Creative Commons Attribution License, which permits unrestricted use, distribution, and reproduction in any medium, provided the original author and source are credited.
Funding:NIH grants NS39089 and NS35962 to NS. The funders had no role in study design, data collection and analysis, decision to publish, or preparation of the manuscript.
Competing Interests:The authors have declared that no competing interests exist. * E-mail: [email protected]
Introduction
Prion protein (PrP) is a ubiquitously expressed cell surface glycoprotein linked to the plasma membrane by a glycosylpho-sphatidylinositol (GPI) anchor. Although several lines of evidence support the obligate role of PrP in animal and human prion disorders, relatively less is known about the normal function of this protein [1,2]. Attempts to understand the physiological function of PrP by generating PrP knock-out (PrPKO) transgenic mouse lines have been futile since the mice do not develop an overt phenotype other than resistance to prion disease [3]. The limited information on possible physiological function(s) of PrP has been obtained from the Zurich 1 and Edinburgh PrPKOmice since these do not up-regulate Doppel, a PrP homologue that induces cerebellar degeneration [4,5]. Most of the investigations on these and other mouse models have focused on brain function since PrP is most abundant on neuronal cells and is therefore likely to alter brain function by its absence. A similar loss of function due to aggregation of PrP to the disease causing PrP-scrapie (PrPSc) form is also likely to alter neuronal function, partially explaining the pathogenesis of prion disorders and justifying the focus [2]. Several important facts have emerged from these studies; PrPKO mice show altered circadian rhythm and sleep pattern, increased susceptibility to neuronal damage by oxidative stress and cerebral ischemia, neurotoxicity by expression of Doppel and N-terminally truncated PrP, increased predilection to seizures, motor and
cognitive abnormalities, reduced synaptic inhibition and long term potentiation in the hippocampus, altered development of the granule cell layer, mis-regulation of the cerebellar network, and age-dependent spongiform change with reactive astrogliosis [5– 10]. Examination of peripheral organ systems reveals impaired ability of hematopoietic progenitor cells of PrPKOmice to colonize when transplanted to irradiated recipient mice [11], and poor recovery of PrP lacking animals from experimentally induced anemia [12]. The multiplicity of observations attributed to the absence of PrP in the same transgenic mouse line suggests its involvement in an essential function with broad implications. Though attractive, this hypothesis has remained untested.
deficient phenotype of PrPKO mice is rescued by re-introducing PrP on the PrPKObackground, indicating a functional role for PrP in iron uptake and transport. Since iron is an essential element that is necessary for survival but can be extremely toxic if mis-managed [15], these results have significant implications for understanding the physiological function of PrP in cellular iron metabolism, and the pathological implications thereof due to its aggregation to the PrPSc form, the principal agent responsible for prion disease associated neuronal death.
Results
Major organs of PrPKOmice show a phenotype of relative iron deficiency
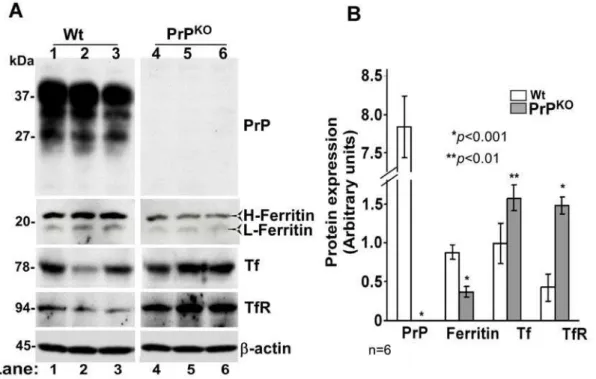
Since PrP is expressed most abundantly on neurons, the effect of PrP deletion on brain iron homeostasis was assessed in PrPKOand matched Wt controls. In iron deficiency, we expect low levels of total iron, decreased levels of iron storage protein ferritin, and increased levels of iron uptake proteins Tf and TfR in the affected tissue. To evaluate these parameters, equal quantity of protein from brain homogenates of PrPKOand Wt mice was fractionated by SDS-PAGE and immunoblotted (Figure 1A). Probing for PrP reveals the expected glycoforms migrating between 27–37 kDa in Wt, and complete absence of PrP in PrPKOsamples as expected. Probing for ferritin shows a decrease in H- and L-chain isoforms in PrPKOsamples relative to Wt controls. Tf and TfR, on the other hand, show a relative increase in PrPKOsamples. Probing forb -actin confirms that the observed differences are not an artifact of protein loading (Figure 1A, lanes 1–6). Quantification by densitometry shows a decrease in ferritin levels by 59% and an
increase in Tf and TfR levels by 58% and 245% respectively in PrPKOsamples relative to Wt controls (Figure 1B).
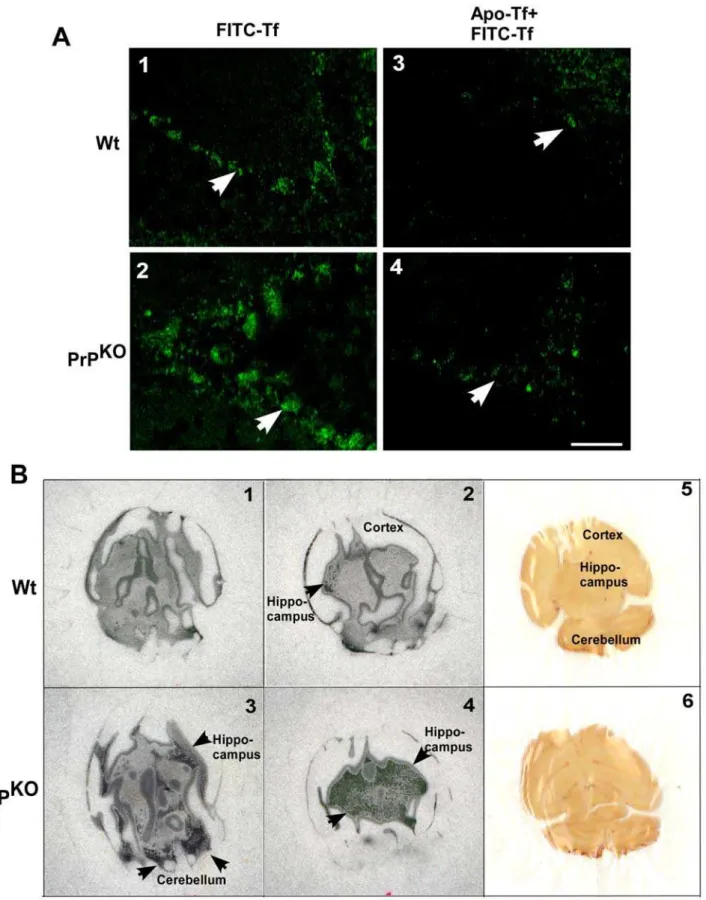
Brain homogenate represents a mixture of different cell types and the above results do not necessarily reflect the iron status of neurons, the cell population most vulnerable to alterations in iron homeostasis. To evaluate the iron status of neurons, unfixed brain sections from Wt and PrPKO mice were incubated with FITC-tagged Tf for 15 minutes at 37uC [16], washed gently with cold PBS to remove unbound Tf, and fixed with paraformaldehyde. A set of control samples were pre-incubated with unlabeled apo-Tf for 15 minutes before exposure to FITC-Tf to compete for binding sites. Examination by fluorescence microscopy shows significantly more binding of FITC-Tf to the cerebellar Purkinje cell layer of PrPKO brain sections compared to Wt controls, suggesting higher expression of TfR in PrPKOneurons (Figure 2A, panels 1 and 2, white arrow). The binding of FITC-Tf is inhibited competitively by pre-incubation of brain sections with unlabeled apo-Tf, indicating the specificity of the reaction (Figure 2A, panels 3 and 4, white arrow-head). To further analyze the state of iron deficiency in PrPKObrains, equal counts of59FeCl3were injected in the tail vein of Wt and PrPKOmice, and after a chase of 3 hours, mice were euthanized and cold PBS was infused from the heart to drain capillary blood. Subsequently, brains were harvested, counted in a
c-counter, and fixed overnight in formalin. Subsequently, 700mM
sections were cut and exposed to X-ray film. Brains of PrPKOmice take up 45% more59Fe relative to Wt controls as estimated by total counts and visualization on X-ray film exposed to dry sections (Figure 2B, panels 1–4, black arrows). These results indicate a state of relative iron deficiency and consequent increased transport of 59
Fe to the brains of PrPKOmice.
Figure 1. Brain homogenates of PrPKOmice show evidence of iron deficiency. (A)Immunoblot analysis of Wt and PrPKObrain homogenates
with PrP specific antibody 8H4 shows the expected glycoforms of PrP in Wt samples migrating between 27–37 kDa, and no reaction with PrPKO
samples as expected (lanes 1–6). Immunoreaction for ferritin, Tf, and TfR shows significantly less ferritin, and more Tf and TfR levels in PrPKOsamples
compared to Wt controls (lanes 1–6). Reaction forb-actin confirms similar loading of protein.(B)Quantitative estimation of proteins in (A) after normalization withb-actin shows a decrease in ferritin, and an increase in Tf and TfR levels in PrPKOsamples compared to Wt controls. Values are mean6SEM. *p,0.001, **p,0.01 relative to Wt. n = 6.
Figure 2. Brain sections of PrPKOmice show up regulation of TfR and increased transport of iron from the blood stream. (A)
Incubation of unfixed brain sections with FITC-Tf shows significantly more binding to the Purkinje cell neurons of PrPKOsample compared to Wt
controls (panels 1 and 2) [16]. Pre-incubation of brain sections with unlabeled apo-Tf decreases the signal significantly in both samples (panels 3 and 4), demonstrating the specificity of binding. The assay was performed on three sections each from three different sets of mice. A representative section is shown.(B)Autoradiograph of brain sections prepared from Wt and PrPKOmice injected with59FeCl
3intravenously shows significantly more 59Fe in PrPKOsections compared to Wt controls (panels 1–4). A scan of brain sections exposed to the film in panels 2 and 4 respectively is shown
(panels 5 and 6). (Two consecutive 700mM sections from each brain sample are shown.59Fe is visible as radio-opaque black dots. doi:10.1371/journal.pone.0006115.g002
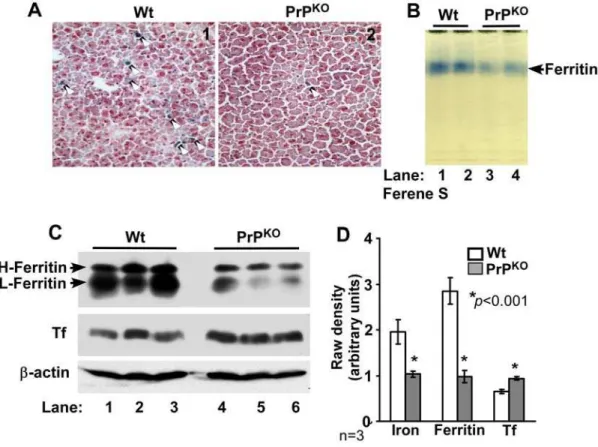
To determine whether a similar phenotype of iron deficiency is observed in other major organs of PrPKOmice, the iron content and levels of the iron management proteins ferritin and Tf were evaluated in the liver of Wt and PrPKOmice. Frozen sections of Wt and PrPKOliver were stained for iron with Prussian blue and examined. PrPKOsections show significantly less iron in Kupffer cells and hepatocytes relative to Wt controls (Figure 3A, panels 1 and 2). Fractionation of liver homogenates on a non-denaturing gel followed by in-gel reaction with Ferene-S shows lower iron content in PrPKOliver ferritin compared to Wt controls (Figure 3B, lanes 1–4) [17]. (The identity of the blue band as ferritin was established by immunoblotting as described previously [13]). Evaluation of ferritin and Tf expression in liver homogenates shows significantly lower levels of ferritin and higher levels of Tf in PrPKOsamples compared to Wt controls (Figure 3C, lanes 1–6). Quantification by densitometry shows a decrease in the iron content and expression of ferritin by 48% and 66% respectively, and an increase in the expression level of Tf by 44% in PrPKO samples relative to Wt controls (Figure 3D).
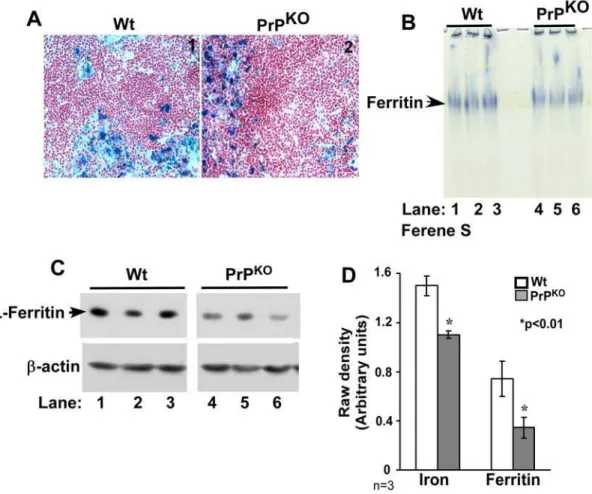
A similar analysis of spleen sections shows intense reaction for iron with the Perl’s stain in both Wt and PrPKO samples (Figure 4A, panels 1 and 2). In-gel reaction of spleen ferritin with Ferene-S shows a decrease in the iron content and expression of ferritin in PrPKOsamples relative to Wt controls (Figures 4B and C, lanes 1–6). Quantification by densitometry shows a decrease in the iron content and expression of ferritin by 27%, and 64% in
PrPKOsamples compared to Wt controls (Figure 4D). Re-probing of the membrane for Tf and TfR did not show a significant difference in the expression of these proteins (data not shown).
Together, the above results suggest a phenotype of relative iron deficiency in the brain, liver, and spleen of PrPKOmice compared to Wt controls. Subsequent studies were directed at characterizing the iron deficient phenotype of PrPKOmice and the mechanistic basis of this finding.
The iron deficiency of PrPKOmice is largely compensated To evaluate if the phenotype of iron deficiency in PrPKOmice is due to low circulating iron, hematological parameters were evaluated by an automated blood chemistry analyzer optimized for mouse samples. Hemoglobin, serum iron, Tf saturation, and serum ferritin are decreased in PrPKOsamples by 3.5, 21.6, 37.6 and 50.1% respectively, while the reticulocyte count and total iron binding capacity (TIBC) are increased by 42.2 and 24.0% respectively in PrPKO samples relative to matched Wt controls (Table 1). The total red cell count and hematocrit show minimal differences between the two groups. Bone marrow smears revealed an increase in red cell precursors in PrPKOsamples, indicating an attempt by the iron homeostatic machinery to compensate for the iron deficiency in PrPKOanimals (data not shown).
Subsequent studies were directed at determining whether the iron deficiency in PrPKOmice arises from inefficient uptake and/ or transport of iron from ingested food, defective uptake by target
Figure 3. Liver of PrPKOmice displays a phenotype of iron deficiency. (A)Prussian blue staining of frozen sections shows minimal reaction
for iron in the PrPKOsample compared to Wt controls.(B)In-gel reaction of homogenates with Ferene-S shows significantly less iron content of PrPKO
ferritin compared to Wt controls (lanes 1–4).(C)Immunoreaction of homogenates with anti-ferritin antibody specific for H and L chains shows significantly less ferritin expression in PrPKOsamples compared to Wt controls (lanes 1–6). Re-probing for Tf shows an increase in Tf expression in
cells of different organ systems, or a combination of both processes.
PrP mediates iron uptake and/or transport from the duodenum to the blood stream
The uptake and transport of ingested iron from the intestinal lumen to the blood stream and target organs of Wt and PrPKO mice was evaluated by introducing radioactive iron into the stomach, and quantifying 59Fe uptake by various organs after defined time points of chase. The following organs were evaluated: 1) stomach with attached duodenum, jejunum, and a small piece of ileum, 2) liver, 3) spleen, 4) brain, 5) femurs, and 6) tibial bones. Washed upper gastrointestinal tract was vacuum-dried and exposed to X-ray film (Figure 5A), and after obtaining adequate film exposures, 59Fe incorporated in the upper 10 cm of the duodenum was quantified in ac-counter. Whole blood, washed red blood cells (RBCs), plasma, organs, and bones were counted in ac-counter to quantify59Fe incorporation.
Autoradiographs of duodenum samples demonstrate significantly more59Fe in PrPKOsamples at each time point compared to Wt Figure 4. Spleen of PrPKOmice displays a phenotype of iron deficiency. (A)Prussian blue staining of frozen sections shows a prominent reaction in the reticulo-endothelial cells of PrPKOand Wt samples.(B)In-gel reaction of homogenates with Ferene-S shows less iron content of PrPKO ferritin compared to Wt controls (lanes 1–6).(C)Immunoreaction of homogenates with L-chain specific anti-ferritin antibody shows significantly less expression in PrPKOsamples compared to Wt controls (lanes 1–6). Re-probing forb-actin confirms that the difference is not an artifact of protein loading (lanes 1–6).(D)Quantification by densitometry after normalization withb-actin shows a significant reduction in the iron content and expression of ferritin in PrPKOsamples compared to matched Wt controls. Values are mean6SEM, n = 3. *p,0.01 relative to Wt.
doi:10.1371/journal.pone.0006115.g004
Table 1.Hematological parameters in Wt and PrPKOmice.
Wt PrPKO
% change in PrPKO N
RBC (1012/L) 9.2360.12 9.2060.33 NS 14
Hematocrit (%) 49.0161.08 49.0561.45 NS 14
Hemoglobin (g/dl) 14.5460.19 14.0260.28*** Q3.5 14
Reticulocytes (%) 3.4660.23 4.9260.27* 42.2q 10
Serum iron (mg/dl) 325.066.91 254.5614.8* Q21.6 6
TIBC (mg/dl) 451.73625.8 561.09636.61** 24.0q 6
Tf saturation (%) 70.3164.52 43.8666.12** Q37.6 6
Serum ferritin (ng/dl) 98.5164.82 49.1366.43* Q50.1 6 Values are mean6SEM.*
p,0.001,**
p,0.01,***
p,0.05 as compared to Wt. NS: not significant; N: number of animals in each group; RBCs: red blood cells; TIBC: total iron binding capacity; Tf: transferrin;Q: decrease;q: increase. doi:10.1371/journal.pone.0006115.t001
controls (Figure 5A, lanes 1–12). Surprisingly, the amount of59Fe in the duodenum of PrPKO mice is significantly higher than Wt samples even after 11 days of chase (Figure 5A, lanes 11 and 12). Samples in lanes 1–8 were exposed to X-ray film for 2 hours, lanes 9 and 10 for 24 hours, and lanes 11 and 12 for 6 days to highlight the difference in 59Fe content between Wt and PrPKO samples (Figure 5A, lanes 9–12). Quantitative analysis of these results was performed by counting the first 10 cm of the duodenum from each sample in ac-counter. As expected, both samples show a gradual decline in59Fe counts with increasing chase time, falling to 0.1% of the initial value after 11 days of chase. However, PrPKOsamples show higher retention of59Fe by 21, 60, 87, 32, and 57% relative to matched Wt controls after a chase of 1, 4, 24, and 48 hours and 11 days respectively (Figure 5B). Mice ranging in age from 3–6 months and blinded to the person performing the experiment yielded similar results. The 1 and 4 hour chase time points were repeated more than 6 times.
To evaluate whether increased retention of 59Fe in the duodenum of PrPKO mice is due to sequestration in ferritin within enterocytes,59FeCl3fed Wt and PrPKOmice were chased for 4 hours, and the first 5 cm of the duodenum was homogenized and fractionated on a non-denaturing gel to identify59Fe-labeled proteins as described previously [13]. A single iron labeled band that immunoreacts for ferritin is detected in Wt and PrPKO samples (Figure 6A, lanes 1–4). The iron content and expression of
ferritin are higher in the PrPKOsample compared to Wt control, explaining the significantly higher59Fe content in the duodenum of PrPKOmice (Figure 6A, lanes 1–4). Fractionation of the same samples by SDS-PAGE followed by immunoblotting confirms that ferritin levels are significantly higher in the PrPKO sample (Figure 6A, lanes 5 and 6). (The identity of iron labeled bands in lanes 1 and 2 was confirmed by eluting labeled proteins from these bands and re-fractionating on SDS-PAGE followed by immuno-blotting as described previously [13]). Quantification by c -counting and densitometry shows an increase in the59Fe content of ferritin by 42% and expression of ferritin by 119% in PrPKO samples relative to matched Wt controls (Figure 6B).
These results indicate that PrPKOmice take up more59Fe from the intestinal lumen and/or release less into the blood stream compared to Wt controls, resulting in the accumulation of59Fe in the duodenal epithelium.
PrP facilitates iron uptake by parenchymal cells and hematopoietic precursor cells
Transport of iron from the duodenal epithelium to the blood stream and subsequent uptake by various organs was evaluated by quantifying59Fe in the plasma, washed RBCs, and various organs in a c-counter, and fractionating the plasma using a non-denaturing gel to evaluate the 59Fe content of Tf. The 59Fe counts in the plasma of PrPKOmice are decreased by 12% after Figure 5. Iron is retained in the duodenum of PrPKOmice. (A)Autoradiogram of upper gastrointestinal tract of Wt and PrPKOmice fed 20
mCi of59FeCl
3by gastric gavage shows higher levels of59Fe in PrPKOsamples after 1, 4, 24, and 48 hours of chase (lanes 1–10). The difference becomes
more obvious after 11 days of chase (lanes 11 and 12). (Lanes 9 and 10 were exposed for 24 hours and lanes 11 and 12 for 6 days to observe the difference clearly). A representative experiment out of a total of three is shown.(B)Quantification of59Fe in the first 10 cm of the duodenum shows
significantly higher59Fe in the PrPKOsamples at all time points tested compared to matched Wt controls. Values are mean
6SEM, n = 3. *p,0.01 as compared to Wt.
1 hour, and increased by 47, 108, 51, and 40% after 4, 24, and 48 hours and 11 days of chase respectively relative to Wt controls (Figure 7, plasma). Red blood cells show no incorporation of59Fe after 1 hour as expected, a sudden increase in PrPKOsamples by 537% after 4 hours, and a decrease by 60, 48, and 63% after 24 and 48 hours and 11 days respectively relative to Wt controls (Figure 7, red cells). The spleen of PrPKOmice shows 62% less 59
Fe after 1 hour, an increase by 831% after 4 hours, followed by a precipitous fall by 64% of Wt values after 24 hours that is maintained throughout 11 days of chase (Figure 7, spleen). Likewise, the femurs of PrPKO mice show 25% less 59Fe after 1 hour, an increase by 261 and 17% after 4 and 24 hours, and a decline by 39% after 11 days respectively relative to Wt controls. Femurs of Wt mice also show a spike in59Fe after 24 hours of chase, but the increase is significantly less than PrPKO samples (Figure 7, Femur). The liver of PrPKOmice shows an increase in 59
Fe by 47 and 82% after 1 and 4 hours, an increase by 339% after 24 hours, and a precipitous fall by 69% after 11 days of chase relative to Wt controls (Figure 7, liver). Brain samples show variability during the first 48 hours of chase in both PrPKOand Wt mice, but after 11 days there is a significant decrease in PrPKO samples by 69% of Wt values (Figure 7, brain).
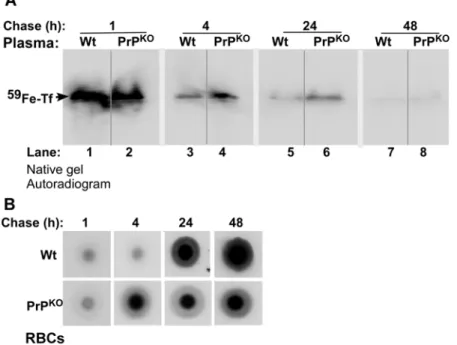
Fractionation of plasma by non-denaturing gel electrophoresis followed by autoradiography reveals the presence of59Fe-Tf in Wt and PrPKOsamples as expected (Figure 8A) (The identity of59Fe
labeled band as Tf was established by immunoblotting as reported earlier [13]). The59Fe content of Tf in the PrPKOsample is lower after 1 hour and significantly higher after 4 and 24 hours of chase relative to Wt controls (Figure 8A, lanes 1–6). Minimal signal is detected after 48 hours of chase in either of the samples (Figure 8A, lanes 7 and 8). Evaluation of the59Fe content of RBCs spotted on a PVDF membrane followed by autoradiography shows increased incorporation in PrPKO samples after 4 hours and minimal increase thereafter until 48 hours of chase. Wt samples, on the other hand, show significant incorporation after 24 hours and almost doubling of the counts by 48 hours (Figure 8B), reflecting the values in Figure 7 above. These results indicate inefficient transport of59Fe from the duodenum of PrPKOmice to the blood stream, but much faster kinetics of incorporation into RBC precursors by 4 hours of chase and minimal increase thereafter. In contrast, Wt mice show significantly higher transport of59Fe to the blood stream, incorporation into RBCs at the expected chase time of 24 hours, and a linear increase in the59Fe content of RBCs thereafter. Since the majority of Tf-bound 59Fe is taken up by newly synthesized RBCs, the increase in plasma59Fe-Tf in PrPKO mice after 4 hours of chase relative to Wt controls indicates decreased uptake as evidenced by the lower59Fe content of PrPKO RBCs (Figure 8A, lanes 3–6).
Together, the above results indicate that the transport of iron from the duodenal enterocytes to the blood stream and uptake by Figure 6. Iron is retained within ferritin in the duodenal epithelium of PrPKOmice. (A)The 4 hour duodenum samples in Figure 5 above were homogenized and separated on a non-denaturing gel followed by autoradiography (lanes 1 and 2). The level of 59Fe labeled ferritin is
significantly higher in the PrPKOsample compared to matched Wt control (lanes 1 and 2). Transblotting under native conditions followed by immunoblotting for ferritin confirms the identity of59Fe labeled bands as ferritin (lanes 3 and 4). Fractionation of the same samples by SDS-PAGE
followed by immunoblotting shows relatively more ferritin in the PrPKOsample compared to matched Wt control (lanes 5 and 6).(B)Quantification
by densitometry shows significantly more59Fe-ferritin and ferritin protein levels in the duodenum of PrPKOmice relative to matched Wt controls.
Values are mean6SEM, n = 3. *p,0.001 relative to Wt. doi:10.1371/journal.pone.0006115.g006
the RBCs, liver, and brain is less efficient in PrPKO mice and follows different kinetics of utilization relative to Wt controls. It is likely that PrPKO mice make an early attempt at erythropoiesis because of their iron deficient state, but are unable to incorporate enough iron into RBCs due to defective uptake by hematopoietic progenitor cells. The lower59Fe content of PrPKORBCs is not due to a shorter life-span of these cells since their59Fe counts remain constant throughout 11 days of chase (Figure 7), the normal half-life of murine RBCs. No signs of hemolysis were detected at any time point of chase by urine-analysis (data not shown).
Iron deficient phenotype of PrPKOmice is not due to sequestration of iron in reticulo-endothelial cells
To rule out low level of hemolysis combined with sequestration of59Fe in cells of the reticulo-endothelial system in PrPKOmice, spleens harvested after 1–48 hours of chase (as in Figure 7 above) were homogenized, and equal quantity of protein was fractionated by non-denaturing gel electrophoresis followed by autoradiogra-phy. Prominent bands of59Fe-ferritin and59Fe-Tf are detected in the PrPKO sample after 4 hours of chase revealing59Fe content several-fold higher than matched Wt controls (Figure 9, lanes 3 Figure 7. Distribution of59Fe in Wt and PrPKOmice. Plasma:59
Fe in PrPKOsamples is lower after 1 hour, increases by 48 hours, and falls to values below Wt after 11 days of chase.RBCs:Wt RBCs show59Fe incorporation after 24 hours, and the amount increases steadily till 11 days of
chase. PrPKORBCs, on the other hand, incorporate59Fe relatively sooner after 4 hours, and show only a modest increase till 11 days of chase. Except for the 4 hour chase time, the amount of59Fe in PrPKORBCs is significantly lower than Wt controls, especially after 11 days of chase.Spleen:Wt
samples show a slight increase in59Fe after 24 hours, and minimal change thereafter. PrPKOspleens, on the other hand, show a significant increase
after 4 hours, followed by a precipitous fall after 24 hours.Femur:Kinetics of59Fe uptake mirrors that of the spleen. PrPKOsamples show a spike at
4 hours that is maintained till 24 hours, followed by a fall. Wt samples show a delayed peak at 24 hours, and a fall to similar levels as the PrPKOsample
after 11 days.Liver:Wt samples show a steady increase in59Fe till 11 days of chase. PrPKOsamples, on the other hand, show a peak at 24 hours, and
the counts fall thereafter to values significantly lower than Wt controls.Brain:Wt and PrPKOsamples do not show much difference at early time
points of chase, but59Fe incorporation in the PrPKOsample is significantly lower than Wt controls after 11 days of chase. Values are mean6SEM of three independent experiments. *p,0.01, **p,0.001 relative to Wt.
and 4). However, the signal is lost by 24 hours of chase, making it unlikely that reticulo-endothelial cells sequester the incorporated 59
Fe (Figure 9, lanes 5–8). At all other time points the Wt sample shows slightly higher59Fe-ferritin and59Fe-Tf compared to PrPKO samples (Figure 9, lanes 1, 2, and 5–8). The identity of59Fe labeled bands as ferritin and Tf was established by immunoblotting under native conditions as described previously [13].
Further confirmation of the above results was obtained by culturing peritoneal macrophages from Wt and PrPKO mice overnight, loading them with 59FeCl3-citrate complex after stimulation with LPS [18], and monitoring release of 59Fe into the medium in a c-counter. Macrophages from PrPKO mice release 17% of intracellular iron into the medium compared to
13% from the Wt sample during a chase of 18 hours, making it unlikely that sequestration of59Fe in the reticulo-endothelial cells is responsible for the iron deficient phenotype of PrPKO mice (Table 2).
Expression of wild type PrP rescues the iron deficient phenotype of PrPKOmice
Since the only difference between Wt and PrPKO mice is the absence of PrP expression in the latter, a single allele of Wt PrP was re-introduced on the PrPKO background to generate PrP+
mice. To assess the expression levels of PrP in PrP+
mice relative to Wt controls, an equal quantity of protein from brain homogenates Figure 8. Time course of59Fe distribution in the blood of Wt and PrPKOmice. (A):Equal volume Wt and PrPKOplasma collected at different
time points of chase were separated on a non-denaturing gel followed by autoradiography. After 1 hour of chase,59Fe-Tf in the PrPKOsample is lower than matched Wt controls (lanes 1 and 2). However, the ratio reverses thereafter, and the level of59Fe-Tf in the PrPKOsample is higher than Wt
controls after 4, 24, and 48 hours of chase (lanes 3–8).(B)RBCs of Wt mice show minimal levels of59Fe after 1 and 4 hours, and significant increase after 24 and 48 hours of chase. PrPKOmice, on the other hand, show iron counts at 4 hours, and minimal increase thereafter.
doi:10.1371/journal.pone.0006115.g008
Figure 9. Kinetics of59Fe uptake by Wt and PrPKOspleen.Autoradiogram of Wt and PrPKOspleen homogenates separated on a native gel show significantly higher59Fe-ferritin and59Fe-Tf in the PrPKOsample after 4 hours of chase (lanes 3 and 4). At other time points Wt samples show
higher levels of59Fe in ferritin and Tf bands relative to PrPKOsamples (lanes 1 and 2 and 5–8). (The identity of ferritin and Tf bands was confirmed by immunoblotting [13]).
doi:10.1371/journal.pone.0006115.g009
of Wt, PrPKO, and PrP+mice was fractionated by SDS-PAGE and
immunoblotted. Probing for PrP shows the expected glycoforms of PrP migrating between 27–37 kDa in Wt and PrP+ samples
(Figure 10A, lanes 1 and 3). Quantification by densitometry shows slightly higher PrP expression in PrP+mice,
,10% relative to Wt
controls. PrPKO samples do not react for PrP as expected (Figure 10A, lane 2). Thus, PrP+
mice are a suitable model to test whether expression of PrP rescues the iron deficient phenotype of PrPKOmice.
To reduce variability, littermate PrPKO and PrP+ mice were
obtained by crossing PrP+ and PrPKO
breeding pairs. After confirming the genotype (data not shown), littermate PrP+ and
PrPKO, Wt, and PrPKOmice were evaluated for iron uptake and transport by introducing equal amounts of 59FeCl3 by gastric gavage as in Figures 5 and 7 above (Figure 10B and C). Only the 4 hour chase time point was assessed since the maximum differences between Wt and PrPKO mice are observed at this time point (Figure 5 and 7 above). Autoradiography of duodenum samples shows significantly more 59Fe in the PrPKO sample compared to the Wt control as noted in Figure 5 above (Figure 10B, lanes 1 and 2). Notably, a similar difference is seen between PrPKOand PrP+littermates (Figure 10B, lanes 3 and 4),
Table 2.Release of59Fe from peritoneal macrophages after 18 hours.
Intracellular Secreted (18 h) % Secreted
Wt 151689612376 203116328 13%
PrPKO 14141361995 240546604* 17%
Values are mean6SEM of cells plated in triplicate from two different sets of mice.*
p,0.01 compared to Wt. doi:10.1371/journal.pone.0006115.t002
Figure 10. Iron deficiency in PrPKOmice is reversed by expressing Wt PrP. (A)Immunoblot analysis of Wt and littermate PrPKOand PrP(+)
brain homogenates for PrP shows the expected glycoforms of PrP in Wt and PrP(+)
samples (lanes 1 and 3), and no reaction in the PrPKOsample as expected (lane 2).(B)Autoradiogram of the upper gastrointestinal tract of Wt and littermate PrP(+)and PrPKOmice fed59FeCl
3by gastric gavage as
above and chased for 4 hours shows significantly more59Fe in the PrPKOsample relative to Wt control (lanes 2 and 4). Notably, the59Fe content of
PrP(+)duodenum is similar to Wt, and significantly less than the littermate PrPKOsample (lanes 1, 3 and 4).(C)Quantification of59Fe in the first 10 cm
of the duodenum shows significantly more59Fe in the PrPKOsample compared to matched Wt control. Similarly, more59Fe is detected in the PrPKO
sample compared littermate PrP(+)
control. One way ANOVA shows a significant difference in59Fe incorporation between Wt and PrPKO, Wt and littermate PrPKO, PrP(+)and littermate PrPKO, and PrPKOand PrP(+)(
p,0.0001). Post hoc Bonferroni tests show significant difference in59Fe in PrPKOas
well as littermate PrP(+)
and PrPKOduodenums compared to Wt control (*p,0.01;#p,0.05). PrP(+)
exhibit significant difference compared to PrPKO ($p,0.01), and littermate PrP(+)and PrPKOalso differ significantly (@p
indicating improved transport of59Fe from the duodenum of mice expressing PrP. Wt and PrP+
samples show similar levels of iron, confirming the above results (Figure 10A, lanes 1 and 3).
Quantification of59Fe in the first 10 cm of duodenum samples shows an increase in PrPKOsamples by 132% relative to Wt controls, and an increase in littermate PrPKOby 238% relative to littermate PrP+controls (Figure 10C). As expected, Wt and PrP+samples show
minimal difference in their59Fe content (Figure 10C, lanes 1 and 3). Quantification of59Fe in the blood, liver, spleen and femur shows similar incorporation in Wt and PrP+controls, and higher levels in
PrPKO mice as observed in Figure 7 above (Figure 11). These observations demonstrate that the deficiency of iron uptake in PrPKO mice is reversed by the expression of PrP in the PrP+mice.
Discussion
In this report, we demonstrate that the absence of PrP induces systemic iron deficiency in PrPKO mice, a phenotype that is
rescued by re-introducing PrP on the PrPKObackground. Relative to normal Wt mice of the same genetic background, PrPKOmice exhibit lower levels of iron in the plasma, brain, liver, and spleen, and the major iron metabolism proteins show a compensatory response by increasing the levels of iron uptake proteins Tf and TfR, and decreasing the levels of iron storage protein ferritin. The underlying cause of iron deficiency in PrPKOmice is likely to be two-fold; 1) inefficient transport from duodenal enterocytes to the blood stream, and 2) impaired uptake by target cells of various organs, including the hematopoietic precursor cells. We previously reported that PrP functions as an iron uptake and transport protein in human neuroblastoma cells in vitro [13]. This report supports and extends those findings by demonstrating a similar function of PrP in mouse models, a novel function for a protein known mostly for its role in the pathogenesis of prion disorders.
It is surprising that the mere absence of PrP alters iron metabolism in both enterocytes and hematopoietic cells since distinct processes regulate iron uptake and transport at these sites.
Figure 11. Distribution of59Fe in PrP(+)and PrPKOlitter-mates.Distribution of59Fe in the blood, liver, spleen, and femur after 4 hours of
chase shows similar incorporation in Wt and PrP(+)
mice in the organs tested, and significantly more59Fe in the spleen and femur of PrPKOmice as noted above. One way ANOVA shows a significant difference among Wt, PrPKO, and PrP(+)samples (p
,0.0001). Post hoc Bonferroni tests show significant difference in59Fe in littermates PrP(+)
and PrPKOorgans relative to Wt controls (*p,0.01; **p,0.05). Littermate PrP(+)
shows a significant difference compared to PrPKOcounterpart (#p
,0.01). Values are mean6SEM of three independent experiments. doi:10.1371/journal.pone.0006115.g011
In the intestine, absorption of non-heme iron, the form used in this study, is mediated by the divalent metal transporter 1 (DMT1) at the apical (AP) plasma membrane of duodenal epithelial cells. Here, duodenal cytochrome b (DcytB) functions as a ferric reductase and reduces Fe(III) iron to the Fe(II) form for transport to the cytosol by DMT1. Absorbed iron is transported through the cytosol by poorly characterized mechanisms and is exported from the basolateral (BL) membrane by the concerted effort of ferroportin (FPT) and hephaestin, a multicopper oxidase that oxidizes Fe(II) iron to the Fe(III) form for uptake by Tf in the systemic circulation [19].
Based on our observations, it appears that PrP mediates iron export from the BL membrane of enterocytes to the blood stream rather than uptake from the intestinal lumen. This conclusion is supported by our observations demonstrating accumulation of orally administered radioactive iron (59FeCl3) in the duodenal enterocytes of PrPKOmice that persists until eleven days of chase when almost all59Fe from Wt controls has been transported out. Most of the 59Fe accumulates in ferritin within these cells, a surprising observation given the state of iron deficiency in these mice. Ferritin protein expression is also up-regulated in PrPKO enterocytes, probably reflecting a response to increased iron influx from the AP plasma membrane, decreased transport from the BL membrane, or a combination of the two processes. Although limited amounts of 59Fe are released into the blood stream of PrPKO mice during the first hour of chase, the amount is significantly lower compared to Wt controls. Furthermore, PrP is expressed on the BL surface of MDCK cells, a polarized epithelial cell line, and inter-cellular junctions of mouse enterocytes [20,21], suggesting a functional role at the BL domain rather than the AP plasma membrane. It is surprising that PrPKO mice excrete relatively less 59Fe in their feces despite the iron loaded state of their enterocytes (unpublished observations). It is likely that this response reflects an attempt to conserve and utilize the absorbed iron by PrPKOmice due to their chronic state of iron deficiency. A similar phenotype of systemic iron deficiency resulting from accumulation of absorbed iron in the duodenal epithelium has been reported in sex-linked anemia (Sla) mice due to a mutation in the intestinal ferroxidaseHephaestin [22]. Based on our data, it is likely that PrP functions upstream from hephaestin, perhaps as a ferric-reductase, to reduce Fe(III) iron stored in ferritin to the Fe(II) form for transport across the BL membrane and subsequent oxidation by hephaestin for delivery to circulating Tf. It is interesting to note that PrP has been reported to perform a similar function in copper transport where it reduces copper (II) prior to its delivery to cytosolic copper (I) carrying proteins [23]. It seems unlikely that PrP is an active ferroxidase based on a previous report [13] and our current observations on the rate of iron efflux from peritoneal macrophages of PrPKOmice. However, differen-tial activity of PrP in different cell lines cannot be ruled out, leaving it unclear whether PrP indeed functions as a ferroxidase like hephaestin. Since the iron deficiency in PrPKOmice is largely compensated and the animals live normally except for delayed erythropoiesis after induced hemolysis and specific deficiencies restricted mainly to the central nervous system [5,12], it is likely that PrP modulates the function of other iron uptake proteins or is involved in a parallel pathway that compensates for its absence. Identification of such proteins and pathways would be a significant step forward in understanding the role of PrP in iron export from the duodenum.
Absence of PrP also compromises the ability of hematopoietic precursor cells to take up iron from plasma Tf, an interesting observation since these cells acquire most of their iron by the Tf/ TfR pathway. A similar phenotype of iron deficiency has been
reported in neuroblastoma cells expressing lower levels or mutant forms of PrP, another cell line that utilizes the Tf/TfR pathway for acquiring iron [13]. It is therefore likely that PrP functions at a point where the enterocyte and the Tf/TfR pathway of iron uptake and transport intersect. Normally, plasma Tf provides iron to most cells of the body, and itself receives iron from three main sources; 1) food via the duodenum and proximal jejunum, 2) recycled senescent RBCs, and 3) iron stores within macrophages and hepatocytes. Most of the iron taken up from food is utilized for erythropoiesis, and RBCs contain 80% of the total body iron. Iron rich Tf binds to the TfR on hematopoietic precursor cells, and the Tf/TfR complex is endocytosed through clathrin mediated endocytosis. Tf bound iron is released in the acidic environment of the endosomes, reduced by the ferric reductase Steap3, and transported across the membrane by DMT1 to cytosolic ferritin for storage. Ferritin maintains the cellular labile iron pool to provide for the metabolic needs of cells, and is itself regulated by the iron content of cells through iron management proteins [22– 26]. It is surprising that the mere absence of PrP compromises the ability of parenchymal cells of various organs and hematopoietic precursor cells to take up iron.
PrPKOmice show an earlier and a significantly higher spike in 59
Fe uptake by the spleen and long bones relative to Wt controls. Since RBCs consume the majority of plasma iron and the spleen and long bones are the principal sites of erythropoiesis, these findings reflect an abnormally high rate of erythropoiesis in PrPKO mice. The presence of59Fe labeled cells in the peripheral blood of PrPKOmice after four hours of chase is surprising given the time it takes for RBCs to mature, and may reflect the binding of59Fe-Tf to TfR positive immature erythrocytes. However, while Wt RBCs continue to incorporate59Fe, PrPKORBCs show only a modest increase even after eleven days of chase. These results suggest that the erythropoiesis in PrPKO mice is ineffective despite adequate supplies of iron in the spleen and long bones, probably due to inefficient uptake by the hematopoietic precursor cells. The alternate possibility, i.e., increased turnover of RBCs in the spleen or intravascular hemolysis is unlikely based on the following observations: 1) 59Fe counts did not increase in the spleen of PrPKOmice at any time point after four hours of chase, the main organ where RBCs are turned over and the released iron recycled, 2) PrPKO RBCs did not show a decline in 59Fe counts during eleven days of chase given that the normal half-life of mouse RBCs is,15 days, 3)59Fe from hemolyzed RBCs was not detected in the urine, and 4) markers of hemolysis such as hemoglobinuria were not detected in PrPKOmice (unpublished observations). Further-more, the kinetics of 59Fe uptake from the plasma of Wt and PrPKO mice suggests decreased uptake by target organs rather than increased hemolysis in the latter. The precise biochemical pathway by which PrP facilitates iron uptake by the parenchymal and hematopoietic precursor cells is difficult to define from our data. However, based on our observations from neuroblastoma cells [13], it is likely that PrP facilitates transport across the endosomal membrane to the cytosol by functioning as a ferric reductase. Further studies are required to resolve this question.
on the PrPKObackground reverses the iron deficient phenotype completely, indicating that PrP is an integral component of the iron homeostatic machinery that feeds into the major pathways of iron uptake and transport.
In conclusion, this report demonstrates a significant role of PrP in maintaining systemic iron homeostasis. Specifically, PrP modulates iron transport from the duodenum to the blood stream and uptake by cells of the hematopoietic system, brain, liver, and spleen. Since major proteins and pathways of iron transport and uptake utilized by enterocytes and hematopoietic cells differ significantly [26], these observations suggest a functional role for PrP at a point downstream from these pathways. Although our data fall short of identifying the specific role of PrP in iron modulation, this report establishes the functional role of PrP in iron metabolism, and provides essential information on the possible sites where PrP influences iron metabolism independently, or by intersecting with known pathways of iron uptake and transport. Since imbalance of iron homeostasis is a common feature of prion disease affected human, hamster, and mouse brains [14], these results suggest a significant contribution of loss of PrP function to prion disease pathogenesis.
Materials and Methods
Materials and antibodies
PrP-specific monoclonal antibody 8H4 (against residues 145 to 180) was obtained from Abcam (Cambridge, MA, USA) and from Drs. Man-Sun Sy and Pierluigi Gambetti (Case Western Reserve University). Rabbit anti-human ferritin antibody that cross-reacts with H and L-chains of mouse ferritin was obtained from Sigma (catalog#F5012, lot number 117K4880), ferritin H-chain specific antibody was from Santa Cruz (Catalog#sc-25617, lot#L0104), ferritin L-chain specific antibody was also from Santa Cruz (Catalog# sc-25616, lot#E0905), anti-Tf was from GeneTex (San Antonio, TX), anti-TfR from Zymed Laboratories Inc (Carlsbad, CA), and horseradish peroxidase (HRP)-conjugated secondary antibodies were from GE Healthcare (Little Chalfont, Buckinghamshire, United Kingdom). All other chemicals were purchased from Sigma.
Transgenic mice
The PrPKOmice in the FVB background (FVB/Prnp0/0) were originally obtained from George Carlson, (McLaughlin Research Institute). The PrP+transgenic mice expressing wild type murine
PRNP were created by microinjection of the half-genomic PrP clone [28] into fertilized FVB/Prnp0/0eggs. The transgenic mice were screened by PCR and maintained via breeding with FVB/
Prnp0/0 mice. The genotype of littermate PrPKO and PrP+mice
were determined by PCR of DNA from ear punches.
Intestinal iron uptake and transport
All procedures with mice were performed according to the guidelines established by the Animal Resource Center of Case Western Reserve University, and were based on protocols approved by the IACUC committee. Three to six month old age- and sex-matched Wt and PrPKO mice maintained under similar conditions were fasted overnight with waterad libitum, and 20mCi of59FeCl3diluted in 0.2 ml of PBS was administered orally with an olive-tipped gavage needle. The mice were chased on normal chow for 1 h, 4 h, 24 h, 48 h and 11 days. At each chase time point, a set of Wt and PrPKO mice were euthanized, and blood was collected by cardiac puncture in heparinized vials. Plasma and red cells were separated by centrifugation at 5,000 rpm for 5 min. Stomach and upper gastro-intestinal tract
was separated and rinsed with cold PBS until clean. The samples were placed on a filter paper, vacuum dried, and subjected to autoradiography. The brain, liver, spleen, and femur were collected, washed with PBS, and snap frozen on dry ice. The organs were weighed, and radioactivity was counted in a c -counter. Selected samples of brain were fixed in 5% phosphate buffered formalin for 24 h, and 700mM thick sections were cut
using a Leica vibrotome. Cut sections were briefly air-dried and exposed to X-ray film.
Native gradient gel electrophoresis, autoradiography and immunoblotting
Native gradient gel electrophoresis, autoradiography, and immunoblotting were performed essentially as described by Vyoral et al. [29] and in a previous report [13].
SDS-PAGE and Western blotting
Brain, liver, and spleen homogenates (10%) prepared in lysis buffer were resolved by SDS-PGE and subjected to western blotting using specific antibodies as described in previous reports [30]. Immunoreactive bands were visualized by ECL detection system (Amersham Biosciences Inc.).
Prussian blue staining
Snap frozen liver and spleen sections (7mm) were immersed in
acidified potassium ferrocyanide solution (4%) for 20 min followed by washing with distilled water. Sections were then counterstained with 1% Neutral Red for 2 min and mounted.
Determination of plasma and tissue iron
In-gel iron estimation of protein bands and the iron content of liver and spleen homogenates were performed by Ferene-S staining essentially as described [14]. Serum iron, total iron binding capacity and transferrin saturation were determined by using an automated Ferene based detection method on a Dimension RXL chemistry analyzer (Dade Behring, Deerfield, Ill). The CBC and reticulocyte data was determined on a Sysmex XE-2100 hematology analyzer (Kobe, Japan). To detect hemoly-sis, urine dip-stick was performed on an Urisys 2400 urine analyzer (Roche Diagnostics, Indianapolis IN).
Transferrin binding assay
Tf binding sites in the brains of Wt and PrPKO mice were assessed by incubating 10mM thick brain sections prepared from
frozen samples essentially as described by Moos et al. [17]. In short, brain sections were pre-incubated with 0.2% bovine serum albumin in PBS for 30 min at 37uC in a humid atmosphere to wash off endogenous Tf, and incubated with FITC-Tf (5mg/ml) for 30 min at 37uC in a humid chamber. Another set of samples was pre-incubated with apo-transferrin (75 ng) for 10 min at room temperature followed by incubation with FITC-Tf as above. The sections were rinsed with PBS, mounted, and observed using a laser scanning confocal microscope (Bio-Rad MRC 600).
Estimation of iron export from peritoneal macrophages Peritoneal macrophages were isolated from Wt and PrPKOmice as described by Hanazawa et al. [18]. Following an overnight culture, adhered macrophages were stimulated with LPS (100 ng/ ml) for 24 h, serum starved for 1 h, and labeled with 59FeCl3 -citrate complex (1 mM sodium -citrate and 2mCi of 59FeCl3 in serum free DMEM for 4 h at 37uC. The molar ratio of citrate to iron was maintained at 100:1. Cell surface bound iron was washed and the cells were chased in complete medium for different time
periods. A 100ml aliquot of the medium was retrieved at each time point and counted in ac-counter. After 18 h the cells were lysed and cell associated59Fe was measured in ac-counter.
Statistical analysis
A minimum of 3 mice in each group were analyzed for all experiments, and the experiments were repeated at least 3 times. The results are expressed as mean6standard error of mean (SEM). Statistical analysis was done by unpaired Student’s t test when comparing Wt with PrPKOgroup. For comparing Wt, PrPKOand
littermates groups, one way ANOVA followed by Bonferroni multiple comparison post hoc test was done using GraphPad Prism software (Version 5.02, GraphPad Inc., San Diego, CA, USA). Differences were considered significant atp,0.05.
Author Contributions
Conceived and designed the experiments: NS. Performed the experiments: AS XL NS. Analyzed the data: AS HM NS. Contributed reagents/ materials/analysis tools: QK RP NS. Wrote the paper: NS. Prepared figures, wrote part of the paper: AS.
References
1. Roucou X, LeBlanc AC (2005) Cellular prion protein neuroprotective function: implications in prion diseases. J Mol Med 83: 3–11.
2. Caughey B, Baron GS (2006) Prions and their partners in crime. Nature 443: 803–810.
3. Bu¨eler H, Fischer M, Lang Y, Bluethmann H, Lipp HP, et al. (1992) Normal development and behavior of mice lacking the neuronal cell-surface PrP protein. Nature 356: 577–582.
4. Moore RC, Mastrangelo P, Bouzamondo E, Heinrich C, Legname G, et al. (2001) Doppel-induced cerebellar degeneration in transgenic mice. Proc Natl Acad Sci USA 98: 15288–15293.
5. Weissmann C, Flechsig E (2003) PrP knock-out and PrP transgenic mice in prion research. Br Med Bull 66: 43–60.
6. Criado JR, Sa´nchez-Alavez M, Conti B, Giacchino JL, Wills DN, et al. (2005) Mice devoid of prion protein have cognitive deficits that are rescued by reconstitution of PrP in neurons. Neurobiol Dis 19: 255–265.
7. Weise J, Sandau R, Schwarting S, Crome O, Wrede A, et al. (2006) Deletion of cellular prion protein results in reduced Akt activation, enhanced postischemic caspase-3 activation, and exacerbation of ischemic brain injury. Stroke 37: 1296–1300.
8. Steele AD, Emsley JG, Ozdinler PH, Lindquist S, Macklis JD (2006) Prion protein (PrPc) positively regulates neural precursor proliferation during developmental and adult mammalian neurogenesis. Proc Natl Acad Sci USA 103: 3416–3421.
9. Nazor KE, Seward T, Telling GC (2007) Motor behavioral and neuropatho-logical deficits in mice deficient for normal prion protein expression. Biochim Biophys Acta 1772: 645–653.
10. Prestori F, Rossi P, Bearzatto B, Laine´ J, Necchi D, et al. (2008) Altered Neuron Excitability and Synaptic Plasticity in the Cerebellar Granular Layer of Juvenile Prion Protein Knock-Out Mice with Impaired Motor Control. J Neurosci 28: 7091–7103.
11. Zhang CC, Steele AD, Lindquist S, Lodish HF (2006) Prion protein is expressed on long-term repopulating hematopoietic stem cells and is important for their self-renewal. Proc Natl Acad Sci USA 103: 2184–2189.
12. Zivny JH, Gelderman MP, Xu F, Piper J, Holada K, et al. (2008) Reduced erythroid cell and erythropoietin production in response to acute anemia in prion protein-deficient (Prnp2/2) mice. Blood Cells Mol Dis 40: 302–307. 13. Singh A, Mohan ML, Isaac AO, Luo X, Petrak J, et al. (2009) Prion protein
modulates cellular iron metabolism: Implications for prion disease pathogenesis. PLoS ONE 4: e4468.
14. Singh A, Isaac AO, Luo X, Mohan ML, Cohen ML, et al. (2009) Abnormal brain iron homeostasis in human and animal prion disorders. PLoS Pathog 5: e1000336.
15. Moos T, Morgan EH (2004) The metabolism of neuronal iron and its pathogenic role in neurological disease: review. Ann NY Acad Sci 1012: 14–26.
16. Moos T, Oates PS, Morgan EH (1998) Expression of the neuronal transferrin receptor is age dependent and susceptible to iron deficiency. J Comp Neurol 398: 420–430.
17. Chung MC (1985) A Specific iron stain for iron-binding proteins in polyacrylamide gels: application to transferrin and lactoferrin. Anal Biochem 148: 498–502.
18. Hanazawa S, Murakami Y, Hirose K, Amano S, Ohmori Y, et al. (1991)
Bacteroides(Porphyromonas)gingivalisfimbriae activate mouse peritoneal macro-phages and induce gene expression and production of interleukin-1. Infect Immun 59: 1972–1977.
19. Muckenthaler MU, Galy B, Hentze MW (2008) Systemic Iron Homeostasis and the Iron-Responsive Element/Iron-Regulatory Protein (IRE/IRP) Regulatory Network. Annu Rev Nutr 28: 197–213.
20. Sarnataro D, Paladino S, Campana V, Grassi J, Nitsch L, et al. (2002) PrPC is sorted to the basolateral membrane of epithelial cells independently of its association with rafts. Traffic 11: 810–821.
21. Morel E, Fouquet S, Strup-Perrot C, Thievend CP, Petit C, et al. (2008) The cellular prion protein PrP(c) is involved in the proliferation of epithelial cells and in the distribution of junction-associated proteins. PLoS ONE 3: e3000. 22. Peppriell JE, Edwards JA, Bannerman RM (1982) The Kinetics of Iron uptake
by isolated intestinal cells from normal mice and mice with sex-linked anemia. Blood 60: 635–641.
23. Miura T, Sasaki S, Toyama A, Takeuchi H (2005) Copper reduction by the octapeptide repeat region of prion protein: pH dependence and implications in cellular copper uptake. Biochemistry 44: 8712–8720.
24. Hentze MW, Muckenthaler MU, Andrews NC (2004) Balancing acts: molecular control of mammalian iron metabolism. Cell 117: 285–297.
25. Pantopoulos K (2004) Iron metabolism and the IRE/IRP regulatory system: an update. Ann NY Acad Sci 1012: 1–13.
26. MacKenzie EL, Iwasaki K, Tsuji Y (2008) Intracellular Iron Transport and Storage: From Molecular Mechanisms to Health Implications. Antioxid Redox Signal 10: 997–1030.
27. Burdo JR, Connor JR (2003) Brain iron uptake and homeostatic mechanisms: an overview. Biometals 16: 63–75.
28. Fischer M, Ru¨licke T, Raeber A, Sailer A, Moser M, et al. (1996) Prion protein (PrP) with amino-proximal deletions restoring susceptibility of PrP knockout mice to scrapie. EMBO J 15: 1255–1264.
29. Vyoral D, Petra´k J, Hradilek A (1998) Separation of cellular iron containing compounds by electrophoresis. Biol Trace Elem Res 61: 263–275.