www.the-cryosphere.net/10/2865/2016/ doi:10.5194/tc-10-2865-2016
© Author(s) 2016. CC Attribution 3.0 License.
Rock glaciers on the run – understanding rock glacier landform
evolution and recent changes from numerical flow modeling
Johann Müller, Andreas Vieli, and Isabelle Gärtner-Roer
Department of Geography, University of Zurich, Zurich, 8004, Switzerland Correspondence to:Johann Müller ([email protected])
Received: 4 February 2016 – Published in The Cryosphere Discuss.: 29 February 2016 Revised: 8 July 2016 – Accepted: 5 October 2016 – Published: 23 November 2016
Abstract.Rock glaciers are landforms that form as a result of creeping mountain permafrost which have received con-siderable attention concerning their dynamical and thermal changes. Observed changes in rock glacier motion on sea-sonal to decadal timescales have been linked to ground tem-perature variations and related changes in landform geome-tries interpreted as signs of degradation due to climate warm-ing. Despite the extensive kinematic and thermal monitoring of these creeping permafrost landforms, our understanding of the controlling factors remains limited and lacks robust quantitative models of rock glacier evolution in relation to their environmental setting.
Here, we use a holistic approach to analyze the current and long-term dynamical development of two rock glaciers in the Swiss Alps. Site-specific sedimentation and ice gener-ation rates are linked with an adapted numerical flow model for rock glaciers that couples the process chain from mate-rial deposition to rock glacier flow in order to reproduce ob-served rock glacier geometries and their general dynamics. Modeling experiments exploring the impact of variations in rock glacier temperature and sediment–ice supply show that these forcing processes are not sufficient to explain the cur-rently observed short-term geometrical changes derived from multitemporal digital terrain models at the two different rock glaciers. The modeling also shows that rock glacier thickness is dominantly controlled by slope and rheology while the ad-vance rates are mostly constrained by rates of sediment–ice supply. Furthermore, timescales of dynamical adjustment are found to be strongly linked to creep velocity. Overall, we pro-vide a useful modeling framework for a better understand-ing of the dynamical response and morphological changes of rock glaciers to changes in external forcing.
1 Introduction
a definition includes information on form, material and pro-cess and, therefore, the observable rock glacier characteris-tics are influenced by sediment and ice input, permafrost ditions and the geomorphological setting, which in turn con-trol rheology and landform geometry (Barsch, 1996). Very few studies have addressed rock glacier dynamics with such a holistic approach that includes rock wall retreat, sediment and ice dynamics, and climate variations to gain insight into the long-term evolution of rock glaciers (Olyphant, 1983; Frauenfelder et al., 2008) and model validation was ham-pered by restricted observational data.
Recent observations show signs of rock glacier destabi-lization such as acceleration, subsidence features and struc-tural disintegration (forming of tension cracks) at several rock glacier landforms in the Swiss Alps (Kääb et al., 2007; Roer et al., 2008b; Delaloye et al., 2011; Lambiel, 2011; Springman et al., 2013; PERMOS, 2013; Kenner et al., 2014; Bodin et al., 2015). These studies indicate that various factors can lead to such degradation but a common triggering for all the cases has not been identified. These potential factors are most likely connected to the complex combination of the lo-cal topography, the thermal state of the permafrost (climate-induced response), the existence and intrusion of liquid water and/or variations in the sedimentation regime affecting the sediment load during long-term landform evolution.
Numerous remote sensing techniques are available for ac-quiring data on permafrost creep (see Haeberli et al., 2006, and Kääb, 2008, for an extensive summary), high tain geomorphometry (Bishop et al., 2003) and high moun-tain sediment dynamics (Gärtner-Roer, 2012; Heckmann and Schwanghart, 2013; Müller et al., 2014a). This provides the necessary foundation for a holistic assessment strategy that includes the coupling of relevant landforms and processes and in which sediment supply rates can be quantified, ice vol-umes estimated and rock glacier rheologies derived (Frauen-felder et al., 2008; Gärtner-Roer and Nyenhuis, 2010).
Here we present such a holistic analysis approach to assess long-term rock glacier evolution and the impacts of varia-tions in temperature, sediment and ice supply on rock glacier geometry and movement. We apply a numerical flow model to two rock glaciers in the Swiss Alps with different topo-graphic, morphometric and rheological characteristics. The modeling is motivated by observations of topographic and kinematic changes for the two rock glaciers revealing signs of degradation as presented in this study. The aim of the mod-eling approach is to relate these changes to the long-term evolution and short-term adaptation of rock glacier systems to changing environmental factors and ultimately to a bet-ter understanding of the currently observed dominant con-trols of geomorphological changes. We thereby consider rock glaciers as an integral part of a coarse-debris cascading sys-tem in periglacial environments.
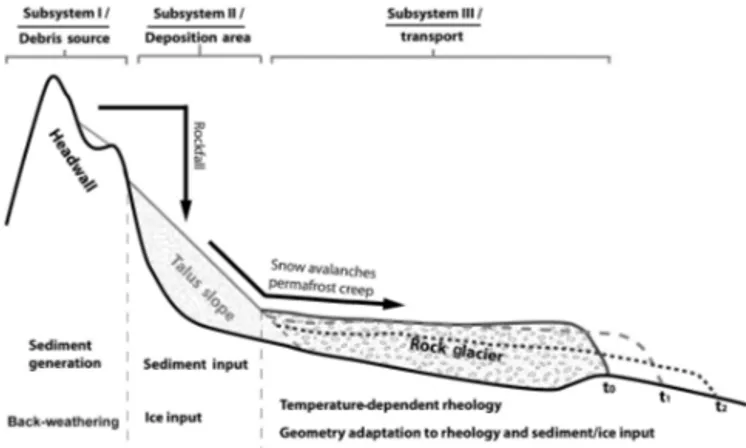
Figure 1.Conceptual model of the dynamic evolution of a rock glacier system (adapted from Fig. 1 in Müller et al., 2014a). Black arrows show the sediment transport.t0, t1 andt2 show the rock glacier surface geometries at different time steps resulting from variations in environmental factors such as warming and a decrease of sediment–ice input.
2 Conceptual approach to high mountain periglacial systems
The topographic evolution of the rock glacier landform relies on the production, transport and deposition of debris in the periglacial system and the generation and integration of sub-surface ice (Wahrhaftig and Cox, 1959; Barsch, 1996). The development of rock glaciers is therefore dependent upon the supply of debris from the source headwall(s) and the long-term preservation of an ice matrix or ice-core-inducing creep (Morris, 1981). Rock glaciers are also dynamic landforms that are influenced by the warming and melting of ice and changes in sediment input. The variations in environmen-tal factors translate into observable changes in geometry and kinematics, which can be interpreted as a sign of degradation and/or destabilization of these periglacial landforms (Roer et al., 2008b; Springman et al., 2013).
ge-ological structures, lithge-ological conditions, the presence of moisture as well as the characteristics and dynamics of cleft ice, which are in turn thermally controlled (Hasler et al., 2012). The progressive accumulation of sediments and ice on an inclined surface at the foot of the rock wall under permafrost conditions leads to permafrost creep and the de-velopment of a rock glacier (Barsch, 1992; Haeberli et al., 2006). The existence of ice and its properties within the sed-iment obviously plays an important role in controlling the rheology of the rock glacier and environmental changes in-fluence erosion and transport processes that result in topo-graphical and kinematic changes (White, 1973; Arenson et al., 2004; Haeberli et al., 2006).
We transfer this conceptual approach into a numerical flow model that integrates the whole debris process chain and cou-ples the different subsystems and related mass fluxes. It as-sumes a uniform sediment and ice input from the rock wall to an inclined surface, builds up a talus slope that is supersat-urated with ice and then starts to creep as a viscous nonlinear media similar to ice. This rheological assumption has repeat-edly been used to assess rock glacier kinematics (Wahrhaftig and Cox, 1959; Olyphant, 1983; Whalley and Martin, 1992; Barsch, 1996; Kääb et al., 2007; Frauenfelder et al., 2008). A few studies (e.g., Olyphant, 1983; Wagner 1992; Leysinger Vieli and Gudmundsson, 2003; Frehner et al., 2015) have demonstrated that such a rheology can in principal be used in a numerical flow model for rock glaciers.
3 Recent observations of rock glacier change
The modeling work in this study is motivated by detailed observations of geometric changes of two rock glacier sys-tems, both in Switzerland. We present in this section compre-hensive new datasets of the two landforms: the well-studied Murtèl rock glacier in the Engadine and the rock glacier Huhh1 in the Turtmann valley. Both show changes in surface geometry and kinematic behavior but have distinctly differ-ent landform characteristics (see Table 1 for an overview). In order to assess the controlling mechanisms of rock glacier evolution and potential degradation we use a “backward” ap-proach: we quantify and discuss distinct observed changes in surface geometry and kinematics of the two rock glaciers, propose potential controlling forcing factors (sediment and ice input as well as ground temperature) and then assess these observations and related forcings with a numerical creep model.
Table 1.Characteristics of the two selected rock glaciers (excluding their talus slopes). The data sources are cited in the text.
Murtèl Huhh1
rock glacier rock glacier
Average thickness 30 m 12 m
Length 280 m 310 m
Slope 12◦ 27◦
Age ∼5000–6000 a ∼600 a
Hor. velocity 0.06–0.13 m a−1 0.75–1.55 m a−1 Headwall area 74 687.1 m2 82 781.6 m2 Depositing area 45 931 m2 32 356 m2
3.1 Murtèl rock glacier, upper Engadine
The first rock glacier site is the well-studied Murtèl (Hoelzle et al., 2002; Haeberli et al., 2006; Springman et al., 2012) sit-uated below the northern face of Piz Corvatsch (3300 m a.s.l.) in the upper Engadine, in the southeastern part of Switzer-land (UTM, 563 131, 5 142 001; zone 32T). The lithology mainly consists of granite and granodiorite. The density of the in situ rock types is based on values given in the liter-ature with a density of 2650–2750 kg m−3 for granite and 2700–2800 kg m−3 for granodiorite (Tarbuck et al., 2011), and studies on weathering at this site have shown back-weathering rates of 2 mm a−1(Müller et al., 2014a). Murtèl is one of the best investigated rock glaciers and observations from this permafrost site have been discussed in great de-tail (see summary in Haeberli et al., 1998). As part of the PERMOS network (Permafrost Monitoring Switzerland), pa-rameters such as borehole temperatures, ground surface tem-peratures (GSTs) and horizontal velocity have been mon-itored since 1987 (Vonder Mühll et al., 2008). The bore-hole data have revealed a layered internal structure with a shear horizon at 32 m depth where almost all of the defor-mation takes place (Arenson et al., 2002; Springman et al., 2012). Attempts to determine the age of this rock glacier (Haeberli et al., 1999; Laustela et al., 2003) obtained an age of 5000 to 6000 a as a minimum value (Haeberli et al., 2003). These values were calculated from present-day sur-face velocity fields assuming constant environmental condi-tions over the rock glacier development (Kääb and Vollmer, 2000; Frauenfelder and Kääb, 2000; Haeberli et al., 2003). The rock glacier is characterized by rather slow creep ve-locity (0.06–0.13 m a−1) and is considered a thick and ice-rich landform with an average volumetric ice content of 60 % (Haeberli et al., 1998; Arenson et al., 2002).
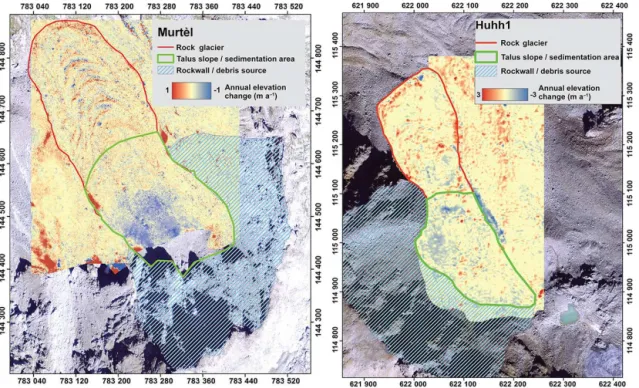
Figure 2.The annual elevation change of the two rock glacier systems for Murtèl (period 1996–2007) and Huhh1 (period 2001–2012). The annual rates are derived from multisensoral and multitemporal remote sensing products (Table 2). For a detailed depiction of the structure of the landforms see Supplement Fig. S1, where the orthophoto is shown without the elevation change.
and schists and based on this lithology rather constant back-weathering rates of 2 mm a−1 are expected (Glade, 2005; Krautblatter et al., 2012; Müller et al., 2014a). The valley stretches from 2400 to 3278 m a.s.l and is characterized by steep rock walls, talus cones, a glacier, several moraines of different ages and multiple active and inactive rock glaciers (Roer and Nyenhuis, 2007). The focus within this study lies on the rock glacier Huhh1, which can be considered a thin, moderately fast moving rock glacier (see Table 1). This site is also part of the PERMOS network and has undergone several scientific assessments (Rasemann, 2003; Roer, 2005; Nyen-huis et al., 2005). There is no direct subsurface information available but Gärtner-Roer (2012) used a semi-quantitative approach to derive the rock glacier thickness and sediment storage assuming an ice volume of 50–70 %. The age of the landform is estimated at 500–600 a using the same approach as Haeberli et al. (2003) and Kääb and Vollmer (2000), where the current velocity fields are assumed to be constant over the rock glacier evolution time. Therefore the age estimates can be seen as minimum ages.
3.3 Observations of rock glacier dynamics
Complementary to the PERMOS-related kinematic monitor-ing, we used a combination of remote sensing and terrestrial surveying methods to derive multitemporal elevation and dis-placement data in order to assess changes in geometry and creep.
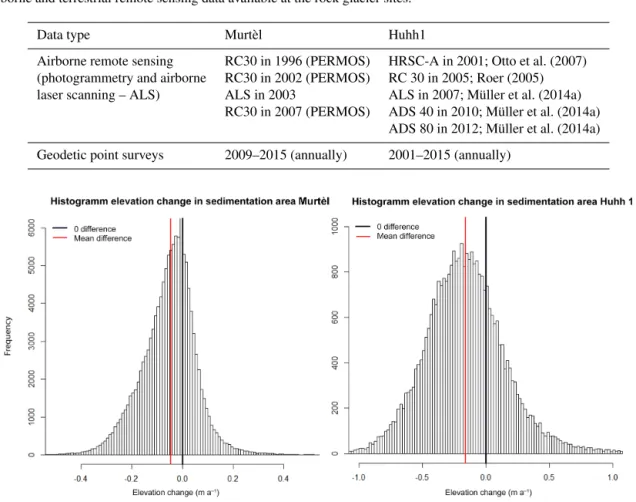
Table 2.Airborne and terrestrial remote sensing data available at the rock glacier sites.
Data type Murtèl Huhh1
Airborne remote sensing RC30 in 1996 (PERMOS) HRSC-A in 2001; Otto et al. (2007) (photogrammetry and airborne RC30 in 2002 (PERMOS) RC 30 in 2005; Roer (2005) laser scanning – ALS) ALS in 2003 ALS in 2007; Müller et al. (2014a)
RC30 in 2007 (PERMOS) ADS 40 in 2010; Müller et al. (2014a) ADS 80 in 2012; Müller et al. (2014a)
Geodetic point surveys 2009–2015 (annually) 2001–2015 (annually)
Figure 3.The frequency distribution of annual vertical surface change (m a−1) from DEM differencing in the talus slope–sedimentation area of the two rock glacier systems. Both systems show negative mean values (red lines). The black line refers to 0 m a−1difference.
Additionally, kinematic data are available for both rock glaciers from yearly terrestrial geodetic surveys of approx-imately 20 points as described in PERMOS (2013) and Roer (2005). Horizontal and vertical changes are quantified annually with an accuracy of 1–2 cm. The vertical elevation change is obtained by subtracting the surface-parallel com-ponent of the vertical displacement from the total measured vertical displacement.
Based on the above DEMs, new elevation change maps have been derived for both rock glaciers and the subsys-tem units of the main rock glacier body and contributing talus slope have been identified (Fig. 2). This analysis (over decadal time periods) showed distinct subsidence features of different magnitudes on the entire rock glacier, most pro-nounced in the deposition area (outline with green in Fig. 2) of the rock glacier. A more detailed assessment of the sub-sidence shows a general lowering of the entire surface of the rock glacier system of −0.02 m a−1for the Murtèl rock glacier and −0.09 m a−1 for the Huhh1 rock glacier. The spatial analysis of the subsidence phenomenon depicts the strongest signal of annual lowering in the deposition area (talus slope–sedimentation area; see Fig. 3) with an overall
average annual subsidence of −0.04 m a−1 for the Murtèl
rock glacier and −0.16 m a−1 for the Huhh1 rock glacier.
Such subsidence features, especially in the deposition area, have been interpreted as signs of permafrost degradation (Roer et al., 2008a; Springman et al., 2013; Bodin et al., 2015) and are assessed by the rock glacier evolution model in Sect. 6.2.4. These observed subsidence rates are calcu-lated considering the uncertainties resulting from the DEM differencing (see Müller et al., 2014b). Additional vertical displacement data from terrestrial surveys conducted from 2001/2009 to 2015 corrected for slope parallel movement agree with the results from the DEM differencing.
Theoretically, subsidence features can result from surface lowering by ice melt (Phillips et al., 2009), reduced ice and sediment input, acceleration of the entire landform (poten-tially thermally induced, leading to a “creeping away” and thinning of the rock glacier from its feeding area) or, most likely, a combination of the above (Roer et al., 2005b).
its sediment source and therefore not in an equilibrium state with the current sedimentation and/or thermal state of the system.
4 Rock glacier evolution – modeling approach
We present here a quantitative rock glacier evolution model-ing approach that is based on the conservation of mass and includes the entire debris process chain in high mountain en-vironments (see Fig. 1).
4.1 Geomorphological setting
In order to initialize and evaluate the numerical model, it is necessary to derive geometric information about the head-wall, talus slope and rock glacier. Therefore, the two rock glacier sites have been analyzed according to the concept in-troduced in Sect. 2 for their along flow geometry and the quantification of sediment input and sediment deposition. Geomorphological mapping in the field as well as interpreta-tion of DEMs and orthophotos are used to identify the con-tributing headwall areas, deposition areas and rock glacier landforms (see Fig. 2). Surface features (e.g., slope, sub-strate) as well as velocity fields are further used to delimit the different subsystems (Kääb et al., 1998; Roer et al., 2005a).
The DEMs served as basis for the geomorphometric anal-yses to determine spatial dimensions, slope and surface ge-ometry of the periglacial high mountain systems.
4.2 Rock glacier creep modeling approach
A 1-D time-dependent numerical flow model is used to sim-ulate the evolution of the rock glacier surface, length and creep velocity along the center flow line based on a given sediment–ice input and rock glacier rheology. In this study we are not aiming to reproduce the exact evolution or small-scale geometric features of the two chosen real-world rock glaciers, but rather use the model to simulate the basic be-havior of a rock glacier body creeping down a slope and in-vestigate the first-order dynamic response of the geometry on changing external factors such as temperature and sediment supply. Specifically, we will investigate potential causes for the observed surface geometry changes (subsidence, front advance and velocity variations) as set out above (Sect. 3.3). 4.2.1 Rock glacier creep
For our study we therefore reduce the rheology of the rock glacier to a body of ice-bonded sediment that deforms and creeps like a nonlinear viscous material under the influence of gravity, as proposed already in 1959 by Wahrhaftig and Cox (1959) and applied similarly by Olyphant (1983) and Frauenfelder et al. (2008). This rheology can be described by a Glen type flow law (Glen, 1955) as typically used for glacier ice (Cuffey and Paterson, 2010) which relates the
strain rateε˙nonlinearly to the stressτ: ˙
ε∝Aτn, (1)
wheren is a flow law exponent that is typically between 2 and 3 for frozen material (Paterson, 2010) andAthe rate fac-tor describing the softness of the rock glacier material. Such a constitutive relationship has been applied and discussed in other studies on rock glacier creep (Olyphant, 1983; Whalley and Martin, 1992; Whalley and Azizi, 1994; Barsch, 1996; Azizi and Whalley, 1996; Kääb et al., 2007; Frauenfelder et al., 2008) and is further supported by results from borehole measurements on real-world rock glaciers and shear exper-iments in the laboratory on rock glacier material (including Murtèl rock glacier; Arenson et al., 2002; Kääb and Weber, 2004; Arenson and Springman, 2005; Frehner et al., 2015).
For simplification we assume the rock glacier material to be a homogenous mixture of ice and sediment, meaning the rheological parameters such as the rate factorA, flow expo-nentn and rock glacier material density ρr do not change
within the rock glacier body. This means that we exclude any internal ice melting and consider the active layer rheo-logically in the same way as the rock glacier material. How-ever, from boreholes we know that the rheology within rock glaciers is variable with depth (Haeberli et al., 1998) and typically enhanced deformation in ice-rich shearing zones are observed, for example, in the case of the Murtèl rock glacier. Such shearing zones are typically near the bottom of the moving body of the rock glacier, where shear stresses are highest and temperatures the warmest, and thus they domi-nate the creep process. Consequently, potential variations in rheology in the material above are not substantially chang-ing the nonlinear viscous creep behavior. The modeled flow is calibrated with observed surface velocities (see Sect. 4.3) and is dominated by the rheology of the material near the base and thus our modeling implicitly includes the shear zone in its vertically averaged rheology. In addition, the rheol-ogy within rock glaciers is generally poorly known and the assumption of a uniform rheology is therefore justified for studying the first-order controls of geometric changes.
We further simplify the problem to the case of an infi-nite sheet of uniform thickness that creeps down an inclined plane (Cuffey and Paterson, 2010, also known as the shallow ice approximation in glaciology) and thereby neglect longi-tudinal stress gradients. As our focus is the evolution of the surface and not the detailed stress field within the landform, according to Leysinger Vieli and Gudmundsson (2004) this approximation is justified even for relatively high length to thickness ratios such as occurring for rock glaciers. For this 2-S case along a center flow line, the vertical strain rateτ˙xz
is directly related to the shear stressτxzthrough ˙
τxz=A·τxzn, (2)
given by the local surface slope ∂x∂s and ice depthdz:
τxz=ρrg ∂s
∂xdz, (3)
where ∂s∂x is the surface slope.
Integration of Eq. (2) over the rock glacier thickness re-sults in a surface flow speedusfrom deformation of the rock
glacier material of us=
2A n+1
ρrg
∂s
∂x n
hn+1 (4)
and accordingly a depth-averaged horizontal flow speeduof u= 2A
n+2·
ρg∂s ∂x
n
hn+1. (5)
Although this equation is in its form identical to the case of glacier ice (Cuffey and Paterson, 2010), for rock glaciers the flow exponent n and the rate factor A (referring to the material softness) are, due to the presence of debris and wa-ter within the ice, not necessarily the same (Moore, 2014) and may in reality thereby also vary with depth. From bore-holes and laboratory experiment flow law exponents of rock glaciers have been found between n=1.9 and 4.5 (mean n=2.72) and increase linearly with volumetric ice content ciceof the sediment (Arenson and Springman, 2005). For our
relatively high ice contents (60 %) a value of n=3 equiva-lent to the case of ice seems justified and has been used in earlier studies of Leysinger Vieli and Gudmundsson (2003) and Frauenfelder et al. (2008).
The rate factorAis estimated from observed surface flow speeds by inverting Eq. (3) for Abut is known to be influ-enced by the material temperature but also by other factors such as the moisture and debris content (Cuffey and Peter-son, 2010). Moisture content is known to vary with time and temperature (Moore, 2014; Monnier and Kinnard, 2016) but we do not explicitly include this in our model as such changes are poorly constrained. The temperature-related ef-fect from moisture is, however, implicitly included by writ-ing the rate factor of the rock glacier material as a product of the temperature-dependent part A∗(T) and a scaling factor fAaccounting for the influence of the debris:
A=A∗(T )·fA. (6)
This approach is in agreement with known rheological in-vestigations (Paterson and Budd, 1982; Arenson and Spring-man, 2005) and allows including a temperature forcing in our modeling experiments. For the temperature-dependent part we use two approaches. Firstly, as done in Kääb et al. (2007) we use the dependence on the temperature of pure ice, for whichA∗(T )increases exponentially with temperature (see Fig. 4; Paterson and Budd, 1982).
Secondly, and probably more realistic for rock glaciers, we follow the description based on shearing experiments of
Figure 4.Temperature dependence of the rate factor relative to the rate factor at a reference temperature of−1.5◦C as derived for pure ice (Paterson and Budd, 1982) and for rock glacier material (Aren-son and Springman 2005).
frozen debris material of Arenson (2005) which is given by A∗(T )∝ 2
T+1 (7)
for temperatures between−1 and−4◦C. Note that this sec-ond version is at warm temperatures above −2◦C, as ex-pected for our two cases, more sensitive to temperature warming (Fig. 4). For both approaches the temperature de-pendence is applied at a reference temperature which refers approximately to the real mean annual temperature within the rock glacier body.
4.2.2 Thickness evolution
The evolution of rock glacier thicknessh and rock glacier surface elevations along the central flow line is calculated from the principle of mass conservation, which takes for the 1-D representation the following form (Oerlemans, 2001): ∂h
∂t =ar− 1 w·
∂uhw
∂x , (8)
wheret is the time, ar is the rate of rock glacier material
accumulation or removal at the surface (> 0 for accumula-tion; in m a−1),wthe rock glacier width anduthe horizontal and vertically averaged flow speed. The geometry of the rock glacier bed transverse to flow is accounted for by assuming a parabolic valley that is prescribed and here assumed to be uniform along the flow. This allows the width of the rock glacier to vary with changing thickness; however, the effect of side drag is not explicitly included but it is implicitly con-tained in the scaling factorfA of the rate factor, which is
calibrated on surface displacements.
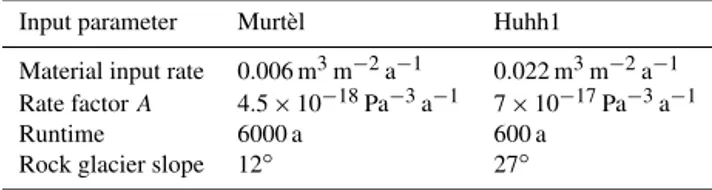
Table 3.Specific model input parameters for the rock glaciers. The sediment–ice input describes the volume of debris deposited on the accumulation area per year. The rate factorAis derived from Eq. (11) and the runtime of each rock glacier model is selected due to its approximated age (see Sect. 3).
Input parameter Murtèl Huhh1
Material input rate 0.006 m3m−2a−1 0.022 m3m−2a−1 Rate factorA 4.5×10⁻¹⁸Pa−3a−1 7×10⁻¹⁷Pa−3a−1
Runtime 6000 a 600 a
Rock glacier slope 12◦ 27◦
along the center flow line. Using a standard implicit finite-difference scheme (Oerlemans, 2001) the surface evolution Eq. (8) is solved at each time step and for all grid points from the depth-averaged material fluxq=u·h·wand the material inputarat the rock glacier surface.
4.3 Model input and calibration 4.3.1 Model geometry
Approximate bedrock topographies are derived for both rock glaciers from the DEMs and geomorphic mapping (Sect. 4.1) and we assume the bedrock to be roughly parallel to the rock glacier surface. The shapes of the rock glacier beds are ap-proximated to two sections of constant slope that are repre-sentative of the two respective rock glaciers. For both rock glaciers we mapped the first 150 m of the distance along flow as deposition area and apply there a spatially uniform mate-rial accumulation rate at the specified sedimentation rate and ice content, whereas further downstream no mass is added or lost at the surface. In the talus slope, where the material is ac-cumulated, we use a slope of 37◦(which is slightly below the angle of repose for unconsolidated talus slope material; Car-son, 1977), which is steeper than on the rock glacier part (12◦ for Murtèl and 27◦for Huhh1, see Table 4). The respective dimensions and slopes for the two rock glaciers are presented in detail in Table 1 and visualized in Fig. 5.
4.3.2 Material input
The rock glacier material input ratear at the surface is
as-sumed to be positive and uniform on the talus slope and, if not mentioned otherwise, set to zero on the surface of the main rock glacier body. The latter means that in general no sediment or ice is lost or gained at the surface of the main rock glacier. The rock glacier material input at the surface is estimated from the sediment input from the headwall to the talus slope and its respective ice content, which is as-sumed to be constant in time. The total amount of sediment produced at the headwall is calculated from back-weathering rate and headwall area and is distributed equally over the de-position area (talus slope–accumulation area). Based on in situ measurements (Müller et al., 2014a) and previous
stud-ies (Glade, 2005; Krautblatter, 2012), a back-weathering rate of 2 mm a−1is used, resulting in an annual sediment input over the entire talus slope of 0.006 m3m−2 for Murtèl and 0.022 m3m−2 for Huhh1. Together with the ice content of the material the accumulation rate of rock glacier material (sediment–ice mixture) is then calculated:
ar= as (1−ci)
. (9)
Based on field studies (Hoelzle et al., 2002) and previous ap-proaches (Gärtner-Roer, 2012) we use an estimated ice con-tentciof 60 % for both rock glaciers, which results in a rock
glacier material input rate that is 2.5 times higher than the pure sediment input rate.
4.3.3 Rock glacier density
We estimate the density of the rock glacier material (ρr)
from the percentage ice content (ci) and from the
respec-tive densities of ice (ρi=910 kg m−3) and the debris
mate-rial (ρd=2700 kg m−3), which we assume stay constant in
space and time:
ρr=(1−ci)·ρd−ci·ρi. (10)
4.3.4 Estimating the rate factorA
Solving the equation describing surface ice flow from creep of a viscous material (Eq. 4) for the rate factorA, we obtain A=A∗(T )·fA=
(n+1)us
2hnτ d
= (n+1)us 2hn+1ρ
rg∂x∂s
. (11)
Using observed surface flow speed data (us) we can then
estimate the corresponding rate factorA(respectivefA for
a given reference temperature and temperature dependence model) for both rock glaciers. These rate factor values are substantially lower than the values known for pure ice at sim-ilar temperatures (Paterson and Budd, 1982;−1.5◦C), which probably reflects enhanced mechanical resistance from the sediment within the ice (Arenson and Springman, 2005).
5 Model experiments
The model is applied to the two selected rock glacier systems using the landform-specific input parameters in Table 3 and the simplified geometries described in Sect. 4.
5.1 Rock glacier buildup
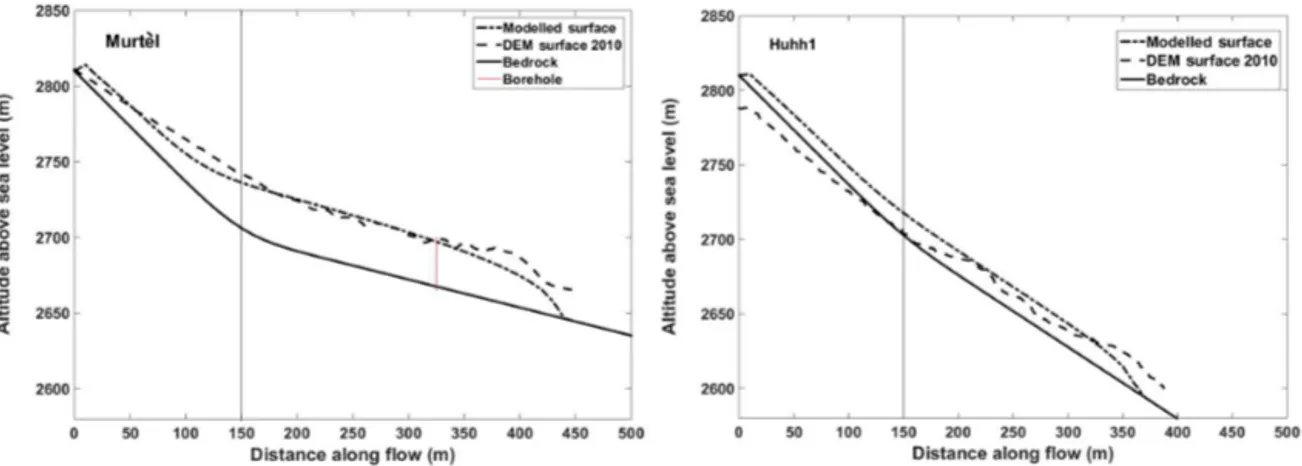
Figure 5.Observed and modeled rock glacier geometry after buildup. The along flow bed topography used in the model and the modeled and observed (from DEMs) rock glacier surfaces are shown. The vertical fine black lines mark the boundary between the deposition area (talus slope) and the main rock glacier lobe. Note that the model cannot replicate the exact geometry of the landform due to the various simplifications but shows good agreement in length and thickness of the rock glacier main body.
Table 4.Comparison of the observed (obs.) and modeled (mod.) rock glacier thickness and velocity for Murtèl and Huhh1 after 6000 years and 600 years, respectively.
Murtèl obs. Murtèl mod. Huhh1 obs. Huhh1 mod.
Length 280 m 300 m 310 m 240 m
Thickness 30 m 28 m 12 m 16 m
Horizontal velocity 0.06–0.13 m a−1 0.06–0.09 m a−1 0.75–1.55 m a−1 0.63–0.79 m a−1
and therefore advances once it is thick enough and the shear stress high enough, which occurs roughly after 600 a for Murtèl and 150 a for Huhh1. A rock glacier body is then gen-erated to a characteristic thickness while the front keeps ad-vancing at a roughly constant rate. This continuing advance is a direct result of constantly adding mass at the top while no mass is removed through melting. Further, the growth and geometry change of the rock glacier landform mainly occurs through moving the rock glacier forward at the front. The modeled advance rate is slightly below the surface speed of the main rock glacier body. After a run time of 6000 a for the Murtèl rock glacier and 600 a for Huhh1, which correspond to the ages of the landforms estimated earlier, we obtain ge-ometries (lengths and thicknesses) that are very close to ones currently observed (Fig. 5 and Table 4). The actual furrow-ridge structure of the landform cannot be replicated (Fig. 5) due to model design but the overall geometry is well repro-duced.
The modeled surface velocities on the main rock glacier lobes range between 0.06 and 0.09 m a−1 for Murtèl and between 0.63 and 0.79 m a−1 at Huhh1, which is in good agreement with the observed values from long-term kine-matic monitoring (see Table 1).
Note that the bedrock topography of the talus slope and rock glacier is assumed to be of constant inclination. We de-fined the first 150 m of slope as an idealized talus slope with
an inclination of 37◦, which we assumed to be the angle of repose for such unsorted and unconsolidated blocky mate-rial (Carson, 1977). The general inclination of the bedrock topography (see Table 1) below the rock glacier is derived from DEMs where we assume the bedrock to be parallel to the rock glacier surface (see Table 1). Figure 5 depicts the ob-served rock glacier front shapes and positions slightly differ-ently from the modeled ones as the real bedrock geometries of the rock glaciers are more complex than the assumed uni-form mountain slopes. Also, the idealized talus slopes differ from the observed geometries due to abovementioned sim-plification.
5.2 Perturbation modeling experiments
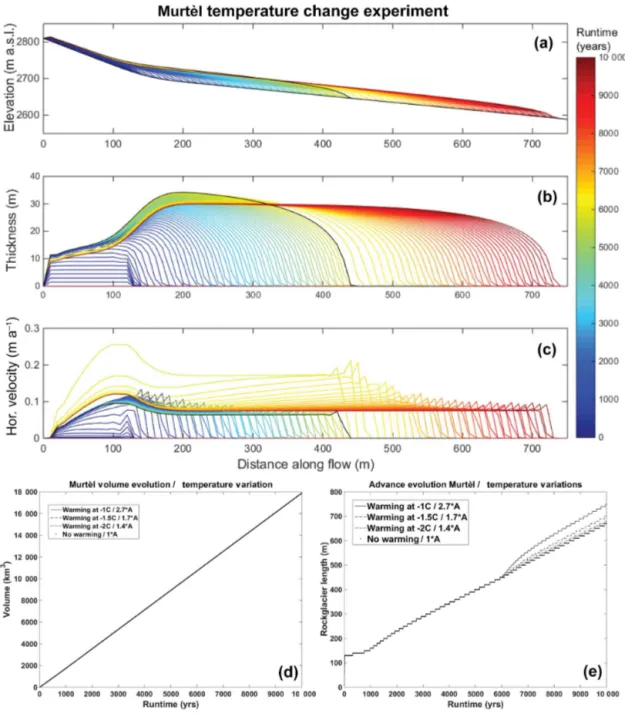
Figure 6.Modeled evolution of surface geometry(a), absolute thickness(b), horizontal velocity(c)along the central flow line, terminus advance(d)and volume evolution(e)for the rock glacier buildup (first 6000 a runtime) and for the successive temperature perturbation experiment (temperature increase of 1◦C, with−1.5◦C reference temperature). The black line shows the state of the system before the temperature step change at 6000 a. The lines are plotted at 100 a time intervals.
production of sediment and incorporation of subsurface ice, but quantification of the latter is highly uncertain (Gruber, 2004; Fischer et al., 2010; Ravanel and Deline, 2011; Schnei-der et al., 2012). We therefore run varying scenarios for the sediment and ice input with the zero sediment supply being at the extreme end of the spectrum.
For the temperature experiments the chosen step temper-ature increase of 1◦C in the rock glacier depicts a potential warming scenario which roughly refers to a 2◦C warming in GST for a fixed position at the permafrost base. The 1◦C
subsurface warming is also consistent with current and ex-pected future subsurface warming trends based on borehole observations (PERMOS, 2013) and modeling results in the next 50 a in the Swiss Alps (Marmy et al., 2015).
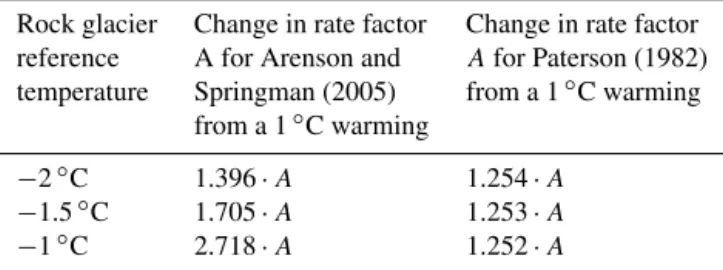
Table 5.Multiplicative increase in rate factorAfrom a 1◦C rock glacier warming for the different temperature relations of Arenson and Springman (2005) and Paterson and Budd (1982) and varying rock glacier reference temperatures.
Rock glacier Change in rate factor Change in rate factor reference A for Arenson and Afor Paterson (1982) temperature Springman (2005) from a 1◦C warming
from a 1◦C warming
−2◦C 1.396·A 1.254·A
−1.5◦C 1.705·A 1.253·A
−1◦C 2.718·A 1.252·A
dependence on rock glacier temperature and increases only by factor 1.25 with a 1◦C temperature increase. If not indi-cated otherwise, we use the Arenson and Springman (2005) relation in the temperature warming experiments.
The results for the simple temperature and sediment exper-iments are presented in the following section only for Murtèl rock glacier but the results are qualitatively similar (although of higher absolute magnitude) for the Huhh1 rock glacier. The more complex and realistic experiments combining vari-ations in temperature and sediment supply are presented for both rock glaciers later in Sect. 5.2.3.
5.2.1 Temperature experiment
In a first experiment, a step temperature increase of the entire rock glacier body of 1◦C is applied after rock glacier buildup (at 6000 a), while the sediment supply is held constant. The reference temperature of the rock glacier is set at −1.5◦C which results in a rate factor increase by a factor of 1.7.
Figure 6 shows the modeled response of the surface ge-ometry, landform thickness and horizontal surface velocity of the Murtèl rock glacier along the central flow line. For ref-erence, the black line in Fig. 6 shows the state of the rock glacier just after buildup (6000 a), immediately before the temperature step change is introduced. The increase in the rate factor causes an immediate speedup in horizontal flow of the entire landform by a factor of about 2 (Fig. 6c, yel-low lines), which then decays with time (orange to red lines). As a result of the enhanced mass transport, the landform also shows a distinct thinning of up to 0.02 m a−1 in the upper part of the rock glacier and on the talus slope (Fig. 6b). At the front the rock glacier continues to thicken and conse-quently advance, but at accelerated rates as a consequence of enhanced flow speeds (Fig. 6d). With time, the creep ve-locity, advance rate and thinning reduce and approach sta-ble values again after about 1000 a for Murtèl. We term in the following the time it takes for this readjustment the “ad-justment time”. This new state after dynamic ad“ad-justment is, apart from the advancing front, stable and characterized by a slightly faster creep velocity and a thinner rock glacier body in order to transport the constant material supply from
up-stream. Consistent with the creep velocity, the advance rate is also slightly enhanced (Fig. 6d) whereas the volume grows at a constant rate throughout the simulation, reflecting again the constant material supply and mass conservation (Fig. 6e). Additional model simulations for other reference temper-atures of the rock glacier of−1 and−2◦C, show qualita-tively very similar results but the absolute rates of change scale proportionally to the enhancement factors in the rate factor given in Table 5. The same experiments for the Huhh1 rock glacier show quantitatively similar responses which are of higher absolute magnitude and adjust within 100 a to a new quasi-stable state also much faster.
5.2.2 Sediment experiment
In a second set of experiments, the influence of variations in sediment and ice supply is investigated by varying the material inputar but keeping the rock glacier temperature
constant. Since there are no empirical data on the impact of temperature increase on sedimentation and ice accumulation rates, a range of changes in material supply rates has been explored.
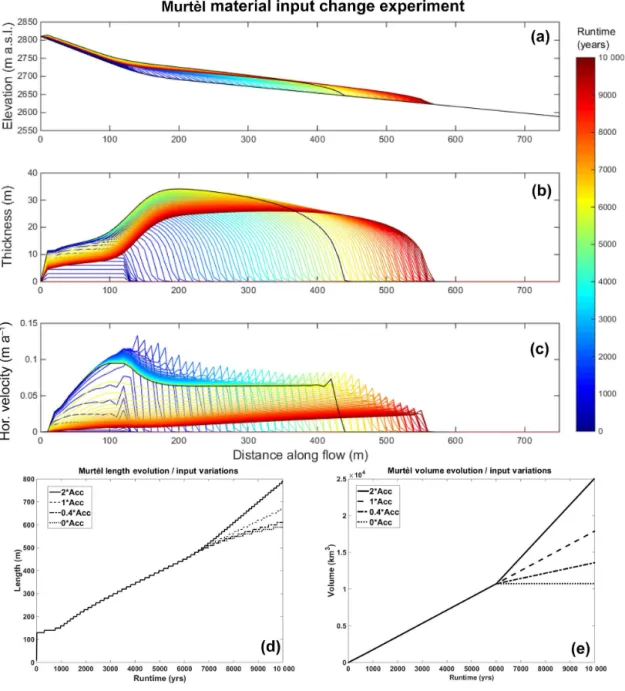
Figure 7 shows the modeled response for an extreme ex-ample in which the ice and sediment input is completely switched off after rock glacier buildup (at 6000 a). The re-sults show that the rock glacier continues to creep downs-lope and advance but with reduced velocities that start to de-crease from upstream. This slowdown is related to a thin-ning, reduced slope and driving stresses in the upper part of the rock glacier as the downstream flowing mass is no longer fully replaced by accumulation of material on the talus slope. The rock glacier body essentially creeps downstream without any mass added or removed, which is reflected well in the constant volume with time (dotted line in Fig. 7e). The ad-vance rates thereby decrease at relatively low rates. The up-per parts of the rock glacier react immediately to the change of material input as this is where the sedimentation is taking place. Note that the maximal thinning rates are only as high as the former material accumulation rate (in case of Murtèl 0.006 m a−1, for Huhh1 0.022 m a−1).
Experiments with different perturbations in material input rates show qualitatively similar changes but of reduced mag-nitude (Supplement Figs. S2 to S13) and are also evident in differing advance and volume growth rates (Fig. 7d and e). 5.2.3 Combined experiment
As atmospheric warming is expected to influence both rock glacier temperatures as well as ice and sediment production, we thus perform a third set of experiments in which we com-bine the above perturbations.
Figure 7.Modeled evolution of surface geometry(a), absolute thickness(b), horizontal velocity(c)along the central flow line, terminus advance(d)and volume evolution(e)for Murtèl rock glacier when the material input is switched off at 6000 a, after the rock glacier buildup (−1.5◦C rock glacier temperature). The black line shows the state of the system before the switch-off of material supply at 6000 a. The lines are plotted at 100 a time intervals.
scenarios concerning the material input (see Table 6). The corresponding results are shown in the Supplement.
In Figs. 8 and 9 we show detailed results for both Murtèl and Huhh1 rock glacier for one representative perturbation experiment in which we used a reference rock glacier tem-perature of−1.5◦C, an increase in temperature of 1◦C (cor-responding to a rate factor increase by factor 1.7; Table 5) and a decrease of material input to 40 % of the original value. We assume that warming and subsequent thawing of permafrost in rock walls will lead to an increase in sediment production in the short term but is expected to attenuate in the long term
(Krautblatter et al., 2013). Therefore we keep the material input from the rock wall constant but reduce the ice contri-bution to the total material influx.
Figure 8.Modeled evolution of absolute thickness(a)and horizontal velocities(b)of the Murtèl rock glacier introducing a 1◦C temperature increase (1.7 times increase in rate factor) and a reduction in material input to 40 % after the rock glacier buildup (6000 a, black line). The black lines in all plots depict the state of the rock glacier as shown in Fig. 5 before the perturbations were introduced. The lines are plotted at 100 a time steps.
Figure 9.The evolution of absolute thickness(a)and horizontal velocities(b)of the Huhh1 rock glacier introducing a 1◦C temperature increase (1.7 times increase in rate factor) and 40 % of the initial material input after rock glacier buildup (600 a, black line). The black lines in all plots depict the state of the rock glacier as shown in Fig. 6 before the perturbations were introduced. The lines are plotted in 10 a steps.
Murtèl and 6 cm a−1for Huhh1 (see Fig. 11). A new stable geometry with advancing front is successively approached, again within adjustment times of roughly 1000 and 100 a for Murtèl and Huhh1, respectively. The final thickness and velocities of the main rock glacier body are, however, very close to the initial values.
Figure 10 shows the more detailed temporal evolution of geometry and creep velocity at three distinct positions on both rock glaciers. The rock glaciers keep advancing throughout the simulation, with initially slightly enhanced rates caused by the temperature increase and a successive slight slowing down caused by the reduced material accu-mulation rates. The adjustment times of Murtèl rock glacier
are much lower compared to Huhh1, which was also shown by the simple perturbation experiments.
The additional combined experiments with a 1◦C temper-ature increase but variable reference tempertemper-atures and vary-ing sediment supply rates show qualitatively similar geomet-ric and kinematic responses (see Supplement Figs. S1–S24). 5.2.4 Subsidence
Figure 10.Rock glacier evolution of thickness, horizontal velocity, advance and velocity after a 1◦C temperature increase and 40 % decrease in material input after rock glacier buildup. The dynamic evolution is shown for three points along the central flow line at 160, 200 and 400 m. The rock glacier is assumed to have an initial temperature of−1.5◦C
Figure 11.Modeled maximum annual subsidence rates in the deposition area of the rock glaciers in relation to the reference temperature and change in material input and for the two temperature models of Arenson and Springman (2005; black lines) and Paterson and Budd (1982; grey lines) immediately after a 1◦C temperature step increase. Note the different scales for subsidence for the two rock glaciers.
one of the observable quantities from repeated DEM analysis on real rock glaciers, we summarized the results in terms of maximum thinning rates in Fig. 11.
For the Paterson and Budd (1982) temperature relation, thinning rates are almost independent of the reference rock glacier temperature, but they increase with a reduction in ma-terial supply and reach maximum thinning rates of 1.8 and 6.5 cm a−1for Murtèl and Huhh1, respectively. When using
Table 6.All combined experiments. The creep rate change is im-plemented by increasing the rate factorA(Eq. 6) and the change in material accumulation by varying the accumulation ratear(Eq. 9).
Model run Creep rate Accumulation
change change
1.4·Aand 0·Acc 1.4·A 0·ar 1.4·Aand 0.4·Acc 1.4·A 0.4·ar 1.4·Aand 1·Acc 1.4·A 1·ar 1.4·Aand 2·Acc 1.4·A 2·ar 1.7·Aand 0·Acc 1.7·A 0·ar 1.7·Aand 0.4·Acc 1.7·A 0.4·ar 1.7·Aand 1·Acc 1.7·A 1·ar 1.7·Aand 2·Acc 1.7·A 2·ar 2.7·Aand 0·Acc 2.7·A 0·ar 2.7·Aand 0.4·Acc 2.7·A 0.4·ar 2.7·Aand 1·Acc 2.7·A 1·ar 2.7·Aand 2·Acc 2.7·A 2·ar
6 Discussion
6.1 Modeling approach and rock glacier buildup Based on a continuum approach, our numerical model cou-ples observed sediment input rates and the rock glacier creep process in order to simulate the evolution of creep velocities and surface geometry as well as their dynamic interactions. This quantitative approach of coupling the relevant subsys-tems (headwall, deposition area and rock glacier), although highly simplified, was successful in building up the observed rock glacier geometries and related kinematics (horizontal velocities) within the expected timescales (Table 1). The basic dynamic behavior of a continuously advancing rock glacier body is well reproduced, while the thickness of the main body remains roughly constant.
The modeling of rock glacier buildup shows that besides topographical factors such as slope, the long-term advance rates and horizontal velocity are predominantly controlled by the rates of material accumulation and rock glacier rheology, whereas the thickness of the main landform seems less sen-sitive to material supply rates.
The match of observed to modeled velocities and thick-nesses should, by model construction, be expected (for sim-ilar surface slopes) given that the rate factorAand therefore the viscosity of the rock glacier material has been derived from such observed quantities (Eq. 11), but the agreement supports our modeling approach. More importantly, the ma-terial input rates and buildup times are fully independent es-timates and it is therefore not necessarily obvious to get the right rock glacier geometry at the prescribed time.
Our modeled constant advance rates and consistency be-tween modeled and previously estimated rock glacier buildup times further supports the method of back-calculating rock glacier age from current surface velocities (Frauenfelder and
Kääb, 2000; Kääb and Vollmer, 2000; Haeberli et al., 2003). Even for the case of temperature perturbations, advance rates of the front do not substantially change in the long term and thus this “dating” methods seem still appropriate for alpine rock glaciers. Advance rates are in the long term, however, affected by changes in material supply rates. It remains to note that it is actually the vertically averaged velocity, and not the surface velocity, that should match the advance rates. Our modeled advance rates (derived from an assumed rhe-ology withn=3 in Eq. 5) corresponds in general to four-fifths of the surface velocity (e.g., modeled surface veloc-ity on the main body of 0.065 m a−1 and an advance rate of 0,054 m a−1for Murtèl rock glacier). Consequently, us-ing surface velocities in back calculations of rock glacier age may overestimate the age. For many real-world rock glaciers (including Murtèl), rock glacier movement is dominated by deformation in a shear zone near the base and thus surface and vertically averaged creep is almost identical.
Strong simplifications have been made for our modeling approach such as using a homogenous sediment–ice body of uniform temperature and rheology and a spatially uniform and temporally constant material input. The successful rock glacier buildup therefore supports the idea that despite such simplifications rock glacier dynamics and evolution can be reduced to our simple model approach, which is based on the historic concept of Wahrhaftig and Cox (1959) and confirms earlier numerical modeling approaches of Olyphant (1983) and Frauenfelder et al. (2008).
2016). Moisture variations due to precipitation events have been shown to impact rock glacier rheology in the short term down to a few days (Wirz et al., 2016), whereas the impact of a changing ice–water proportion is assumed to show its con-sequences in the long term. Nevertheless, due to the fact that the creep is dominated near the base within our model and that we have calibrated our model parameters to observed geometry and velocities, we do not expect the general dy-namical behavior and involved timescales to be substantially different for other rheological parameter choices. We see our highly reduced approach also as an advantage for identify-ing the most essential controls and processes in rock glacier evolution.
In our approach the geomorphological mapping of the dif-ferent subsystems, the quantification of sediment input rates, the ice content and the horizontal velocities are the crucial observational constraints and sufficient to set up a model of rock glacier evolution. However, the simplicity of the model design does not, by construction, allow reproduction of the exact small-scale features such as ridges and furrows of the two chosen real-world rock glaciers (Frehner et al., 2015). 6.2 Dynamical adjustment to external forcing
The perturbation modeling experiments of applying a sudden change in sediment input, material temperature or a combi-nation of the two provide useful insights into the dynamic and geometric adjustment of rock glaciers to changes in ex-ternal forcing and therefore also into potential mechanisms that explain observed rock glacier degradation.
The two types of perturbation experiments show simi-larities but also clear differences in the dynamic response. Both an increase in the rock glacier temperature as well as a reduction in material input lead to a thinning of the rock glacier and the talus slope, whereas the front keeps advanc-ing through thickenadvanc-ing. Although the thinnadvanc-ing is caused by different mechanisms (lack of material supply from the rock wall or a runaway of mass through creep acceleration), from an observational point of view the two forcing mechanisms are difficult to distinguish. Importantly, the modeling shows a pronounced thinning occurring in the upper parts of both rock glacier systems (deposition area–talus slope).
The response in horizontal velocities are, for the two types of perturbations, distinctly different. A reduction in material supply results in a decrease of creep velocities from the top, whereas the temperature increase leads to an immediate ac-celeration of the entire landform, although in the long term the velocities return to almost pre-perturbation conditions (see Figs. 6c and 7c). The temperature experiments show a brief increase in the advance rates in the rock glaciers, but they subsequently return to similar rates as before the pertur-bation. This occurs in contrast with a continuous reduction of the advance rate during the decreased sediment supply experiment. Therefore, temperature changes within the rock glacier show a strong impact on short-term velocity
varia-tions whereas changes in the material input determine the long-term advance rates and geometry. Similar experiments by Olyphant (1983) and Frauenfelder et al. (2008) focused only on combined experiments and could therefore not ad-dress the impact of the individual forcings.
6.2.1 Dependence on rock glacier properties
Irrespective of the type of experiments, the absolute magni-tude in response (velocity change, thickness change or ad-vance rate) is very different for the two rock glaciers. Rela-tive to the initial quantities, however (pre-perturbation veloc-ity, thickness or advance rates), the dynamic changes are for both rock glaciers very similar (Fig. 10). This means that we should expect dynamic changes of rock glaciers to be scal-able by their geometric (thickness) and kinematic character-istics (flow speed and advance rate). This scalability is also in good agreement with the observational dataset of multian-nual creep variations of rock glaciers in the Swiss Alps (PER-MOS, 2013). These show very similar normalized horizontal velocity variations as a potential response to air temperature changes despite their distinctly different characteristics (De-laloye et al., 2010 and PERMOS, 2013). Recent continuous observations of creep velocities on rock glaciers in the Mat-ter Valley in the Swiss Alps confirm this finding even for seasonal timescales (Wirz et al., 2016).
The modeled short-term increase in horizontal velocity for a 1◦C warming in rock glacier body is also consistent with the observed speedup in rock glacier creep of about 300 % in the year 2003/2004 with exceptional snow conditions and a very warm summer (Delaloye et al., 2010).
6.2.2 Temperature dependence
Our temperature perturbation experiments assume an imme-diate warming of the entire rock glacier due to an increase in air temperature and consequently GST. This is, of course, an oversimplification because the vertical heat transfer de-pends on the energy balance at the surface and heat trans-port processes and thermal properties of the rock glacier ma-terial (Hanson and Hoelzle, 2004). Heat transfer processes should potentially be implemented in future studies (Kääb et al., 2007; Scherler et al., 2014). Hence we consider our modeled warming rather as a simple way to investigate the sensitivity to temperature increase.
For relatively thin rock glaciers such as Huhh1, a climatic warming could affect the whole rock glacier thickness in timescales of a few years to decades (Marmy et al., 2015). For thicker rock glaciers such as Murtèl, it could take several decades to centuries for the temperature change to reach the base where most of the deformation actually occurs. This im-plies that thin, and consequently steep and fast, rock glaciers should be more sensitive to warming from the surface.
few degrees below freezing), considering the most realistic model for temperature dependence of rock glacier rheology by Arenson and Springman (2005). At−1.0◦C rock glacier temperature, a warming of 1◦C results in a 2.7 times in-crease in the rate factor (and hence creep velocity) whereas the same warming at−2◦C results only in a 1.4 times higher rate factor. Observed rock glacier temperatures in the Swiss Alps indicate already relatively “warm” temperatures (close to zero degrees) and show a tendency for further warming (PERMOS, 2013). Such a warming would further amplify the response in acceleration. In contrast, when using a tem-perature dependence of pure ice (Paterson and Budd, 1982), as done in an earlier attempt of modeling the impact of tem-perature change on rock glacier creep (Kääb et al., 2007), the sensitivity of creep to temperature warming is smaller (a 1◦C warming results in only a 1.25 times increase in rate fac-tor) and does not additionally increase towards warmer rock glacier temperatures (Fig. 4). Thus, the impact of warming on creep acceleration could be bigger than previously expected. 6.2.3 Adjustment timescales
The modeling shows that the “adjustment timescales” in thickness and advance rates are for the faster and steeper Huhh1 rock glacier with 100 a, an order of magnitude faster than the 1000 a of Murtèl rock glacier (Figs. 6d and 7d). While in the literature such differences in adjustment timescales have qualitatively been linked to the general rhe-ology and mass turnover, the controlling factors remain un-quantified. A comparison to theoretical considerations based on the kinematic wave theory developed by Nye (1963) can be made for the material supply experiment. Besides the change in material supply rate, the thickness adjustment de-pends mainly on the traveling wave speed of the thickness perturbation and on its diffusion. According to Nye (1963; and see also Hooke, 2005) the traveling wave speed v0 is
given by a multiple of the rock glacier flow speed and specif-ically
v0=(n+2)·us. (12)
The diffusion of the thickness perturbation is proportional to the diffusivity which is given by
D0= n·q
α = n·uh
α , (13)
whereq is the ice flux andαthe surface slope. For Murtèl and Huhh1, this results in diffusivities of 30 and 53 m2a−1, which are as a result of very small creep velocities and low thicknesses much lower compared to diffusivities of pure-ice glaciers.
Following Johannesson et al. (1989; see also Hooke, 2005, p. 376) the related adjustment timescales of thickness changes to expand over the whole rock glacier lobe then de-pend on a propagation timescaleTpand a diffusion timescale
Td. The propagation timescale is given by Tp=
L0 v0
= L0
(n+2)·us
, (14)
whereL0 is the length scale of the rock glacier lobe. This
timescale is inversely proportional to the horizontal velocity and consistent with our modeling results means that a factor 10 difference in creep velocity between Huhh1 and Murtèl rock glacier translates into a factor 10 difference in adjust-ment time. Forn=3, lengths of 300 and 250 m and creep velocities of 0.07 and 0.6 m a−1for Murtèl and Huhh1, we obtain adjustment timescales of 860 and 83 a, respectively. These theoretical values agree in absolute and relative mag-nitude well with our modeled estimates.
The diffusion timescale is given by
Td= L20
D0
, (15)
which results in 3000 and 1200 a for Murtèl and Huhh1, re-spectively, for the thickness perturbation to spread over the entire landform and which is substantially longer than the timescales derived above for the kinematic wave propaga-tion. These diffusion timescales are also much longer com-pared to pure-ice glaciers and are consistent with the per-sistent occurrence of morphological features of ridges and furrows on the surface of rock glaciers.
To conclude, the propagation timescale, and therefore the horizontal velocity, is a simple and meaningful measure for rock glacier “adjustment timescales”. The very similar ad-justment timescales obtained for the different types of pertur-bation experiments support the notion that this propagation timescaleTpcan be used as a general measure of adjustment
in creep dynamics to a step change in external forcing. Note that the introduced adjustment timescale is not the same as the “volume response time” for pure-ice glaciers for adjust-ing to a new climate (Johannesson, 1989) and should not be confused with a “reaction time” (time taken for a rock glacier to show a detectable reaction on an external forcing). 6.2.4 Geometry change and subsidence
rock glaciers of roughly −0.05 m a−1 for the Murtèl rock glacier and −0.16 m a−1 for Huhh1 rock glacier while the lower rock glacier lobe shows relatively small or unchanging thicknesses and an advancing front. Thus, the spatial patterns in modeled geometry changes agree well with the observa-tions. The absolute maximum rates of modeled subsidence are for both rock glaciers between 2 and 10 times smaller than the observed rates depending on the perturbation. These modeled rates result from an immediate warming of 1◦C of the entire rock glacier body, which is a rather extreme sce-nario. Further, the possible maximum rates of thinning from a total switch off in material input rates are limited to their pre-perturbation absolute values (0.006 m a−1for Murtèl and 0.022 m a−1for Huhh1), which are also almost an order of magnitude smaller than the observed subsidence rates.
Thus, we conclude that thinning due to thermally induced acceleration and a reduction in material input are not suffi-cient to explain observed subsidence patterns at Murtèl and Huhh1 rock glacier and that melt of subsurface ice is addi-tionally required for the observed volume loss. The process of landform thinning, especially in the upper parts of the rock glacier, has been described as a sign of degradation by Ikeda and Matsuoka (2002), Roer et al. (2008b) and Springman et al. (2013). However, subsidence through melt of subsurface ice remains poorly constrained through observations and our process understanding and models linking them to external forcing are still limited (Scherler et al., 2014) and therefore we did not include this process in our flow modeling. In fu-ture work, internal ice melt (as a function of temperafu-ture) could technically easily be included through a negative accu-mulation term in the surface evolution Eq. (8) and an adjust-ment of the mean density.
7 Conclusions
This study uses a numerical flow model based on the con-servation of mass within the cascading transport system of coarse debris to simulate the long-term and current evolution of rock glacier surface geometry and velocity. For a given sediment–ice input and rock glacier rheology, the model is able to generate observed rock glacier geometries and creep velocities in realistic timescales for two distinctly different rock glaciers. It is also capable of reproducing the continu-ing advanccontinu-ing front through creep which is often observed for rock glaciers (Barsch, 1996).
Climatic changes, especially increasing temperatures, are expected to influence rock glacier dynamics in a profound way. Our modeling approach allows not only for investigat-ing the impact of a direct warminvestigat-ing of the rock glacier ma-terial by adjusting the rheology (rate factor) but also for in-cluding the influence of changes in material input consisting of sediments and ice. Changes in geometry and related kine-matics in response to such external perturbations can thereby be modeled and contribute towards a better understanding of
the evolution of rock glaciers. Note that effects of internal ice melt or noncontinuous deformations such as the forma-tion of tension cracks are not included in the current version of the model. Our detailed analysis of such perturbation ex-periments and modeling sensitivity studies give the following insights on rock glacier dynamics:
Short-term changes in velocities and advance rates result from temperature variations, whereas long-term geometric adaptations (thickness and advance rates) are mainly influ-enced by material supply. We show that a 1◦C temperature increase in rock glacier temperature can result in a 1.5–3 time acceleration of horizontal velocity depending on the initial thermal state of the rock glacier.
Both rock glacier temperature increase and reduction in material supply lead to thinning, while for the latter the max-imum thinning rates are limited by the pre-perturbation ma-terial supply rate.
Irrespective of the perturbation, the rock glaciers keep ad-vancing and remain active although the thermal and sediment input conditions are not favorable for their longevity, which is consistent with field observations.
Rock glaciers react spatially and temporally variably to changes in environmental factors. Changes in temperature affect the entire landform but the impact of material input variations is most pronounced in the sedimentation area and upper parts of the rock glacier. Comparing the model sce-narios for localized topographic adaptations (subsidence) in-troduced by warming and variations in sediment–ice supply to observed subsidence features shows that these controlling factors are not sufficient to explain the magnitudes observed for our two examples. This implies that other processes such as melting of subsurface ice are responsible for subsidence and need further investigation.
Although the absolute magnitudes in thinning and creep acceleration differ between the two rock glaciers, the changes relative to the initial thickness and creep velocity, respec-tively, are very similar thus indicating that changes scale with their geometric and dynamic characteristics.
Based on most recent models of rock glacier rheology (Arenson and Springman, 2005), rock glaciers close to 0◦C likely show much stronger reactions to thermal forcing than colder ones.
On the basis of our modeling and kinematic wave theory, we propose a typical “timescale of dynamic adjustment” to external perturbations that is given by the inverse of a few times the horizontal velocity of a rock glacier. This timescale explains the order of magnitude difference in dynamic ad-justment of our two chosen rock glacier examples which amount to 1000 a for Murtèl and 100 a for Huhh1.
as indicators for the recent changes affecting periglacial high mountain systems. Therefore, future monitoring strategies should specifically be designed to detect spatially heteroge-neous geometry changes and aim at observing entire slope systems, in addition to focusing on single landforms.
8 Data availability
Data on rock glacier kinematics are available from the PER-MOS office upon request (see http://www.permos.ch/data. html). The digital elevation models derived from the RC30 sensor system at Murtél rockglacier 1996, 2002 and 2007 are also part of the PERMOS dataset. The remaining DEMs are available upon request from the authors.
The Supplement related to this article is available online at doi:10.5194/tc-10-2865-2016-supplement.
Acknowledgements. This study was conducted within the SNF-Sinergia project TEMPS financed by the Swiss National Science Foundation (project no. CRSII2 136279). Further support was granted by the project X-sense 2 financed by the Swiss National Science Foundation and funded by Nano-Tera.ch. The authors would like to thank all colleagues within these projects for their valuable input during meetings and conferences. Support from the PERMOS network (Permafrost Monitoring Switzerland) is also thankfully acknowledged. We also thank Lukas U. Arenson and Christophe Kinnard for their constructive comments.
Edited by: C. Hauck
Reviewed by: L. Arenson and C. Kinnard
References
Arenson, L., Hoelzle, M., and Springman, S.: Borehole deforma-tion measurements and internal structure of some rock glaciers in Switzerland, Permafrost Periglac., 13, 117–135, 2002. Arenson, L. U. and Springman, S. M.: Mathematical descriptions
for the behaviour of ice-rich frozen soils at temperatures close to 0◦C, Can. Geotech. J., 42, 431–442, doi:10.1139/t04-109, 2005. Arenson, L. U., Johansen, M. M., and Springman, S. M.: Effects of volumetric ice content and strain rate on shear strength under triaxial conditions for frozen soil samples, Permafrost Periglac., 15, 261–271, doi:10.1002/ppp.498, 2004.
Barsch, D.: Permafrost creep and rockglaciers, Permafrost Periglac., 3, 175–188, doi:10.1002/ppp.3430030303, 1992. Barsch, D.: Rockglaciers: Permafrost Creep and Rockglaciers,
Springer, Berlin, 331 pp., 1996.
Bishop, M. P., Shroder, J. F., and Colby, J. D.: Remote sens-ing and geomorphometry for studysens-ing relief production in high mountains, Geomorphology, 55, 345–361, doi:10.1016/S0169-555X(03)00149-1, 2003.
Bodin, X., Rojas, F., and Brenning, A.: Status and evolution of the cryosphere in the Andes of Santiago (Chile, 33.5◦S.), Geomor-phology, 118, 453–464, doi:10.1016/j.geomorph.2010.02.016, 2010.
Bodin, X., Schoeneich, P., Deline, P., Ravanel, L., Magnin, F., Krysiecki, J.-M., and Echelard, T.: Mountain permafrost and associated geomorphological processes: Recent changes in the French Alps, J. Alp. Res., 103, doi:10.4000/rga.2885, 2015. Buchli, T., Merz, K., Zhou, X., Kinzelbach, W., and
Spring-man, S. M.: Characterization and Monitoring of the Furgg-wanghorn Rock Glacier, Turtmann Valley, Switzerland: Re-sults from 2010 to 2012, Vadose Zone J., 12, 1539–1663, doi:10.2136/vzj2012.0067, 2013.
Carson, M. A.: Angles of repose, angles of shearing resistance and angles of talus slopes, Earth Surf. Process., 2, 363–380, doi:10.1002/esp.3290020408, 1977.
Cuffey, K. M. and Paterson, W.: The physics of glaciers, 4th ed., Elsevier, Amsterdam, 693 pp., 2010.
Delaloye, R., Lambiel, C., and Gärtner-Roer, I.: Overview of rock glacier kinematics research in the Swiss Alps, Geogr. Helv., 65, 135–145, doi:10.5194/gh-65-135-2010, 2010.
Delaloye, R., Morard, S., Barboux, C., Abbet, D., Gruber, V., Riedo, K., and Gachet, S.: Rapidly moving rock glaciers in Mattertal, in: Mattertal – ein Tal in Bewegung, edited by: Graf, C., Jahresta-gung der Schweizerischen Geomorphologischen Gesellschaft, St. Niklaus, 29 June–1 July, WSL, Birmensdorf, 2011.
Fischer, L., Amann, F., Moore, J. R., and Huggel, C.: Assess-ment of periglacial slope stability for the 1988 Tschierva rock avalanche (Piz Morteratsch, Switzerland), Eng. Geol., 116, 32– 43, doi:10.1016/j.enggeo.2010.07.005, 2010.
Frauenfelder, R. and Kääb, A.: Towards a palaeoclimatic model of rock-glacier formation in the Swiss Alps, Ann. Glaciol., 31, 281– 286, doi:10.3189/172756400781820264, 2000.
Frauenfelder, R., Schneider, B., and Kääb, A.: Using dynamic mod-eling to simulate the distribution of rockglaciers, Geomorphol-ogy, 93, 130–143, doi:10.1016/j.geomorph.2006.12.023, 2008. Frehner, M., Ling, A., and Gärtner-Roer, I.: Furrow-and-Ridge
Mor-phology on Rockglaciers Explained by Gravity-Driven Buckle Folding: A Case Study From the Murtèl Rockglacier (Switzer-land), Permafrost Periglac., 26, 57–66, doi:10.1002/ppp.1831, 2015.
Gärtner-Roer, I.: Sediment transfer rates of two active rock-glaciers in the Swiss Alps, Geomorphology, 167–168, 45–50, doi:10.1016/j.geomorph.2012.04.013, 2012.
Gärtner-Roer, I. and Nyenhuis, M.: Volume estimation, kinematics and sediment transfer rates of active rockglaciers in the Turtmann Valley, Switzerland, in: Landform – structure, evolution, process control: Proceedings of the International Symposium on Land-form organised by the Research Training Group 437, edited by: Otto, J.-C. and Dikau, R., Lecture notes in earth sciences, 115, Springer, Berlin, 185–198, 2010.
Glade, T.: Linking debris-flow hazard assessments with geomorphology, Geomorphology, 66, 189–213, doi:10.1016/j.geomorph.2004.09.023, 2005.
Glen, J. W.: The creep of polycristalline ice, P. R. Soc. London, 228, 519–538, doi:10.1098/rspa.1955.0066, 1955.