*e-mail: [email protected]
Prediction of Steel Flow Stresses under Hot Working Conditions
Alberto Moreira Jorge Junior, Oscar Balancin*
Department of Materials Engineering, Federal University of São Carlos,
Via Washington Luiz, Km 235, 13565-905 São Carlos - SP, Brazil
Received: November 18, 2004; Revised: July 11, 2005
An austenitic stainless steel was deformed in torsion over a temperature range of 900-1200 °C using strain rates of 1, 5 and 10 s-1. The stress vs. strain curves determined were corrected for deformation heating and the flow
stress was found to rise in the initial work-hardening regime, reaching a maximum before dropping to the steady state due to softening brought about by dynamic recrystallization. In order to determine the onset of dynamic recrystallization, diagrams of work-hardening rate vs. applied stress were drawn up for the hardening region of the flow stress curves. The flow stress curves were modeled by adjusting an evolution equation having one internal variable that describes the plastic behavior in the work-hardening regime to the experimental data. The flow stress after the onset of dynamic recrystallization was determined by incorporating the fractional softening into the evolution equation. Describing the effects of temperature and strain rate on the evolution equation through Zener-Hollomon parameters, a database was constructed for use in computer models to predict the roll force of rolling or forging loads under hot working conditions.
Keywords:low stress curves, modeling of hot deformation, critical strain
1. Introduction
The need for estimating roll forces during hot rolling or compres-sive forces during hot forging of steels has driven research on flow stress curve modeling under hot work conditions. Although modeling is essential to improve the practices of industrial forming processes, this task is not easy when it involves internal structures which evolve along time through hardening and softening mechanisms. Materials whose dislocations are able to cross-slip and climb, rearranging into polygonal subgrain structures, tend to show a high degree of dynamic recovery, while materials with low stacking fault energy display a much lower level of dynamic recovery. In this case, dislocation density rises until it reaches a critical condition, at which point new grains nucleate and grow during straining. As a consequence, the flow curve shape depends on the competition between work hardening, recovery and recrystallization1.
Considerable research has been carried out to model flow stress curves at high temperatures based on both empirical relations and theoretical fundaments2-6. Most of these models divide the flow curves
into two regions, the first involving the effects of work hardening and dynamic recovery on flow stresses and the second adding the softening caused by dynamic recrystallization. A one-internal-variable formula-tion has been used for modeling the flow stress behavior of austenite undergoing work hardening and dynamic recovery at high tempera-tures. The reduction of the stress level after the onset of dynamic recrystallization has been determined by incorporating the fractional softening into the evolution equation through an Avrami-type equa-tion. The strain corresponding to the peak stress or some fraction of this amount has been selected as the onset of dynamic recrystalliza-tion. However, it is well known that dynamic recrystallization actually initiates at a critical strain before the peak stress7,8. The aim of this
study was to model the plastic flow behavior of an austenitic stainless steel under hot working conditions, determining the actual value of the critical strain for the initiation of dynamic recrystallization. This value was determined by drawing up work-hardening rate vs. applied stress diagrams based on experimental data.
2. Theory
The evolution of dislocation density (ρ) during deformation (ε) in the hardening regime of the flow stress curve is controlled by the competition between dislocation storage and annihilation (rearrange-ment) and can be assumed to be the sum of two independent terms:
d d
d d
d d f
t f t
f t
=
-+
-c m c m (1)
where the first term on the right-hand side represents the contribution of work hardening and the second represents the dynamic recovery. Bearing in mind that the work hardening term can be regarded as constant with respect to strain2,4,9 and that the dynamic recovery term
follows first-order kinetics2,4,9-11, Equation 1 can be rewritten as:
d d
h r f t
t
= - (2)
The integration of this equation gives
( )
e r
h 1 e
r r
0
t=t -f+b l - -f
(3)
where ρ0 is the initial dislocation density. Since the effective stress is negligible compared to the internal stress at high temperatures, the mechanical strength of the obstacles to dislocation glide, which is related to the dislocation density, can be selected as the structural parameter:
MGb
v=a t (4)
where α is a numerical constant of order unit, M is the Taylor factor, G is the shear modulus, and b is the magnitude of Burger’s vector. The flow stress as a function of strain can be attained combining Equations 3 and 4:
( ) ( )
e MGb hr 1 e
.
r r
0
2 2
0 5
v=;v -f+ a b l - -fE
(5)
where σ0 is the initial stress. This equation describes the stress vs.
saturation stress, (σ*
ss ), which could be attributable to an equilibrium
between dislocation storage and dislocation annihilation (rearrange-ment) and corresponds to dρ/dε = 0.
However, austenitic stainless steels with relatively low stacking fault energies soften by dynamic recrystallization after some degree of strain. This threshold strain is known as the critical strain and cor-responds to the application of the minimum amount of work necessary for the initiation of dynamic recrystallization. This value reflects the upper limit of the amount of energy which can be stored locally in the material8. Although the critical amount of stored energy seems to
be a necessary condition for the onset of dynamic recrystallization, it may not be the only condition required. The initiation of dynamic recrystallization also requires that the rate of energy dissipation also attain a critical value. Applying the principles of irreversible ther-modynamics, Poliak and Jonas8 shown that the critical state for the
onset of dynamic recrystallization occurs when:
0
2 2
2 2
vb- vil= (6)
which corresponds to an inflection point in the work-hardening rate (θ = dσ/dε) vs. applied stress (σ) diagram.
After the onset of nucleation, the evolution of the dislocation density depends on the kinetics of dynamic recrystallization. It has been established that the kinetics of dynamic recrystallization is well described by Avrami’s equation. The flow softening promoted by dynamic recrystallization can be determined by incorporating the fractional softening into the evolution equation, assuming that the mechanical softening is directly proportional to the recrystallized volume fraction:
exp K
1
recdin
ss ss rexdin
d c
Nd
v=v -7v)-v A: - $- _f-fi .D (7)
where σrecdin represents the steady state stress in the absence of
ad-ditional softening brought about by dynamic recrystallization and is comparable to saturation stress (σ*
ss ). The stress σss
rexdin represents the
steady state of the dynamic recrystallization and Kd and Nd Avrami constants.
3. Material and Experimental Procedures
The steel used in this work was 304 austenitic stainless steel (18.3Cr, 8.4Ni, 1.2Mn, 0.08C, 0.6Si). Cylindrical specimens with 5 mm of effective radius and 10 mm of effective length were ma-chined out of hot rolled bars. Mechanical tests were carried out on a computerized hot torsion machine. The samples were heated in an induction furnace mounted directly on the testing machine. Chromel-alumel thermocouples were used to measure and control the temperature. The instantaneous torque and rotation angle were recorded during testing. The data were processed using a software program that imposes parametric tests such as temperature, holding time, amount of straining and strain rate.
Hot torsion tests were carried out over a temperature range of 900 °C to 1200 °C and at equivalent strain rates of 1, 5 and 10 s-1. The
samples were heated from room temperature to 1250 °C, held there for 10 minutes, then cooled to deformation temperatures and held there for 1 minute before being deformed. The equivalent stress was calculated by the Fields and Backofen method12 while the equivalent
strain was calculated based on the von Misses relationship13, by means
of the following expressions:
( )
R M
m n
L R 2
3 3
3 and
eq 3 eq
v
r f
z
= + + = (8)
where M is the torque, R is the sample radius, L is the gage sample, φ is the rotation angle, m is the work-hardening exponent and n is the strain-rate-sensitivity exponent.
The stress vs. strain curves determined by the software program were based on the specimen’s initial temperature. However, the ac-tual temperature differed from the initial one due to the conversion of plastic work into heat and losses by conduction, convection, and radiation from the specimen to its surroundings. The temperature rise due to deformation was calculated through a numerical simulation, applying finite elements and appropriate boundary conditions14, and
the stress level was corrected.
A minimum square method was applied to fit the experimental data to rate and evolution equations (activation energy determination, non-linear equation fit and Fourier series). The program developed here consists of three algorithms to solve equation systems applying the methods of Newton-Raphson, Steepest Descent and Marquardt. This software program is a variant of the VA05A and MB11A routines of the Harwel Subroutine library (available in FORTRAN®), used in
mainframe computers adapted to personal computers.
4. Experimental Results
The plastic flow curves obtained from tests and corrected for deformation heating are displayed in Figure 1. The flow stress rises to a maximum before dropping to the steady state, indicating a flow hardening at the commencement of the strain and a flow softening after a certain degree of strain. Table 1 displays the values of the initial, peak and steady-state stresses determined as a function of deformation temperatures.
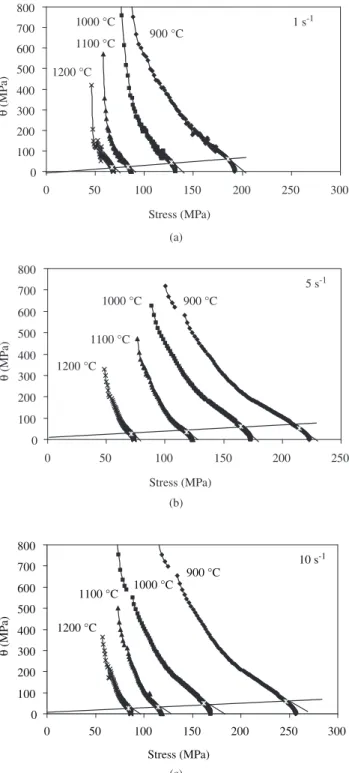
The commencement of the work-softening regime on the flow stress curves is determined by the critical strain required to trigger the dynamic recrystallization. In order to determine the onset of dy-namic recrystallization, diagrams of work-hardening rate (θ = dσ/dε)
vs. applied stress were drawn up for the hardening region of the flow stress curves. Although the noise level of the experimental data was relatively low, it sufficed to cause a large spread during the data processing involved in the calculation of the work-harden-ing rate. To decrease this spread without alterwork-harden-ing the data, a digital filter technique was used, applying Fourier series15. The minimum
square method described earlier was used to fit these series to the experimental data.
Work-hardening rate vs. applied stress diagrams calculated from data presented in Figure 1 are displayed in Figure 2. This figure shows that the work-hardening rate decreased continuously as the applied stress increased, displaying an inflexion point close to the peak stresses; this point corresponded to the minimum in Equation 6. The downward deflection of the work-hardening rate derives from the nucleation of new unstrained grains and represents the onset of dynamic recrystallization. Table 2 displays the values determined. Actually, the nucleation process begins at strains below the peak strain; the ratio found was εc = 0.56 εp. Thus, the softening due to dynamic recrystallization must account for all the strains greater than the critical one.
5. Plastic Flow Stress Curve Modeling
5.1. Fitting experimental data to Equations 5 and 7
A minimum square method was employed to determine the values of [(αMGb)2h] and r in the equation representing the work-hardening
regime on the flow stress curves. The software used was basically the same as that applied for the digital filter technique described earlier. The values of each term of (αMGb)2h cannot be discretely
deter-mined by fitting experimental data to Equation 5; this may be done by measuring the material and dislocation characteristics. However, this is unnecessary for an accurate mathematical description of the plastic flow stress curves. The values of σ*
Table 1. Dependence of the initial, peak and steady-state stresses on defor-mation conditions.
Initial, peak and steady-state stresses ( MPa)
(°C)
1 s-1 5 s-1 10 s-1
σo σp σss σo σp σss σo σp σss
900 54 192 136 57 223 168 58 257 184
1000 50 132 90 52 173 111 53 169 121
1100 46 86 63 48 123 77 49 118 85
1200 43 68 46 45 74 57 46 87 62
0 50 100 150 200 250 300
0 1 2 3 4
Strain
Stress (MP
a)
900 °C
1200 °C 1000 °C 1100 °C
1 s-1
0 50 100 150 200 250 300
0 1 2 3 4
Strain
Stress (MP
a)
900 °C
1100 °C
1200 °C 1000 °C
5 s-1
0 50 100 150 200 250 300
0 1 2 3 4
Strain
Stress (MP
a)
900°C
1100 °C
1200 °C 1000 °C
10 s-1
Figure 1. Isothermal flow stress curves determined with strain rates of
a) 1 s-1; b) 5 s-1; and c) 10 s-1.
(a)
(b)
(c)
Table 2. Evolution of the critical strain causing the onset of dynamic recrystal-lization under the deformation conditions employed here.
Critical strain (εc)
(°C) 1 s-1 5 s-1 10 s-1
900 0.51 0.65 0.66
1000 0.41 0.53 0.51
1100 0.35 0.42 0.41
1200 0.30 0.31 0.34
0 100 200 300 400 500 600 700 800
0 50 100 150 200 250 300
Stress (MPa)
Q
(MP
a)
900 °C 1000 °C
1100 °C
1200 °C
1 s-1
0 100 200 300 400 500 600 700 800
0 50 100 150 200 250
Stress (MPa)
Q
(MP
a)
900 °C 1000 °C
1100 °C
1200 °C
5 s-1
0 100 200 300 400 500 600 700 800
0 50 100 150 200 250 300
Stress (MPa)
Q
(MP
a)
900 °C 1000 °C 1100 °C
1200 °C
10 s-1
(a)
(b)
(c)
Figure 2. Dependence of the work-hardening rate (θ) on the applied stress
applying high values for strain in Equation 5. Table 3 displays data obtained in this fitting.
For strains greater than the critical strain causing the onset of dynamic recrystallization, the stress evolution is determined by the dynamic recrystallization kinetics. From Equation 7, the recrystallized volume fraction can be determined by:
exp
Xd 1 K
ss ss ss
d c
Nd
v v
v v
f f
=
-= - -
-) ) _
_ _
i
i 9 i C
(9)
Plots of log[ln(1/(1- Xd))] vs. log (ε – εc) were used to determine the Kd and Nd constants. Table 4 shows that the values of Nd fall between 1.6 and 1.8. These values are greater than that found for static recrystallization, when Nd assumes values close to unit16,17.
In the steady state, the microstructure consists of recrystallized and strained grains, whereas all the grains are unstrained after static recrystallization.
5.2. Effect of deformation conditions on the parameters of
Equations 5 and 7
The stress levels depend on the deformation conditions, i.e., temperature and strain rate, as can be seen in Figure 1 and Table 1. At low strain rates and high temperatures, the material’s response can be characterized by low peak strains and stresses, with the steady state achieved relatively quickly. An increase in the strain rate and a decrease in temperature result in increases in peak stress and peak strain. In this case, much higher strains are required to reach a steady state condition, indicating a reduction in the dynamic recrystalliza-tion rate. Several studies have shown that this dependence can be described by the generalized hot-working relationship proposed by Sellars and Tegart18:
Z = ε•exp sinh
RT Q
A p
n
fo c m= 8 _aviB (10)(10)
where ε•
is the strain rate, σp is the peak stress, Q the activation en-ergy for deformation, T the temperature, A and α are constants, R is the universal gas constant and Z is the Zener-Hollomon parameter. The values determined for constants and activation energy were: α = 0.012, n = 4.32 and Q = 401 kJ/mol. The fit of the experimental data to this equation is displayed in Figure 3, which indicates that the activation energy value is the same in all the deformation condi-tions investigated.
Since the value of the apparent activation energy for hot work-ing is known, the effects of deformation temperature and strain rate on the plastic flow stresses can be described. Figure 4 displays the dependence of the parameters of Equations 5 and 7 on the Zener-Hollomon parameter.
Figure 4 suggests that the dependence of all the parameters on the deformation conditions can be described by a single equation of the following type:
Parameter 10a*log( )Z b
= 7 + A (11)
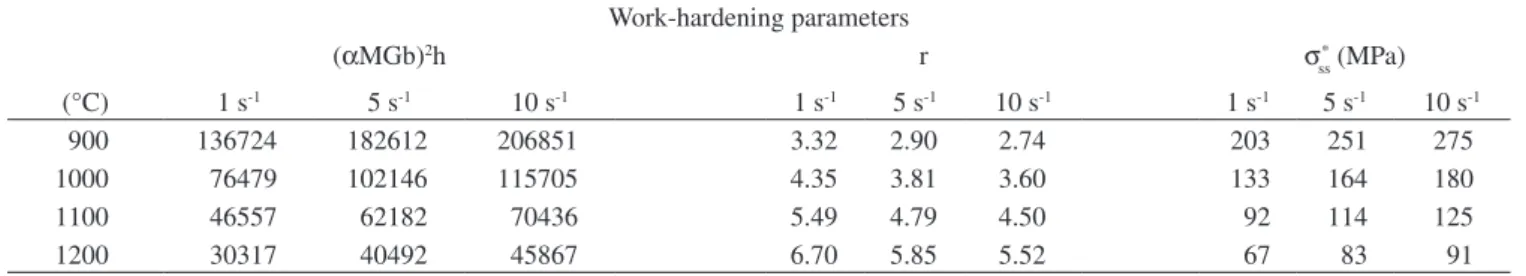
Table 5 represents the database necessary for designing flow stress curves for any deformation condition. The plastic flow stress Table 3. Dependence of the work-hardening parameters on deformation conditions.
Work-hardening parameters
(αMGb)2h r σ*
ss (MPa)
(°C) 1 s-1 5 s-1 10 s-1 1 s-1 5 s-1 10 s-1 1 s-1 5 s-1 10 s-1
900 136724 182612 206851 3.32 2.90 2.74 203 251 275
1000 76479 102146 115705 4.35 3.81 3.60 133 164 180
1100 46557 62182 70436 5.49 4.79 4.50 92 114 125
1200 30317 40492 45867 6.70 5.85 5.52 67 83 91
Table 4. Dependence of the Avrami-equation parameters on the deformation conditions.
Dynamic-recrystallization parameters
Kd Nd
(°C) 1 s-1 5 s-1 10 s-1 1 s-1 5 s-1 10 s-1
900 0.4036 0.3709 0.3577 1.7923 1.8171 1.8279
1000 0.4782 0.4395 0.4238 1.7435 1.7676 1.7781
1100 0.5527 0.5080 0.4898 1.7028 1.7264 1.7366
1200 0.6264 0.5757 0.5551 1.6684 1.6915 1.7016
behavior of the 304 austenitic stainless steel at high temperatures can be predicted through any programming language by applying these data to Equations 5 and 7. If a constant Z curve is required, it is simply a matter of fixing Z and increasing the strain in small increments. For a more realistic curve, each increment in strain will require a corresponding value of instantaneous Z.
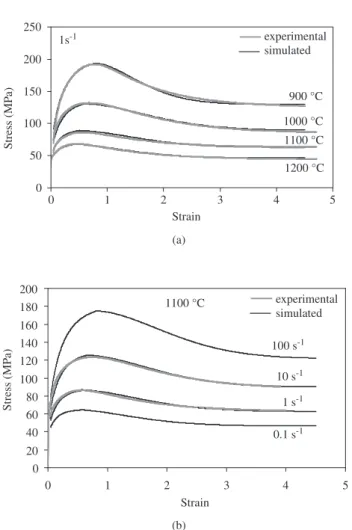
5.3. Validation
The evolution equation was solved for constant Z and compared with the original experimental data. Figure 5 shows experimental and simulated flow stress curves determined with strain rate of 1 s-1 and
determined at 1100 °C with strain rates of 1 and 10 s-1 and predicted
for strain rates of 0.1, 1, 10 and 100 s-1.
Figure 5 indicates a good agreement between predicted and exper-imental stress/strain curves. Moreover, this methodology is expected to be applicable for predicting flow stress curves for deformation conditions outside the experimental window. Since the deformation conditions bring in the evolution equation through the Zener-Hollo-mon parameter, the flow stress behavior can be predicted in the entire domain where the apparent activation energy for hot working is the
- 0.2 0 0.2 0.4 0.6 0.8 1 1.2
1E + 14 1E + 15 1E + 16 1E + 17 1E + 18 1E + 19
Z (s - 1)
Log(sinh(
AS
p))
0.1 1
1E + 14 1E + 15 1E + 16 1E + 17 1E + 18 1E + 19
Z (s-1)
E
c
10 100
1E + 14 1E + 15 1E + 16 1E + 17 1E + 18 1E + 19
Z (s-1)
S0
(MP
a)
1 10
1E + 14 1E + 15 1E + 16 1E + 17 1E + 18 1E + 19
Z (s-1)
r
1.E + 04 1.E + 05 1.E + 06
1E + 14 1E + 15 1E + 16 1E + 17 1E + 18 1E + 19
Z (s-1)
(
A
GMb)
2h
10 100 1000
1E + 14 1E + 15 1E + 16 1E + 17 1E + 18 1E + 19
Z (s-1)
S
* ss (MP
a)
10 100 1000
1E + 14 1E + 15 1E + 16 1E + 17 1E + 18 1E + 19
Z (s-1)
Sss
(MP
a)
0.1 1
1E + 14 1E + 15 1E + 16 1E + 17 1E + 18 1E + 19
Z (s-1)
Kd
1 10
1E + 14 1E + 15 1E + 16 1E + 17 1E + 18 1E + 19
Z (s-1)
Nd
same. However, if a new hardening or softening mechanism, such as precipitation or modification of texture, begins to operate under some deformation conditions, the value of the apparent activation energy also changes19, hence requiring the determination of new values for
the parameters of Equations 5 and 7.
6. Conclusions
The one-internal-variable evolution equation describes the experi-mental flow stress curve and is suitable for modeling the flow behavior of austenitic stainless steel undergoing work hardening and dynamic recovery at high temperatures. The construction of work-hardening rate vs. applied stress diagrams leads to the accurate determination of the onset of dynamic recrystallization, based on experimental data. After the initiation of dynamic recrystallization, the simultaneous use of the evolution equation and fractional softening allows for the accurate prediction of flow stresses.
The experimental procedures used to determine the steel’s plastic behavior, combined with the methodology applied to flow curve modeling, allowed for the construction of a database needed for the prediction of 304 austenitic stainless steel flow stresses under hot working conditions.
Acknowledgments
The financial support of the Brazilian research funding agencies FAPESP and CNPq is gratefully acknowledged.
References
1. Jorge Jr. AM, Regone W, Balancin O. Effect of competing hardening and softening mechanisms on the flow stress curve modeling of ultra-low carbon steel at high temperatures. Journal of Materials Procesing Technology. 2003; 142:415-421.
2. Laasraoui A, Jonas JJ. Prediction of steel flow stresses at high temperatures and strain rates. Metallurgical Transactions A. 1991; 22A:1545-1558. 3. Medina SF, Hernandez CA. Modelling of the dynamic recrystallization
of austenite in low alloy and microalloyed steels. Acta Materialia. 1996; 44:165-171.
4. Cabrera JM, Al Omar A, Jonas JJ, Prado JM. Modeling the flow behavior of a medium carbon microalloyed steel under hot working conditions. Metallurgical and Materials Transactions A. 1997; 28A:2233-2244. 5. Davenport SB, Silk NJ, Sparks CN, Sellars CM. Development of
con-stitutive equations for modeling of hot rolling. Materials Science and Technology. 2000; 16:539-546.
6. Huang C, Harwbolt EB, Meadowcroft TR, Matlock DK. Flow stress modeling and warm rolling simulation behavior of two Ti-Nb interstitial-free steels in the ferrite region. Acta Materialia. 2001; 49:1445-1452.
7. McQueen HJ, Ryan ND, Evangelista E. Dynamic recrystallization
in austenitic stainless steels. Materials Science Forum. 1993;
113-115:435-440.
8. Poliak EI, Jonas JJ. A one-parameter approach to determining the critical conditions for the initiation of dynamic recrystallization. Acta Materialia. 1996; 44:127-136.
9. Bergström Y, Aronsson B. The application of a dislocation model to the strain and temperature dependence of the strain hardening exponent n in the Ludwik-Hollomon relation between stress and strain in mild steels. Metallurgical Transactions A. 1972; 3:1951-1957.
10. Chu D, Morris Jr JW. The influence of microstructure on work hardening in aluminum. Acta Materialia. 1996; 44:2599-2610.
11. Estrin Y, Mecking H. A unified phenomenological description of work hardening and creep based on one-parameter models. Acta Metallurgica. 1984; 32A:57-70.
12. Fields DS, Backofen WA. Determination of strain hardening character-istics by torsion testing. Amer. Soc. Test. Met. 1957; 57:1259-1272. 13. Semiatin SL, Lahoti G, Jonas JJ. Application of the torsion test to
de-termine workability. In: ASM, editor. Metals Handbook: Mechanical
Testing, 8, 9th ed., OHIO: ASM; 1985. p. 154-184.
14. Jorge Jr, AM. Análise do comportamento mecânico de aços inoxidáveis em
altas temperaturas e altas taxas de deformação. [Unpublished Doctoral thesis]. São Carlos: Universidade Federal de São Carlos, São Carlos; 1997.
15. Spiegel MR. Mathematical handbook of formulas and tables. In: Schaum’s Outline Series, editor. New York: McGraw-Hill; 1973. p. 131. Figure 5. Experimental and simulated flow stress curves determined with strain
rate of 1 s-1 a) and determined at 1100 °C with strain rates of 1 and 10 s-1 and
predicted for strain rates of 0.1, 1, 10 and 100 s-1 b).
Table 5. Database for predicting 304 stainless steel flow stress curves under hot working conditions, presenting a and b parameters of Equation 11.
Parameter
εc σ0 r (αMGb)
2 h σ*
ss σss Kd Nd
a 0.0770 0.02812 - 0.0837 0.1798 0.13177 0.12938 - 0.0524 0.0085
b - 1.4225 1.23211 2.0170 1.9236 - 0.0466 - 0.1763 0.54330 0.1006
0 50 100 150 200 250
0 1 2 3 4 5
Strain
Stress (MP
a)
experimental simulated
1s-1
900 °C
1000 °C
1100 °C
1200 °C
0 20 40 60 80 100 120 140 160 180 200
0 1 2 3 4 5
Strain
Stress (MP
a)
10 s-1
1 s-1
0.1 s-1
100 s-1
1100 °C experimental
simulated (a)
16. Barbosa RANM, Sellars CN. Static recrystallisation of type 316L stain-less steel under hot working conditions. Materials Science Forum. 1993; 113-115:461-466.
17. Fernández AI, López B, Rodríguez-Ibabe JM. Relationship between the austenite recrystallized fraction and the softening measured from the in-terrupted torsion test technique. Scripta Materialia. 1999; 40:543-549.
18. Sellars CM, Tegart WJ, Mc G. La relation entre la résistance et la structure dans la deformation à chaud. Memories Scientiiques Rev. Métallurg. 1966; 63:731-746.