Heterozygote Advantage Probably Maintains
Rhesus Factor Blood Group Polymorphism:
Ecological Regression Study
Jaroslav Flegr*
Division of Biology, Faculty of Science, Charles University in Prague, Prague, Czech Republic
Abstract
Rhesus factor polymorphism has been an evolutionary enigma since its discovery in 1939. Carriers of the rarer allele should be eliminated by selection against Rhesus positive chil-dren born to Rhesus negative mothers. Here I used an ecologic regression study to test the hypothesis that Rhesus factor polymorphism is stabilized by heterozygote advantage. The study was performed in 65 countries for which the frequencies of RhD phenotypes and spe-cific disease burden data were available. I performed multiple multivariate covariance analy-sis with five potential confounding variables: GDP, latitude (distance from the equator), humidity, medical care expenditure per capita and frequencies of smokers. The results showed that the burden associated with many diseases correlated with the frequencies of particular Rhesus genotypes in a country and that the direction of the relation was nearly always the opposite for the frequency of Rhesus negative homozygotes and that of Rhesus positive heterozygotes. On the population level, a Rhesus-negativity-associated burden could be compensated for by the heterozygote advantage, but for Rhesus negative subjects this burden represents a serious problem.
Introduction
Polymorphism in the Rhesus factor, namely the existence of a large deletion in the RHD gene [1] in a substantial fraction of the human population, has been an evolutionary enigma since the discovery of this factor in the 1930’s [2–5]. Before the introduction of prophylactic treat-ment in 1968, the carriers of the rarer variant of the gene, namely Rhesus negative women in in a population of Rhesus positive subjects or Rhesus positive men in population of Rhesus negative subjects, had lower fitness. This is because RhD-positive children born to pre-immu-nized RhD-negative mothers were at a higher risk of fetal and newborn death or health impairment from the haemolytic disease. Therefore, mutants or migrants with the rarer vari-ant of the RHD gene could not invade the population and any already existing RhD polymor-phism should be unstable.
It has been suggested that this polymorphism can be stabilized when the disadvantage of carriers of the locally rarer allele is counterbalanced by higher viability of their heterozygote
OPEN ACCESS
Citation:Flegr J (2016) Heterozygote Advantage Probably Maintains Rhesus Factor Blood Group Polymorphism: Ecological Regression Study. PLoS ONE 11(1): e0147955. doi:10.1371/journal. pone.0147955
Editor:Calogero Caruso, University of Palermo, ITALY
Received:October 13, 2015
Accepted:January 11, 2016
Published:January 26, 2016
Copyright:© 2016 Jaroslav Flegr. This is an open access article distributed under the terms of the Creative Commons Attribution License, which permits unrestricted use, distribution, and reproduction in any medium, provided the original author and source are credited.
Data Availability Statement:All relevant data are within the paper and its Supporting Information files.
Funding:Funded by Czech Science Foundation P303/11/1398.
children or by another form of frequency-dependent selection [6]. In the past seven years, sev-eral studies have demonstrated that Rhesus positive and Rhesus negative subjects differ in resistance to the adverse effects of parasitic infections, aging, fatigue and smoking [7–13]. A recently published cross sectional study performed on a cohort of on 3,130 subjects showed numerous associations between Rh negativity and incidence of many disorders. In this study, one hundred fifty four (154) of 225 diseases/disorders were reported by at least 10 subjects. Within this subset, 31 significant associations with RhD negativity (21 positive and 10 nega-tive) were observed [14]. A study performed on 250 blood donors has further shown that resis-tance to the effects of toxoplasmosis is higher in Rhesus positive heterozygotes than in Rhesus positive homozygotes and substantially higher than in Rhesus negative homozogotes [7]. This is the first direct evidence for the role of selection in favour of heterozygotes in stabilization of the RHD gene polymorphism in human populations. Such a mechanism is reminiscent of widely known situations with polymorphism in genes associated with sickle cell anaemia in geographic regions with endemic malaria [15].
RhD protein is a component of a membrane complex of which the function is not quite clear. It is most probably involved in NH3transport and possibly also in CO2transport [16,17]. The complex is associated with spectrin-based cytoskeleton and therefore plays an important role in maintaining the typical shape (biconcave discoid) of human erythrocytes [18]. The “European”RhD- variant of the RHD gene carries a deletion covering the entire protein-cod-ing part of the gene [1]. Therefore, no product of this allele is synthetized in the cells of RhD negative homozygotes and the RhD is most probably substituted in the corresponding molecu-lar complex by the related protein RhCE. Therefore, erythrocytes of RhD- and RhD+ homozy-gotes differ in molecular complexes on their cell membranes and probably also in their biological activities. An important difference was also observed between erythrocytes of RhD positive homozygotes and heterozygotes. About 33,560 and 17,720 D antigen sites were detected on the surfaces of an erythrocyte in RhD homozygotes and heterozygotes, respectively [18]. This suggests that the susceptibility of RhD positive homozygotes and RhD positive het-erozygotes (and even more so RhD negative homozygotes) to various aberrant conditions, including various diseases, could differ dramatically. Due to the general trade-off principle, het-erozygotes could be more resistant to one disease and more prone to another disease while the opposite could be true for homozygotes. Such trade-offs could explain the heterozygote advan-tage hypothesis and all other observed phenomena.
The frequencies of Rhesus negative subjects (and therefore also Rhesus positive heterozy-gotes) as well as the incidences of particular diseases and disorders vary between countries. If the protective effect of Rhesus positivity or Rhesus heterozygosity is strong enough, then the relationship between the frequencies of Rhesus negative homozygotes (and Rhesus positive heterozygotes) should correlate with the incidences of specific diseases when important con-founding variables are controlled. This could be either because the incidences of particular dis-ease influence the geographic distribution of RhD alleles, or because the differences in
prevalence of particular phenotypes influence the incidences of particular diseases. Here, I have studied the correlation of disease burden estimates compiled by the WHO with the fre-quencies of Rhesus negative homozygotes and Rhesus positive heterozygotes in a set of 65 countries for which the data on the frequencies of Rhesus-negative individuals are available.
The specific aims of present study (the hypothesis to be tested] are:
Hypothesis 1: The frequency of Rh negative homozygotes in particular countries correlates (mostly positively) with the incidence of some health disorder in these countries
Hypothesis 3:. The relation of the incidence of health disorders with frequency of Rh negative and Rh positive heterozygotes are mostly in opposite directions.
Materials and Methods
Sources of Data
The data on disease burdens were obtained from the table“Mortality and Burden of Diseases Estimates for WHO Member States in 2004,”which was published by the WHO [19] and are available at:www.who.int/evidence/bod. Because of the expected effects of the frequencies of the Rhesus factor genotypes on the age structures of the populations, the age-non-standardized disease burden data were used. The frequencies of Rhesus negative homozygotes in particular countries [20] were taken from the internet compilation by RhesusNegative.net available at http://www.Rhesusnegative.net/themission/bloodtypefrequencies/from December, 22ndof 2013 and from the monograph of Mourant [21]. The frequencies of Rhesus positive heterozy-gotes were calculated from the frequencies of Rhesus negative homozyheterozy-gotes using the Hardy-Weinberg equation. The geographical latitude and the annual mean of relative humidity for particular countries were derived using the data available athttp://data.worldbank.org/ indicator/NY.GDP.PCAP.CD(accessed December, 10thof 2013) andhttp://www.climatemps. com/(accessed April, 2ndof 2013). The medical care expenditure expenses per capita were obtained fromhttp://data.worldbank.org/indicator/SH.XPD.PCAP(accessed March, 2ndof 2014). The frequencies of smokers in the populations were calculated as the arithmetic mean from men and women; data available athttp://www.who.int/tobacco/mpower/mpower_ report_prevalence_data_2008.pdf(accessed February, 21stof 2014). All data used in this study are available asS1 Data.
Statistical Methods
Factor analyses and a general linear model (GLM) analysis of the obtained factors were per-formed with Statistica v. 8.0 and all other tests with IBM SPSS v. 21. A factor analysis of the spe-cific disease burden data (principal components method, raw Varimex rotation) was used for data reduction. When the factors were extracted from the mortality rate variables, the diseases with not enough data were excluded and the missing data were substituted with means. The Dis-ability Adjusted Life Year (DALY) data for nearly all diseases except trypanosomiasis, Chagas disease, and onchocerciasis were available for all countries in my data set. All factors with eigenvalues>1.0 were extracted. Type III sum of squares and models including the intercept
were used in the GLM (multivariate and multiple-multivariate) analyses; for details, see [22].
Results
Association between Disease Burden and Frequencies of RhD
Genotypes
Mortality and morbidity data for more than one hundred diseases are available in the WHO database [19]. A search for associations between Rhesus genotype and particular diseases would necessarily result in many spurious associations. Therefore, factor analysis was initially used for data reduction. Performing this analysis on 125 diseases and burden of disease catego-ries yielded 23 factors with eigenvalues>1.0, together explaining 85% of the variability in
in a state of poor health or disability”. Next, a multiple multivariate analysis was performed with these 23 factors as dependent variables and frequencies of Rhesus negative homozygotes, Rhesus positive heterozygotes and also five potential confounding variables: GDP, latitude (dis-tance from the equator), humidity, medical care expenditure per capita and frequencies of smokers in the population for 65 countries with the RhD genotype frequency data as indepen-dent variables. The effects of the frequency of RhD heterozygotes (μ2= 0.67,P= 0.013), smok-ers (μ2= 0.75,P= 0.001), latitude (μ2= 0.71,P= 0.005), and humidity (μ2= 0.64,P= 0.027) but not frequency of RhD negative homozygotes (μ2= 0.60,P= 0.070), GDP (μ2= 0.42,
P= 0.635) and medical care expenditure (μ2= 0.23,P= 0.991) were significant. This model explained considerable parts of variability in factors 1–3, 6–8, 11, and 22 (adjustedR2= 0.372, 0.771, 0.497, 0.461, 0.197, 0.237, 0.224, and 0.296, respectively). Post hoc simple multivariate analyses showed that the frequency of Rhesus negative homozygotes correlated with five of 23 factors that together explained 17.7% of variability between different countries in DALY (Table 1). Similarly, the frequency of RhD positive heterozygotes significantly correlated with six factors that together explained 13.9% of variability between different countries in DALY. Three correlations of 23 factors with frequency of RhD positive homozygotes and one with RhD negative homozygotes remained significant even after the correction for multiple tests [23]. Moreover, the expected number of false significant results for 23 statistical tests was not 5.5 but 1.2, suggesting that most of the positive results were not simply due to multiple compar-isons. In accord with the heterozygote advantage hypothesis, the regression coefficients (B -val-ues) for Rhesus negative homozygotes and Rhesus positive heterozygotes went toward opposite directions whenever any of these correlations was significant.
Correlation between Particular Disease Burdens and Frequencies of
RhD Genotypes
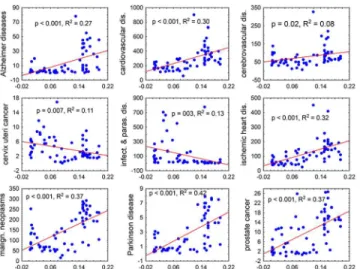
In the exploratory part of the study, univariate correlations analyses showed many strong asso-ciations between disease burdens measured with DALY or with incidences of deaths per popu-lation of 100,000 and the frequencies of Rhesus negative subjects or Rhesus positive
heterozygotes (Fig 1). However, specific disease burdens also strongly correlated with some of the confounding variables, most often with latitude, smoking and humidity. These covariates expressed either highly significant correlation with frequency of Rhesus negative subjects and Rhesus positive heterozygotes (GDP:R= 0.64,P<0.000001, latitude:R= 0.65,P<0.000001,
medical care expenditure per capita:R= 0.68,P<0.000001, frequencies of smokers in the
pop-ulation:R= 0.34,P<0.001; Spearman correlation), or a trend (humidity:R= -0.19,P= 0.132).
Table 1. Correlations of 23 independent factors explaining 85% of variability in disease burden with the frequencies of RhD genotypes.
RhD genotypes Confounding variables
RhD negat. RhD heteroz. HDP Latitude Humidity Medic. care Smokers
Factor 1 Beta -0.385 0.697 -0.527 -0.335 0.261 0.336 -0.224
(29.5%) P 0.337 0.058 0.053 0.081 0.028* 0.187 0.157
Factor 2 Beta -0.576 0.138 -0.063 -0.069 -0.139 -0.329 -0.168
(10.1%) P 0.020* 0.528 0.695 0.545 0.053 0.035 0.080
Factor 3 Beta -0.363 0.388 -0.465 0.439 0.033 -0.326 0.377
(7.5%) P 0.313 0.233 0.056 0.012 0.750 0.154 0.009
Factor 4 Beta -0.595 0.474 -0.265 0.331 0.138 0.050 0.063
(5.4%) P 0.245 0.304 0.436 0.172 0.352 0.875 0.752
Factor 5 Beta 0.240 -0.229 -0.199 0.286 -0.096 -0.074 -0.258
(3.9%) P 0.645 0.626 0.567 0.248 0.525 0.821 0.210
Factor 6 Beta -0.122 0.996 0.463 -0.725 0.219 -0.233 0.162
(3.8%) P 0.742 0.004* 0.065 0.000* 0.046* 0.322 0.269
Factor 7 Beta 1.593 -1.524 -0.035 0.159 -0.038 0.057 -0.268
(2.9%) P 0.001* 0.000* 0.908 0.458 0.773 0.840 0.134
Factor 8 Beta 0.841 -0.985 -0.216 0.005 0.036 -0.225 -0.259
(2.6%) P 0.061 0.016* 0.464 0.982 0.778 0.420 0.138
Factor 9 Beta 1.148 -0.962 -0.335 -0.449 -0.014 0.301 -0.092
(2.2%) P 0.019* 0.029* 0.294 0.050 0.919 0.319 0.622
Factor 10 Beta -0.159 0.093 0.148 0.017 0.206 -0.135 -0.183
(2.0%) P 0.757 0.840 0.665 0.944 0.171 0.677 0.364
Factor 11 Beta 0.658 -1.184 0.160 0.309 -0.071 -0.244 -0.021
(1.8%) P 0.143 0.005* 0.591 0.146 0.582 0.387 0.904
Factor 12 Beta 0.062 -0.210 -0.084 0.582 -0.162 -0.215 -0.033
(1.6%) P 0.898 0.632 0.795 0.014 0.254 0.484 0.861
Factor 13 Beta -1.008 0.576 0.520 0.201 -0.246 -0.112 0.141
(1.5%) P 0.042* 0.193 0.113 0.384 0.087 0.717 0.459
Factor 14 Beta 0.634 -0.229 -0.191 -0.338 -0.027 -0.096 -0.096
(1.3%) P 0.201 0.607 0.561 0.150 0.849 0.758 0.619
Factor 15 Beta 0.457 -0.128 -0.674 0.028 -0.020 0.323 -0.360
(1.3%) P 0.341 0.767 0.039 0.903 0.887 0.287 0.059
Factor 16 Beta -0.812 0.718 0.194 0.196 -0.238 -0.092 -0.008
(1.2%) P 0.107 0.114 0.560 0.406 0.104 0.771 0.966
Factor 17 Beta 1.040 -0.643 0.000 -0.303 0.351 -0.064 -0.131
(1.1%) P 0.033* 0.139 1.000 0.183 0.014 0.831 0.484
Factor 18 Beta -0.159 0.199 -0.209 0.178 -0.186 0.217 -0.026
(1.1%) P 0.758 0.669 0.545 0.466 0.219 0.506 0.897
Factor 19 Beta -0.543 0.791 -0.054 -0.572 0.190 0.079 0.473
(1.0%) P 0.269 0.078 0.868 0.016 0.185 0.798 0.017
Factor 20 Beta 0.032 0.086 -0.296 -0.418 0.081 0.286 0.402
(1.0%) P 0.948 0.849 0.379 0.083 0.582 0.369 0.045
Factor 21 Beta 0.651 -0.314 -0.367 0.008 0.033 0.086 -0.296
(1.0%) P 0.204 0.496 0.283 0.974 0.824 0.789 0.142
Factor 22 Beta -0.761 0.382 0.651 -0.219 0.410 -0.277 0.245
(0.8%) P 0.077 0.320 0.025 0.276 0.002* 0.303 0.145
Factor 23 Beta -0.491 0.954 -0.134 -0.565 0.292 0.097 0.430
(0.8%) P 0.303 0.030* 0.673 0.015 0.038 0.748 0.024
Thefirst column shows (in parentheses) the percentages of variability between countries in the total disease burden (DALY) explained by a particular factor. The columns 3–9 show partial correlation (Beta) and statistical significance (P) of the correlations between the factors 1–23 and the frequencies of RhD- homozygotes, RhD+ heterozygotes, HDP, latitude, humidity, medical care expenditure per capita, and frequencies of smokers in the population. Significant results (P<0.05) and trends (P<0.10) are printed in bold. Asterisks indicate results significant in two-sided tests after the correction for multiple test. Values<0.0005 are coded as 0.000.
significant results for 436 statistical tests was not 65 but 22, however, due to the complicated network of correlation between incidence (or morbidity) of particular diseases (which did not exist between non-correlated factors obtained by the factor analysis) it was not possible to per-form an unbiased per-formal correction for multiple tests (Garcia 2004) [23].
Discussion
The results of the ecological regression analysis were in a perfect agreement with all threea pri-orihypotheses. They showed that both the frequencies of Rhesus negative homozygotes as well as those of the Rhesus positive heterozygotes correlated (mostly in the opposite direction) with specific disease burdens. The general pattern was that the countries with a high frequency of Rhesus negative homozygotes had lower congenital-anomalies-associated burden and neuro-psychiatric condition-associated burden (except Alzheimer’s and Parkinson’s Disease burden) as well as higher cardiovascular and especially malignant neoplasm-associated burden. Notice-ably, the only form of cancer expressing a clear opposite trend was cervix uteri cancer, i.e. can-cer of viral origin.
Many (but not all) of the disorders observed to be affected by RhD phenotype, such as cardio-vascular diseases, lung cancer, liver cancer, asthma, could be considered as“modern”diseases. It is therefore questionable whether they could shape the geographical distribution of RhD allele in the past. However, the RhD minus allele (the deletion) has probably spread from one geographic location in western Europe also relatively recently, definitively after the colonization of Europe by modernHomo sapiens sapiens. It is highly probable that in this time people suffered from liver cancer induced by mycotoxins, from lung cancer, from asthma induced by smoke, and after the loss of the skin melanin also from skin cancer in a similar rate as today’s humans.
The results of the current study agree with observations of worse health status of Rhesus negative subjects reported by earlier case control studies [12,13] or observed in the large cohort study performed on a population of 3,130 subjects [14]. However, the results of the ecological regression and the case-control or cohort studies are difficult to compare. For example, in the Fig 1. Correlation of the frequencies of Rhesus negative subjects in 65 countries with the mortality rates for nine diseases or disease categories.The x and y axes show the frequency of Rhesus negative homozygotes in the population of a country and mortality (numbers of deaths per population of 100,000), respectively. The figures represent the results of the Pearson correlation analysis, namely the level of significance (P) and the coefficient of determination, i.e. the fraction of a country’s variability of the specific mortality rate that can be explained by the differences within the frequencies of Rhesus negative subjects.
Table 2. Correlation between the frequencies of Rhesus factor genotypes and specific disease burden.
mortality DALY
RhD-negatives heterozygotes RhD-negatives heterozygotes
B p Eta2 B p Eta2 B p Eta2 B p Eta2
All Causes 4463.26 0.051 0.051 -1579.49 0.120 0.120 52091.6 0.497 0.497 -14033.2 0.683 0.023
Communicable, maternal, perinatal & nutritional conditions
608.73 0.696 0.696 -308.57 0.659 0.659 21617.7 0.700 0.700 -6913.73 0.783 0.061
A. Infectious and parasitic dis. 581.09 0.509 0.509 -351.51 0.375 0.375 17081.7 0.567 0.567 -9732.23 0.468 0.114
Tuberculosis -12.27 0.919 0.919 13.88 0.798 0.798 344.41 0.905 0.905 93.89 0.942 0.137
STDs excluding HIV 19.25 0.633 0.633 -9.06 0.603 0.603 25.15 0.983 0.983 -104.96 0.846 0.044
Syphilis 68.86 0.726 0.726 -18.29 0.731 0.731 202.15 0.832 0.832 -136.97 0.749 0.001
Chlamydia -140.91 0.510 0.510 19.05 0.842 0.062
Gonorrhoea -206.81 0.444 0.444 47.57 0.694 0.141
HIV/AIDS 365.93 0.274 0.274 -222.41 0.141 0.141 8820.72 0.336 0.336 -5910.93 0.154 0.125
Diarrhoeal diseases 141.75 0.605 0.605 -38.77 0.749 0.749 3421.41 0.680 0.680 -609.46 0.870 0.030
Childhood-cluster diseases -18.66 0.862 0.862 4.51 0.922 0.922 -43.77 0.987 0.987 -231.72 0.847 0.030
Pertussis -130.66 0.452 0.452 28.71 0.630 0.630 164.18 0.887 0.887 -89.30 0.864 0.022
Poliomyelitis 12.94 0.590 0.590 -23.47 0.594 0.594 -4.77 0.674 0.674 0.93 0.878 0.037
Diphtheria 24.53 0.917 0.917 -34.58 0.648 0.037
Measles -59.71 0.766 0.766 36.99 0.526 0.526 -5962.72 0.615 0.615 2593.09 0.403 0.001
Tetanus -145.36 0.238 0.238 27.80 0.382 0.382 -4955.75 0.130 0.130 1028.00 0.222 0.005
Meningitis 30.07 0.468 0.468 -14.51 0.436 0.436 790.37 0.570 0.570 -328.56 0.599 0.063
Hepatitis B 13.74 0.304 0.304 -7.62 0.207 0.207 235.12 0.371 0.371 -90.24 0.445 0.058
Hepatitis C 15.22 0.132 0.132 -8.29 0.084 0.084 262.78 0.068 0.068 -131.07 0.055 0.124
Malaria -2608.0 0.292 0.292 664.47 0.293 0.293 -32353.1 0.302 0.302 6622.57 0.486 0.013
Tropical-cluster diseases 59.42 0.761 0.761 -16.67 0.818 0.818 -10929.5 0.114 0.114 3189.37 0.132 0.000
Leishmaniasis -609.77 0.857 0.857 -144.33 0.877 0.028
Lymphaticfilariasis 2425.38 0.778 0.778 -883.68 0.675 0.592
Leprosy -9.98 0.828 0.828 2.37 0.847 0.847 10.23 0.961 0.961 3.39 0.958 0.134
Dengue -1841.32 0.165 0.165 420.93 0.185 0.688
Intestinal nematode infections -1025.99 0.544 0.544 42.68 0.930 0.000
Ascariasis -837.39 0.624 0.624 2.60 0.996 0.011
Trichuriasis 127.63 0.746 0.746 -32.78 0.796 0.001
Hookworm dis. 513.99 0.132 0.132 -281.45 0.020* 0.004
B. Respiratory infections 41.00 0.914 0.914 -34.59 0.839 0.839 3311.07 0.761 0.761 -197.17 0.968 0.037 Lower respiratory infections 31.50 0.933 0.933 -30.25 0.857 0.857 3171.15 0.766 0.766 -159.78 0.973 0.040
Upper respiratory infections 11.90 0.288 0.288 -3.51 0.395 0.395 237.87 0.358 0.358 -80.69 0.486 0.022
Otitis media 14.26 0.300 0.300 -3.65 0.378 0.378 -100.69 0.078 0.078 44.79 0.081 0.033
C. Maternal conditions 32.59 0.675 0.675 -15.56 0.647 0.647 -91.82 0.979 0.979 225.39 0.888 0.108
D. Perinatal conditions -5.35 0.987 0.987 55.82 0.699 0.699 431.32 0.974 0.974 2378.76 0.687 0.000
Prematurity and low birth weight -30.27 0.761 0.761 34.53 0.441 0.441 -871.28 0.828 0.828 1268.44 0.482 0.002
Birth asphyxia, birth trauma 3.29 0.969 0.969 10.89 0.778 0.778 392.87 0.927 0.927 737.27 0.701 0.000
Neonatal infections, other conditions 23.23 0.873 0.873 9.76 0.881 0.881 916.91 0.859 0.859 371.32 0.873 0.001
E. Nutritional deficiencies -23.46 0.694 0.694 27.27 0.312 0.312 885.51 0.830 0.830 414.13 0.823 0.004
Protein-energy malnutrition -15.19 0.783 0.783 25.57 0.290 0.290 2046.99 0.458 0.458 10.06 0.993 0.038
Iodine deficiency 1216.02 0.592 0.592 -356.80 0.715 0.076
Iron-defic. anaemia 2.32 0.898 0.898 -0.98 0.905 0.905 133.93 0.896 0.896 -112.07 0.808 0.002
Noncommunicable diseases 3221.80 0.013* 0.013 -1031.20 0.072 0.072 9548.75 0.445 0.445 -1388.36 0.804 0.003
A. Malignant neoplasms 1106.24 0.015* 0.015 -416.93 0.039* 0.039 9605.19 0.010* 0.010 -3392.94 0.038* 0.029
Mouth, oropharynx cancers 36.03 0.151 0.151 -10.67 0.340 0.340 458.89 0.126 0.126 -140.61 0.292 0.050
Oesophagus cancer 49.52 0.173 0.173 -26.67 0.105 0.105 435.41 0.161 0.161 -229.67 0.102 0.002
Stomach cancer 35.33 0.644 0.644 -44.36 0.201 0.201 304.99 0.584 0.584 -368.76 0.145 0.088
Colon and rectum cancers 177.64 0.024* 0.024 -54.95 0.114 0.114 1563.50 0.012* 0.012 -534.09 0.051 0.026
Table 2. (Continued)
mortality DALY
RhD-negatives heterozygotes RhD-negatives heterozygotes
B p Eta2 B p Eta2 B p Eta2 B p Eta2
Liver cancer 143.94 0.025* 0.025 -115.37 0.000* 0.000 1540.22 0.020* 0.020 -1209.85 0.000* 0.003
Pancreas cancer 23.32 0.449 0.449 -13.16 0.342 0.342 165.17 0.467 0.467 -89.66 0.380 0.035
Trachea, bronchus, lung cancers 317.74 0.002* 0.002 -128.33 0.005* 0.005 2570.22 0.002* 0.002 -978.02 0.008* 0.015
Melanoma, other skin cancers 35.96 0.009* 0.009 -3.28 0.582 0.582 285.96 0.018* 0.018 -20.61 0.694 0.193
Breast cancer 49.26 0.161 0.161 -0.05 0.997 0.997 718.77 0.037* 0.037 -97.18 0.517 0.260
Cervix uteri cancer -34.38 0.143 0.143 25.34 0.019* 0.019 -511.32 0.137 0.137 390.70 0.014* 0.217
Corpus uteri cancer 4.58 0.547 0.547 1.71 0.616 0.616 22.83 0.820 0.820 18.53 0.681 0.162
Ovary cancer 17.00 0.123 0.123 -1.70 0.727 0.727 173.75 0.167 0.167 -24.56 0.660 0.304
Prostate cancer 13.16 0.740 0.740 11.42 0.522 0.522 184.43 0.357 0.357 40.41 0.651 0.343
Bladder cancer 48.05 0.052 0.052 -10.86 0.318 0.318 331.71 0.173 0.173 -82.05 0.449 0.055
Lymphomas, multiple myeloma 52.83 0.051 0.051 -12.66 0.288 0.288 494.94 0.324 0.324 -55.78 0.803 0.022
Leukaemia 40.72 0.040* 0.040 -10.21 0.241 0.241 239.53 0.590 0.590 -24.76 0.901 0.149
B. Other neoplasms -2.62 0.927 0.927 -0.58 0.964 0.964 -56.16 0.866 0.866 23.27 0.876 0.077
C. Diabetes mellitus -52.56 0.640 0.640 36.84 0.467 0.467 -1924.45 0.201 0.201 894.94 0.186 0.022
D. Endocrine disorders 9.97 0.732 0.732 -1.54 0.906 0.906 171.04 0.855 0.855 350.54 0.406 0.001
E. Neuropsychiatric conditions 139.91 0.312 0.312 -91.98 0.142 0.142 -10094.1 0.010* 0.010 3931.60 0.023* 0.047
Unipolar depressive disorders -2.03 0.668 0.668 1.49 0.516 0.516 -5743.30 0.008* 0.008 2139.73 0.025* 0.021
Bipolar disorder -473.79 0.017* 0.017 200.50 0.023* 0.092
Schizophrenia -3.12 0.374 0.374 1.08 0.535 0.535 -720.33 0.057 0.057 225.20 0.180 0.032
Epilepsy 8.46 0.463 0.463 -1.54 0.768 0.768 -739.99 0.031* 0.031 343.99 0.026* 0.173
Alcohol use dis. -9.51 0.641 0.641 5.02 0.583 0.583 148.18 0.947 0.947 -603.40 0.547 0.059
Alzheimer’s Disease and other dementias 88.88 0.486 0.486 -70.96 0.223 0.223 1953.45 0.037* 0.037 -989.15 0.020* 0.032
Parkinson’s Disease 9.53 0.395 0.395 -2.94 0.564 0.564 603.60 0.005* 0.005 -220.07 0.020* 0.011
Multiple sclerosis 2.01 0.512 0.512 0.90 0.546 0.546 30.68 0.427 0.427 13.06 0.451 0.113
Drug use disorders 8.21 0.673 0.673 -3.21 0.728 0.728 -1158.69 0.318 0.318 654.28 0.211 0.026
Post-traumatic stress disorder 110.89 0.016* 0.016 -52.89 0.011* 0.092
Obsessive-compulsive disorder -739.14 0.001* 0.001 409.32 0.000* 0.055
Panic disorder -159.65 0.065 0.065 70.83 0.068 0.051
Insomnia (primary) -74.88 0.571 0.571 43.72 0.462 0.145
Migraine -696.86 0.059 0.059 372.64 0.026* 0.044
F. Sense organ diseases -1.49 0.911 0.911 0.33 0.929 0.929 2782.16 0.271 0.271 -2730.55 0.019* 0.000
Glaucoma 273.19 0.312 0.312 -246.13 0.047* 0.033
Cataracts 709.86 0.513 0.513 -755.56 0.126 0.000
Refractive errors -472.53 0.717 0.717 -326.63 0.577 0.009
Hearing loss 1771.92 0.064 0.064 -1048.53 0.016* 0.003
Macular degeneration -17.09 0.227 0.227 3.15 0.351 0.351 498.59 0.043* 0.043 -353.68 0.002* 0.016
G. Cardiovascular diseases 1812.61 0.043* 0.043 -463.67 0.240 0.240 7892.79 0.236 0.236 -1449.94 0.625 0.016
Rheumatic heart dis. 22.92 0.270 0.270 -8.31 0.372 0.372 67.06 0.889 0.889 -20.96 0.922 0.061
Hypertensive heart disease -13.67 0.910 0.910 28.35 0.601 0.601 -124.58 0.890 0.890 258.89 0.524 0.034
Ischaemic heart dis. 909.98 0.089 0.089 -119.30 0.613 0.613 3863.87 0.326 0.326 97.52 0.956 0.008
Cerebrovascular dis. 671.19 0.041* 0.041 -342.99 0.021* 0.021 3301.30 0.104 0.104 -1992.71 0.031* 0.016
Inflammatory heart diseases 52.64 0.160 0.160 -13.68 0.412 0.412 620.14 0.263 0.263 -153.31 0.535 0.003
H. Respiratory diseases 273.81 0.171 0.171 -156.44 0.084 0.084 4593.75 0.091 0.091 -1208.54 0.316 0.032
Chronic obstruct. pulmonary dis. 309.36 0.096 0.096 -151.56 0.071 0.071 5494.85 0.020* 0.020 -1688.29 0.106 0.026
Asthma 22.89 0.180 0.180 -15.82 0.042* 0.042 -479.61 0.411 0.411 332.56 0.207 0.047
I. Digestive diseases -37.82 0.747 0.747 39.04 0.459 0.459 -385.36 0.828 0.828 583.24 0.466 0.001
Peptic ulcer disease 2.04 0.921 0.921 1.65 0.858 0.858 -43.43 0.908 0.908 26.73 0.874 0.019
Cirrhosis of the liver -57.16 0.407 0.407 27.19 0.380 0.380 -785.98 0.465 0.465 418.77 0.386 0.007
case-control and cohort studies, but not the ecologic regression study, the effect of RhD nega-tivity on the health status is seemingly increased by an opposite effect of RhD heterozygosity on RhD positive controls consisting of both RhD positive heterozygotes and homozygotes. Moreover, a positive correlation between the focal disease burden and the frequency of a par-ticular RhD genotype observed in an ecological regression study could either be due to an increased sensitivity of Rhesus negative individuals toward the focal disease or a relatively higher resistance or tolerance of these subjects toward other diseases. For example, the protec-tive effect of RhD negativity against many neuropsychiatric disorders observed in the present ecological study could be caused by the fact that RhD negative subjects usually die at an earlier age due to their higher susceptibility to cardiovascular diseases.
It is not clear whether the presence of RhD minus allele alone, or the presence of other alleles in a strong genetic linkage with this allele is responsible for the observed protective effect of heterozygosity. For example, in the Czech population about 95% of subjects with D+C+c-E-e+ phenotype are RhD+ homozygotes and only 4.5 RhD+ heterozygotes (Daniels 2002). Table 2. (Continued)
mortality DALY
RhD-negatives heterozygotes RhD-negatives heterozygotes
B p Eta2 B p Eta2 B p Eta2 B p Eta2
Appendicitis -2.45 0.156 0.156 2.08 0.011* 0.011 -45.46 0.113 0.113 36.49 0.006* 0.083
J. Genitourinary diseases -18.19 0.780 0.780 5.86 0.841 0.841 0.47 1.000 1.000 28.95 0.939 0.021
Nephritis, nephrosis -23.42 0.675 0.675 7.94 0.751 0.751 -282.34 0.594 0.594 157.93 0.507 0.015
Benign prostatic hypertrophy -2.51 0.445 0.445 1.10 0.457 0.457 -181.50 0.054 0.054 42.62 0.304 0.003
K. Skin diseases -23.34 0.302 0.302 15.10 0.153 0.153 -215.20 0.258 0.258 62.62 0.461 0.234
L. Musculoskeletal diseases 38.87 0.030* 0.030 -14.29 0.072 0.072 1221.92 0.114 0.114 -755.78 0.032* 0.004
Rheumatoid arthritis -2.43 0.524 0.524 1.77 0.307 0.307 -504.05 0.007* 0.007 282.31 0.001* 0.002
Osteoarthritis -1.00 0.759 0.759 0.87 0.583 0.583 1514.05 0.019* 0.019 -841.91 0.004* 0.011
M. Congenital anomalies -36.87 0.379 0.379 23.63 0.211 0.211 -2618.25 0.204 0.204 1607.50 0.085 0.010
N. Oral conditions 0.64 0.304 0.304 -0.13 0.487 0.487 -1510.95 0.001* 0.001 700.93 0.000* 0.000
Dental caries -1091.04 0.001* 0.001 571.72 0.000* 0.003
Periodontal disease -20.37 0.059 0.059 7.47 0.120 0.081
Edentulism -405.58 0.012* 0.012 123.74 0.079 0.004
Injuries 632.81 0.317 0.317 -239.35 0.398 0.398 20934.32 0.459 0.459 -5738.44 0.651 0.013
A. Unintentional injuries 232.26 0.426 0.426 -67.92 0.603 0.603 9476.62 0.520 0.520 -1787.56 0.786 0.009
Road traffic accidents 150.45 0.261 0.261 -53.89 0.369 0.369 4820.42 0.349 0.349 -1543.85 0.503 0.051
Poisonings 16.17 0.720 0.720 -1.02 0.960 0.960 554.07 0.574 0.574 -69.86 0.874 0.002
Falls 19.76 0.669 0.669 -15.04 0.470 0.470 1560.03 0.374 0.374 -452.64 0.564 0.051
Fires -2.06 0.954 0.954 5.58 0.727 0.727 336.76 0.807 0.807 4.64 0.994 0.001
Drownings 18.11 0.353 0.353 -10.86 0.217 0.217 507.47 0.399 0.399 -238.47 0.378 0.077
Other unintentional injuries 25.04 0.839 0.839 10.49 0.850 0.850 1695.05 0.789 0.789 516.85 0.855 0.001
B. Intentional injuries 341.57 0.310 0.310 -137.64 0.361 0.361 11464.52 0.430 0.430 -3954.03 0.544 0.016
Self-inflicted injuries 78.61 0.140 0.140 -58.21 0.018* 0.018 1215.72 0.290 0.290 -936.88 0.074 0.007
Violence -13.32 0.783 0.783 13.66 0.531 0.531 -748.67 0.726 0.726 575.46 0.549 0.073
War 659.92 0.618 0.618 -166.09 0.752 0.752 10564.67 0.485 0.485 -4469.09 0.495 0.051
The correlations were estimated with the General Linear Model with GDP per capita, latitude, humidity, medical care expenses and frequencies of smokers in the population as covariates. Positive B corresponds to a positive correlation and negative B to a negative correlation between particular Rhesus factor genotype frequency and the specific disease burden. Significant results (p<0.05) and trends (p<0.10) are printed in bold. Asterisks indicate results significant in two-sided tests. p values<0.0005 are coded as 0.000. No formal correction for multiple tests were done in this exploratory part of the study. The effect size is shown as Eta2.
Alternative models for explaining observed associations between RhD phenotype and specific disease burdens based on genetic disequilibrium and gene flow (human history) should be tested in future studies.
Limitations of present study: Onset of disorders associated negatively with the frequency of RhD positive heterozygotes, e.g. liver and lung cancer, is rather high in modern human. It is not clear whether decrease of incidence of such disorders could increase fitness of carriers of this phenotype strongly enough. It must be noted, however, that the results of a previous more sensitive case control study performed on a mostly young population indicate that in addition the incidence of many early-age onset disorders, such as diarrhea, thyroiditis, anemia, panic disorder, and scoliosis, was lower in RhD positive subjects.
The interpretations of ecological regression studies are sometimes complicated, especially if aggregated data are used for the estimation of the strength and direction of the influence of par-ticular factors within a population [24,25]. Therefore, one must be very careful with the inter-pretation of the observed associations between a particular disease burden and the frequency of Rhesus negative subjects within a population. For example, a positive correlation could be due to an increased sensitivity of Rhesus negative individuals to the focal disease or just to higher resistance or tolerance of these subjects to other diseases. Therefore, future studies of the mech-anisms of effects of the Rhesus phenotype on risks of particular diseases must be grounded within individual based (case-control and cohort) studies. However, the objective of the present ecological study was to test the heterozygote advantage hypothesis of maintaining the genetic polymorphism in the RHD gene, resulting in polymorphism of the Rhesus factor phenotypes. Based on this hypothesis, I suggested that the frequencies of Rhesus negative homozygotes as well as Rhesus positive heterozygotes should correlate with certain disease burdens and the direction of such correlation will be the opposite for the two phenotypes. The results of present regression study have confirmed these two predictions.
The frequencies of Rhesus positive heterozygotes were calculated from the frequencies of Rhesus negative homozygotes using the Hardy-Weinberg equation. If the conclusions of the present study are correct, then these theoretical frequencies are influenced by a selection against RhD negative homozygotes and in favor of RhD heterozygotes in middle-age and espe-cially in high-age strata. However, H-W equilibrium is being re-established in every generation and the differences between theoretical and real frequencies for reproductive age-strata are probably relatively low, especially in developed countries.
Conclusions
The study confirmed all three a priori hypotheses: The frequency of Rh negative homozygotes in particular countries correlates (mostly positively) with the incidence of some health disorder in these countries 2) The frequency of Rh positive heterozygotes in particular countries corre-lates (mostly negatively) with the incidence of some health disorder in these countries 3) The direction of the relation of incidence of the health disorder with frequency of Rh negative homozygotes and with Rh positive heterozygotes are mostly (actually always) the opposite.
increased frequency of Rhesus negative homozygotes in a population is therefore usually at least partly compensated for through an increased frequency of heterozygotes. However, from the point of view of human medicine and especially that of an RhD negative individual, the increased risk of a particular disease associated with one genotype is not compensated for through the decreased risk of a disease in individuals with another genotype.
From the point of view of basic science, the most important merit of this study is its robust support of the heterozygote advantage hypothesis. The results suggest that the Rhesus factor polymorphism is maintained in human populations due to a higher resistance or tolerance of heterozygotes against specific diseases. It could be speculated to what extent the highly uneven distributions of RHD minus alleles in world populations might be the result of a founder event and a gene flow [26] and to what extent it is also modulated by specific selection pressures caused by differences in the geographical distribution of a disease or diseases.
Supporting Information
S1 Data. Data file containing frequencies if RhD genotypes, specific disease burdens and confounding variables for 65 countries.
(XLSX)
Acknowledgments
I would like to thank Marek Maly from Department of Statistics, National Health Institute, Prague for his help with the statistics and Mike Dammann and Charlie Nichols for their help with writing the manuscript.
Author Contributions
Conceived and designed the experiments: JF. Performed the experiments: JF. Analyzed the data: JF. Contributed reagents/materials/analysis tools: JF. Wrote the paper: JF. Data compila-tion: JF.
References
1. Wagner FF, Flegel WA (2000) RHD gene deletion occurred in the Rhesus box. Blood 95: 3662–3668. PMID:10845894
2. Haldane JBS (1942) Selection against heterozygosis in Man. Eugenics 11: 333–340. 3. Hogben L (1943) Mutation and the Rhesus reaction. Nature 152: 721–722.
4. Fisher RA, Race RR, Taylor GL (1944) Mutation and the rhesus reaction. Nature 153: 106–106. 5. Li CC (1953) Is the Rh facing a crossroad? A critique of the compensation effect. American Naturalist
87: 257–261.
6. Feldman MW, Nabholz M, Bodmer WF (1969) Evolution of the Rh polymorphism: A model for the inter-action of incompatibility, reproductive compensation and heterozygote advantage AmJHumGenet 21: 171–193.
7. Novotná M, Havlíček J, Smith AP, Kolbeková P, Skallová A, et al. (2008)Toxoplasmaand reaction time: Role of toxoplasmosis in the origin, preservation and geographical distribution of Rh blood group polymorphism. Parasitology 135: 1253–1261. doi:10.1017/S003118200800485XPMID:18752708
8. Flegr J, Novotná M, Lindová J, Havlíček J (2008) Neurophysiological effect of the Rh factor. Protective role of the RhD molecule againstToxoplasma-induced impairment of reaction times in women. Neuro-endocrinology Letters 29: 475–481. PMID:18766148
9. Flegr J, Klose J, Novotná M, Berenreitterová M, Havlíček J (2009) Increased incidence of traffic acci-dents inToxoplasma-infected military drivers and protective effect RhD molecule revealed by a large-scale prospective cohort study. BMC Infectious Diseases 9: art. 72. doi:10.1186/1471-2334-9-72
10. Flegr J, Novotná M, Fialová A, Kolbeková P, Gašová Z (2010) The influence of RhD phenotype on toxo-plasmosis- and age-associated changes in personality profile of blood donors. Folia Parasitologica 57: 143–150. PMID:20608477
11. Flegr J, Preiss M, Klose J (2013) Toxoplasmosis-associated difference in intelligence and personality in men depends on their Rhesus blood group but not ABO blood group. PLoS ONE 8.
12. KaňkováŠ,Šulc J, Flegr J (2010) Increased pregnancy weight gain in women with latent toxoplasmosis and RhD-positivity protection against this effect. Parasitology 137: 1773–1779. doi:10.1017/
S0031182010000661PMID:20602855
13. Flegr J, Geryk J, Volny J, Klose J, Cernochova D (2012) Rhesus factor modulation of effects of smoking and age on psychomotor performance, intelligence, personality profile, and health in Czech soldiers. PLoS ONE 7: e49478. doi:10.1371/journal.pone.0049478PMID:23209579
14. Flegr J, Hoffmann R, Dammann M (2015) Worse health status and higher incidence of health disorders in Rhesus negative subjects. PLoS ONE 10(10): e0141362. doi:10.1371/journal.pone.0141362PMID:
26495842
15. Allison AC (1954) The distribution of the sickle-cell trait in East Africa and elsewhere, and its apparent relationship to the incidence of subtertian malaria- Protection afforded by sickle-cell trait against subter-tian malareal infection. Trans R Soc Trop Med Hyg 48: 312–318. PMID:13187561
16. Kustu S, Inwood W (2006) Biological gas channels for NH3 and CO2: evidence that Rh (rhesus) pro-teins are CO2 channels. Transfusion Clinique et Biologique 13: 103–110. PMID:16563833
17. Flegel WA (2011) Molecular genetics and clinical applications for RH. Transfusion and Apheresis Sci-ence 44: 81–91. doi:10.1016/j.transci.2010.12.013PMID:21277262
18. Le Van Kim C, Colin Y, Cartron JP (2006) Rh proteins: Key structural and functional components of the red cell membrane. Blood Reviews 20: 93–110. PMID:15961204
19. WHO (2008) The Global Burden of Disease: 2004 update. Geneva: World Health Organization. 20. Flegr J, Dama M (2014) Does prevalence of latent toxoplasmosis correlate with nation-wide rate of
traf-fic accidents? Folia Parasitologica 6: 485–494.
21. Mourant AE (1954) The distribution of the human blood groups. Oxford: Blackwell Scientific Publication.
22. Flegr J, Prandota J, Sovickova M, Israili ZH (2014) Toxoplasmosis—A global threat. Correlation of latent toxoplasmosis with specific disease burden in a set of 88 countries. PLoS ONE 9.
23. Garcia LV (2004) Escaping the Bonferroni iron claw in ecological studies. Oikos 105: 657–663. 24. Wakefield J, Salway R (2001) A statistical framework for ecological and aggregate studies. Journal of
the Royal Statistical Society: Series A (Statistics in Society) 164: 119–137.
25. Guthrie KA, Sheppard L (2001) Overcoming biases and misconceptions in ecological studies. Journal of the Royal Statistical Society: Series A (Statistics in Society) 164: 141–154.