Received May 31, 2011 and accepted December 21, 2011. Corresponding author: [email protected]
Relationship between temperament with performance and meat quality of
feedlot steers with predominantly Charolais or Nellore breed
Isabella Dias Barbosa Silveira1, Vivian Fischer2, Luis Henrique Ebling Farinatti3, João Restle4, Dari Celestino Alves Filho3, Luís Fernando Glasenapp de Menezes5
1Departamento de Zootecnia, Universidade Federal de Pelotas, Pelotas, RS, Brasil, 96010-610.
2Departamento de Zootecnia, Universidade Federal do Rio Grande do Sul, Porto Alegre, RS, Brasil, 91540-000. 3Departamento de Zootecnia, Universidade Federal de Santa Maria, Santa Maria, RS, Brasil, 97105-900. 4Departamento de Zootecnia, Universidade Federal de Goiás, Goiás, RS, Brasil.
5Universidade Federal Tecnológica do Paraná, Dois Vizinhos, PR, Brasil, 85660-000.
ABSTRACT - The relation between temperament with performance and meat quality was determined in 79 Charolais × Nellore steers kept in feedlot. Temperament was evaluated according to exit velocity, scale composite score and flight distance four times in the finishing phase, along with body weight, intake and feed conversion measures. Cattle were classified as calm, intermediate and excited according to exit velocity measures at the beginning of the trial. Excited cattle presented larger values for composite score and flight distance. Irrespective of genotype, excited cattle presented lower average daily gain, dry matter intake and worse feed conversion. Temperament categories did not affect most of beef quality traits, except for calm Bos indicus steers, which presented greater pH measured 1 hour post mortem compared with more reactive steers. However, moderate but negative correlations were detected between exit velocity, flight distance and composite score and beef quality as well as Warner-Bratzler shear value, luminosity, pH measured 24 hours post mortem, although they were not consistent between genotypes raised under the same conditions.
Key Words: cattle, intake, meat characteristics, temperament, weight gain www.sbz.org.br
Introduction
Temperament can be defined as the animal reaction to the human contact, and is generally attributed to fear (Fordyce et al., 1982). It is an important characteristic for beef cattle production systems, with practical and economical consequences (Grandin, 1980). Animals with poor temperament may become excited and excessively stressed, and might be more likely to injure themselves during routine handling (Grandin & Deesing, 1998).
In intensive production systems, the evaluation of beef cattle temperament is important because of the frequent handling imposed to the animals as weighing, sanitary control and reproduction, besides considerable restrictions of movement and execution of activities of their behavioral range (Grandin, 1993).
Greater weight gains (Voisinet et al., 1997a; Müller & von Keyserlingk, 2006; Barbosa-Silveira et al., 2008a) have been observed for calmer animals, probably due to greater feed intake (Brown et al., 2004) or better feed efficiency (Petherick et al., 2002). Highly agitated or flighty animals yield tougher meat (Voisinet et al., 1997b; King et al., 2006; Kadel et al., 2006) and present higher losses of meat due to bruising (Fordyce et al., 1988b). However, Kabuga & Appiah
(1992) and Barbosa-Silveira et al. (2008a) did not verify differences for weight gain between genetic groups of Bos taurus and Bos indicus crossbred steers. These authors suggested that management ease was more influenced by raising conditions and previous management experience than by genetic basis. However, reports on phenotypic relations between temperament and growth have been inconsistent, with some showing no significant correlation. Other reports have showed low phenotypic correlations between temperament and meat quality traits, except for shear force (Reverter et al., 2003; Kadel et al., 2006; Behrends et al., 2009; Muchenje et al., 2009).
Under Brazilian conditions, steer finishing is usually carried out on pastures. However, factors such as farm size, availability of agricultural byproducts and climatic limitations make feedlot finishing possible. Another characteristic is the predominant use of Nellore breed (Bos indicus) and the crossbreeding with European breeds aiming to increase the performance and meat quality.
Material and Methods
Seventy-nine steers averaging 19 months, taken at random from the herd of Universidade Federal de Santa Maria, were used to evaluate temperament and meat quality. Steers were raised on natural range, in an extensive grazing system, with sparse contact with humans. Eight Charolais (C) × Nellore (N) genetic groups were represented: C (1.00 C); 0.75 C (3/4C × 1/4N); 0.69 C (11/16C × 5/16N); 0.63C (5/8C × 3/8N); 0.38 C (3/8C × 5/8N); 0.31 C (5/16 × C 11/16N); 0.25 C (1/4C × 3/4N) and N (0 C).
Steers were allocated to feedlot pens with 40 m2, in groups of 3-4 animals, with three replications for each genotype. Intensive finishing period lasted 97 days; the first 14 days for adaptation. The diet was calculated to allow an average daily gain (ADG) of 1.15 kg (NRC, 1996), containing 123 g/kg of crude protein (CP), 12.6 MJ of digestible energy/kg dry matter and 583 g/kg of neutral detergent fiber (NDF). The energy content of the diet was estimated by equations proposed by the National Research Council (2001). Corn silage contributed with 520 g/kg of total dry matter. Concentrate was composed of 940 g/kg wheat meal, 15 g/kg urea, 36 g/kg lime, 9 g/kg salt and monensine. The diet was offered twice daily to allow 10% of leftovers. Each morning, prior to feeding, residues from the previous day were removed and weighed for adjustment of food offer and for calculations of feed intake and conversion.
Animals were weighed after fast of 14 hours at the beginning and end of the experimental period, and every 21 days in between. Temperament was evaluated through the assessment of a composite score (Piovesan, 1998), flight time (Burrow & Dillon, 1997), flight distance (Boivin et al., 1992) and facial whorl position (Grandin et al., 1995). The composite score was performed during individual weighing of animals, 10 seconds after entering in the scale box. This score was based on the assessment of the following behaviors: number of movements in scale, audibility of respiration, presence/absence of kicks. This procedure was performed four times (on days 14, 34, 55 and 76 of the experimental period). Those evaluations will be referred as composite score 1, composite score 2, composite score 3, and composite score 4. Scores were assigned as follows: 1= calm, no movement, no audible respiration; 2 = restless, shifting; 3 = squirming, occasional shaking of the scale, occasional audible respiration; 4 = continuous vigorous movement and shaking of the scale, audible respiration; 5 = continuous vigorous movement and shaking of the scale, plus rearing, twisting or violently struggling, audible
respiration. In the flight time test, the time to break two infra-red beams set 2 m apart, immediately after leaving the crush, was measured with a manual chronometer (model Kenko, precision 1/100 s). Flight time was performed four times, on days 14, 34, 55 and 76 during the experimental period. After, those values were transformed into exit velocity by dividing the distance traveled (2 m) by the flight time values for each steer on each evaluation. In the text, these exit velocities evaluations will be referred as exit velocity 1, exit velocity 2, exit velocity 3, and exit velocity 4. The flight distance test was done in a yard, whose floor was demarcated in 1 × 1 m squares to allow visual determination of the distance at which the animal stepped away as the human approached. Flight distance was performed three times, on days 34, 55 and 76 of the experimental period. In the text, these evaluations will be referred as flight distance 2, flight distance 3, and flight distance 4. Facial whorl position was evaluated by observation of its localization in the animal face, relative to the median eye line. Whorls located below, at, above or well above the eye line, received position values of 1, 2, 3 and 4, respectively.
Sierra (1973). Samples of 5 g were collected from the longissimus dorsi, 24 h post slaughter. These were finely minced and placed between two filter papers of 12.5 cm diameter, disposed on Petri plates, and pressed by a weight of 2.25 kg for 5 minutes. Finally, samples were weighed again and the difference between the two weights was assumed to be the quantity of water not retained by the meat. Data were analyzed with the statistical program SAS (Statistical Analysis System, version 6). The eight genotype groups were re-grouped into two groups: predominantly Bos indicus (0.38 C; 0.31 C; 0.25 C; 0 C) and predominantly Bos taurus (1.00 C; 0.75 C; 0.69 C; 63 C). Flight time was transformed into exit velocity values. Temperament (EV1) was used to classify individual animals as calm, intermediate or excited. In each genotype group (n = 2) steers with temperament below the mean value minus half of the standard deviation were classified as calm, those with temperament above the mean value plus half of the standard deviation were classified as reactive and those presenting temperament values in between were classed as intermediate.
Weight gain, meat quality trait data were compared across these temperament categories using PROC GLM procedure of SAS. It was expected that the genotype groups might differ with regard to live weight muscle tenderness gain and other meat quality traits, so the model tested the main effects of temperament category and genotype group as well their interaction. However, genotype groups were not included in the model to draw conclusions regarding genotype groups about productive traits, but rather to determine if temperament effects were consistent across genotypes. Correlation coefficients were generated to examine the relations between temperament traits, meat quality traits and body weight gain using PROC CORR procedures of SAS, Spearman coefficients for categorical data and Pearson for continuous data. For all analyses, least square means were generated for all significant
interactions and main effects not involved in higher-order interactions. When appropriate, these means were separated using the DIFF option. A pre-determined probability of type I error of 0.05 was used for judgment of statistical significance. Analysis of temperament effect on behavioral scores was done by non-parametric analysis of frequencies (chi-square test). Regression equations were generated to examine the relations between temperament attributes, meat quality traits and intake, ADG and feed conversion, using PROC REG option stepwise selection of independent variables procedure of SAS, for the whole data set (n = 79) and for each genotype group (predominantly Bos taurus group n = 33 and Bos indicus group n = 46). All procedures and measurements were in compliance with the Research Committee of the Universidade Federal de Santa Maria, RS.
Results
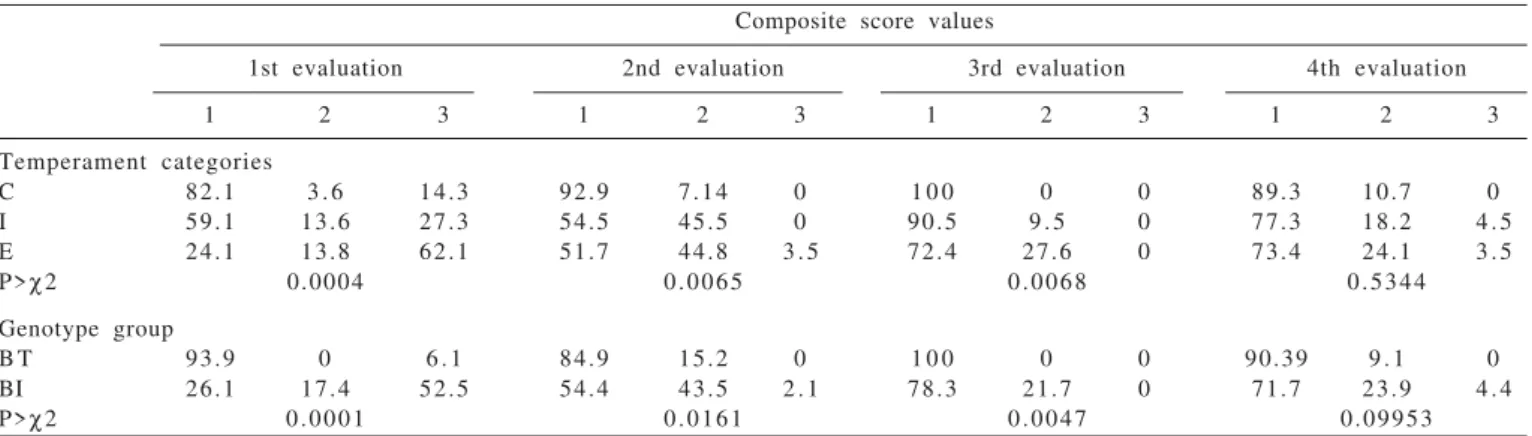
The distribution of animals classified as calm, intermediate and excited was significantly different between genotypes groups (P<0.0335). Among predominantly Bos taurus steers, 17 (51.5%), 8 (24.2%) and 8 (24.2%) were classified, respectively as calm, intermediate and excited (Table 1). However, among predominantly Bos indicus steers, 11 (23.9%), 14 (30.4%) and 21 (45.7%) were classified as calm, intermediate and excited.
The two genotype groups were not included to compare specific breed types, but rather to compare the relationship between temperament and meat quality or animal performance. Differences between temperament categories for most of temperament data were expected to be found.
Excited animals showed higher frequencies of score 2 or 3 than calm animals. Predominantly Bos indicus steers showed higher frequencies of scores 2 and 3 than predominantly Bos taurus steers.
Composite score values
1st evaluation 2nd evaluation 3rd evaluation 4th evaluation
1 2 3 1 2 3 1 2 3 1 2 3
Temperament categories
C 82.1 3 . 6 14.3 92.9 7.14 0 1 0 0 0 0 89.3 10.7 0
I 59.1 13.6 27.3 54.5 45.5 0 90.5 9 . 5 0 77.3 18.2 4 . 5
E 24.1 13.8 62.1 51.7 44.8 3 . 5 72.4 27.6 0 73.4 24.1 3 . 5
P>χ2 0.0004 0.0065 0.0068 0.5344
Genotype group
B T 93.9 0 6 . 1 84.9 15.2 0 1 0 0 0 0 90.39 9 . 1 0
BI 26.1 17.4 52.5 54.4 43.5 2 . 1 78.3 21.7 0 71.7 23.9 4 . 4
P>χ2 0.0001 0.0161 0.0047 0.09953
C - calm; I - intermediate; E - excited; BT - Bos taurus and BI - Bos indicus.
Correlations between the four repetitions of composite score were positive and significant (composite scores 1 and 2: r = 0.41, n = 79, P<0.0001; composite scores 1 and 3: r = 0.29, n = 79, P<0.05; composite scores 1 and 4: r = 0.38, n = 79, P<0.001; composite scores 2 and 3: r = 0.24, n = 79, P<0.05; composite scores 2 and 4: r = 0.38, n = 79, P<0.001; composite scores 3 and 4:r = 0.29, n = 79, P<0.001).
Composite score 1 was significantly correlated to DMI (r = -0.38, n = 79, P<0.0006), feed conversion (r = 0.24. n = 79, P<0.05), ADG (-0.47, n = 79, P<0.0001) and to pH 7 h post mortem (r = 0.22, n = 79, P<0.05).
However, when these relations were analyzed within each genotype group, it could be noticed that these relations were not consistent among genotypes. Among predominantly Bos indicus steers, composite score 1 was related to DMI (r = -0.41, n = 46, P<0.01) and tended to be related to pH 7 h post mortem (r = 0.26, n = 46, P<0.10). Composite score 2 was related to pH 24 h post mortem (r = -0.29, n = 46, P<0.05). Composite score 4 was related to DMI (r = -0.29, n = 46, P = 0.05), to ADG (r = 0.32, n = 46, P<0.05), to yellowness (r = 0.34, n = 46, P<0.05). On the other hand, among predominantly Bos taurus steers, composite score 1 was only related to pH 12 h post mortem (r = 0.44, n = 33, P<0.05). Composites scores 2 and 3 were not related to any studied variables.
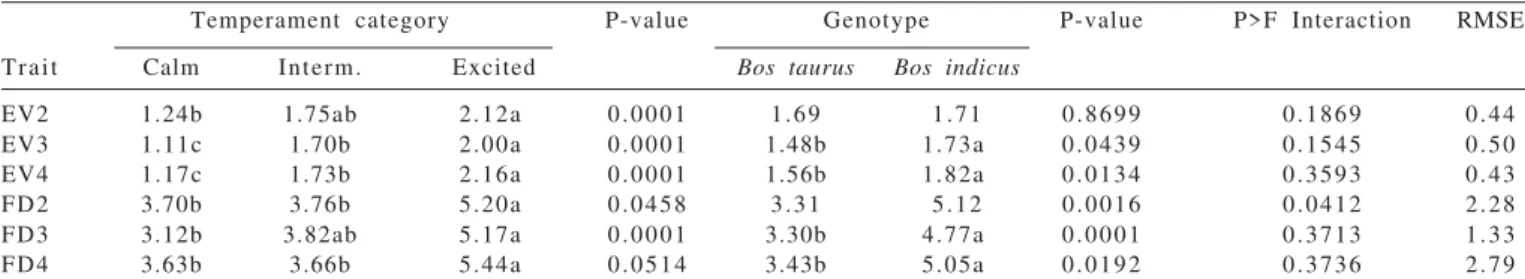
Mean exit velocity values did not significantly change over the evaluation times (P>0.05); it wasconsistent across time: 1.68, 1.65 and 1.71 for evaluations 2, 3 and 4. Calm, intermediate and excited animals showed significantly different, but increasing values for exit velocity (Table 2). This was expected, since temperament categories were created according to exit velocity measured at the first evaluation. Predominantly Bos indicus steers showed higher values for exit velocity measured at evaluations 3 and 4 than for predominantly Bos taurus steers.
Correlations between the four repetitions of exit velocity were highly significant (exit velocity 1 and 2:r = 0.72, n = 79, P<0.0001; exit velocity 1 and 3: r = 0.69, n = 79, P<0.0001; exit velocity 1 and 4: r = 0.76, n = 79, P<0.0001; exit velocity 2
and 3: r = 0.52, n = 79, P<0.0001; exit velocity 2 and 4: r = 0.63, n = 79, P<0.0001; exit velocity 3 and 4: r = 0.71, n = 79, P<0.0001). Exit velocity 1 was significantly correlated to DMI (r = -0.30, n = 79, P<0.01), feed conversion (r = 0.38, n = 79, P<0.01) and ADG (r = -0.54, n = 79, P<0.0001). Exit velocities measured at evaluations 3 and 4 showed similar correlation coefficients to exit velocity 1, while exit velocity 2 was related only to ADG (r = -0.31, n = 79, P<0.05). Exit velocity 3 was significantly related to luminosity (r = -0.25, n = 79, P<0.05).
Among predominantly Bos indicus steers, exit velocity 1 was related to DMI (r = -0.38, n = 46, P<0.01), to ADG (r = -0.38, n = 46, P<0.01) and to pH 1 h post mortem (r = -0.43, n = 46, P<0.01). Exit velocity 3 followed the same trends of exit velocity 1. On the other hand, among predominantly Bos taurus steers, exit velocity 1 was not related to DMI, but was related to feed conversion (r = 0.44, n = 33, P<0.05) and to ADG (r = -0.49, n = 33, P<0.01).
Calm, intermediate and excited animals showed significantly different, but increasing values for flight distance. Mean flight distance value did not significantly change with evaluation times (P>0.05), and was consistent across time: 4.29, 4.19 and 4.25 m for evaluations 2, 3 and 4. On the second evaluation, predominantly Bos taurus steers presented the following flight distance values for animals classified as calm, intermediate and excited: 1.94, 3.75 and 4.25 m; differences between calm and excited animals were significant. Predominantly Bos indicus steers presented flight distance values of 5.45, 3.77 and 6.14 m for steers classified as calm, intermediate and excited, with significant differences between intermediate and excited animals . Predominantly Bos indicus steers showed larger values for flight distance for calm and excited animals compared with predominantly Bos taurus steers (P<0.05).
Correlations between the three repetitions of flight distance were highly significant (flight distances 2 and 3: r = 0.65, n = 79, P<0.0001; flight distances 2 and 4: r = 0.67, n = 79, P<0.0001; flight distances 3 and 4: r = 0.63, n = 79, P<0.0001. Flight distance 2 was significantly correlated to
Temperament category P-value Genotype P-value P>F Interaction RMSE
Trait Calm Interm. Excited Bos taurus Bos indicus
EV2 1.24b 1.75ab 2.12a 0.0001 1.69 1.71 0.8699 0.1869 0.44
EV3 1.11c 1.70b 2.00a 0.0001 1.48b 1.73a 0.0439 0.1545 0.50
EV4 1.17c 1.73b 2.16a 0.0001 1.56b 1.82a 0.0134 0.3593 0.43
FD2 3.70b 3.76b 5.20a 0.0458 3.31 5.12 0.0016 0.0412 2.28
FD3 3.12b 3.82ab 5.17a 0.0001 3.30b 4.77a 0.0001 0.3713 1.33
FD4 3.63b 3.66b 5.44a 0.0514 3.43b 5.05a 0.0192 0.3736 2.79
EV and FD 2, 3 and 4 - exit velocity and flight distance measured at evaluations 2, 3 and 4, respectively; Interm - intermediate; RMSE - root mean square error. Least-squares means within a row with different letters differ (P<0.05).
DMI (r = -0.32, n = 79, P<0.01), feed conversion (r = 0.28, n = 79, P<0.05), ADG (r = -0.46, n = 79, P<0.0001), Warner-Bratzler shear value (r = 0.23, n = 79, P<0.05) and luminosity (r = -0.26, n = 79, P<0.05). Flight distances 3 and 4 showed correlation coefficients to similar flight distance 2 for DMI, feed conversion, ADG and luminosity.
Among predominantly Bos indicus steers flight distance 3 was negatively related to luminosity (r = -0.33, n = 46, P<0.05), while flight distances 2 and 4 were not related to productive or beef quality traits. Among predominantly Bos taurus steers, flight distance 2 was not related to DMI or feed conversion, but it was negatively related to ADG (r = -0.42, n = 33, P<0.05), to luminosity (r = -0.40, n = 33, P<0.05) and positively related to pH 7 h post mortem (r = 0.40, n = 33, P<0.025). Flight distance 3 was positively related to pH 7 h post mortem. Flight distance 4 was negatively related to DMI (r = -0.36, n = 33, P<0.05), luminosity (r = -0.42, n = 33, P<0.05) and to 24 h post mortem pH (r = 0.35, n = 33, P<0.05).
Most of predominantly Bos indicus steers (80%) presented facial whorl well above the eye level compared with 21.2% of predominantly Bos taurus steers. Within genotype groups, the frequencies of facial whorl position did not change with temperament categories. Among predominantly Bos indicus steers, facial whorl position was negatively related to DMI (r = -0.36, n = 46, P<0.05) and positively related to composite score 1 (r = 0.25, n = 46, P<0.10). Among predominantly Bos taurus steers, facial whorl position was positively related to DMI (r = 0.53, n = 33, P<0.01) and feed conversion (r = 0.56, n = 33, P<0001) but negatively related to ADG (r = -0.40, n = 33, P<0.05).
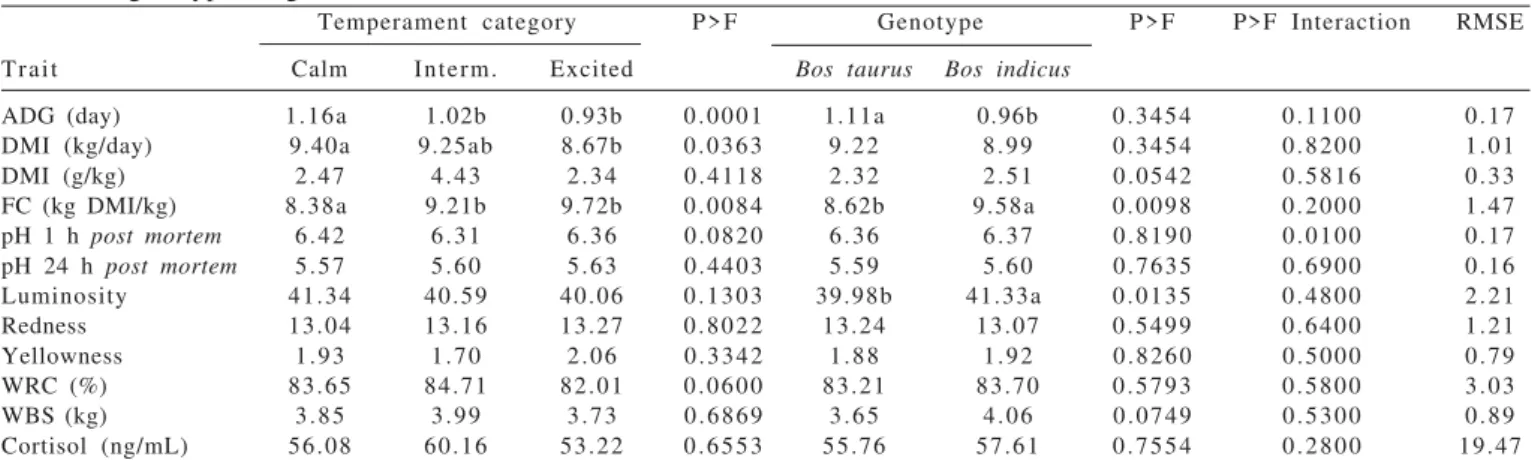
The average daily gain across all animals over the trial period of 97 days was 1.02 ±- 0.17 kg/day. Calm steers had faster gain than intermediate and excited steers (1.16 × 1.02
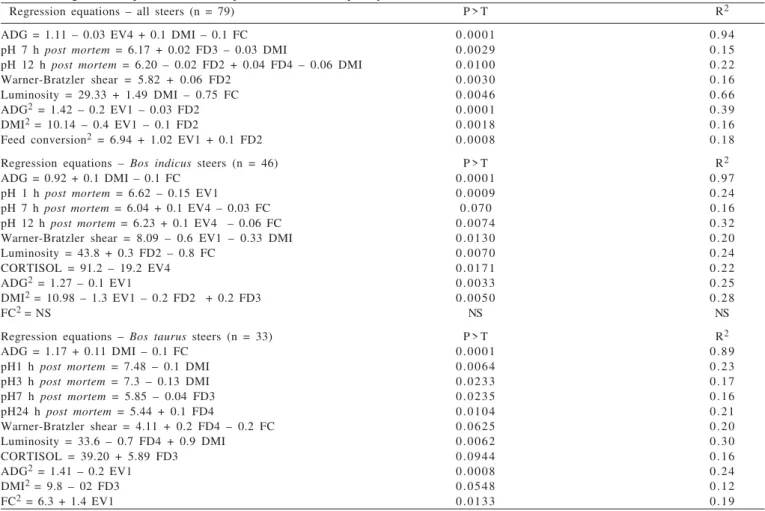
and 0.93 kg/d, P<0.0363). Predominantly Bos taurus steers showed higher weight gains than predominantly Bos indicus steers (1.11 × 0.96 kg/day, P<0.001) (Table 3). Average daily gain was almost entirely determined by intake and feed conversion and negatively affected by exit velocity 1 (Table 4).
The overall DMI mean was 9.0 ± 1.01 kg DM/day or 24.1g/kg. Calm steers consumed more feed than excited animals (9.40 × 8.67 kg/day, P<0.05) (Table 3).
Overall feed conversion was 9.08 + 1.52 kg DMI/kg weight gain. Calm animals presented better feed conversion than intermediate or excited animals. Predominantly Bos taurus steers showed better feed conversion than predominantly Bos indicus steers (Table 3).
A significant interaction between genotype and temperament category was detected (P<0.01) for pH 1 h post mortem (Table 3). For predominantly Bos indicus steers, calm animals presented higher pH values 1 h post mortem than those classified as intermediate or excited: 6.51, 6.30 and 6.30, respectively (P<0.01). In this group, pH values 1 h post mortem were negatively related with exit velocity (exit velocity 1, r = -0.43, n = 46, P<0.01). However, neither significant differences nor significant correlations with behavioral attributes were detected among predominantly Bos taurus steers. Calm predominantly Bos indicus steers presented higher pH 1 h post mortem than calm predominantly Bos taurus steers (6.51 × 6.33, P<0.05). For pH measured at 3, 7, 12 and 24 hours post mortem, no significant effects for temperament categories, genotype or their interaction were detected (Table 3).
For predominantly Bos indicus steers, pH values 1 h post mortem decreased with increasing exit velocity 1 values, while for predominantly Bos taurus steers, pH values 1 h post mortem decreased with higher DMI.
Temperament category P>F Genotype P>F P>F Interaction RMSE
Trait Calm Interm. Excited Bos taurus Bos indicus
ADG (day) 1.16a 1.02b 0.93b 0.0001 1.11a 0.96b 0.3454 0.1100 0.17
DMI (kg/day) 9.40a 9.25ab 8.67b 0.0363 9.22 8.99 0.3454 0.8200 1.01
DMI (g/kg) 2.47 4.43 2.34 0.4118 2.32 2.51 0.0542 0.5816 0.33
FC (kg DMI/kg) 8.38a 9.21b 9.72b 0.0084 8.62b 9.58a 0.0098 0.2000 1.47
pH 1 h post mortem 6.42 6.31 6.36 0.0820 6.36 6.37 0.8190 0.0100 0.17
pH 24 h post mortem 5.57 5.60 5.63 0.4403 5.59 5.60 0.7635 0.6900 0.16
Luminosity 41.34 40.59 40.06 0.1303 39.98b 41.33a 0.0135 0.4800 2.21
Redness 13.04 13.16 13.27 0.8022 13.24 13.07 0.5499 0.6400 1.21
Yellowness 1.93 1.70 2.06 0.3342 1.88 1.92 0.8260 0.5000 0.79
WRC (%) 83.65 84.71 82.01 0.0600 83.21 83.70 0.5793 0.5800 3.03
WBS (kg) 3.85 3.99 3.73 0.6869 3.65 4.06 0.0749 0.5300 0.89
Cortisol (ng/mL) 56.08 60.16 53.22 0.6553 55.76 57.61 0.7554 0.2800 19.47
Interm. - intermediate; RMSE - root mean square error; ADG - average daily gain; DMI - dry matter intake; FC - feed conversion; WRC - water retention capacity; WBS - Warner-Bratzler shear.
Least-squares means within a row with different letters differ (P<0.05).
However, pH values 24 h post mortem increased with flight distance 4 values just for predominantly Bos indicus steers (Table 4).
There were no significant effects of temperament categories or genotype and their interaction for muscle color, except for luminosity (P<0.0135) (Table 3). Predominantly Bos indicus steers showed larger values for luminosity (41.33 × 39.98) than predominantly Bos taurus steers, indicating that they produced darker meat. Luminosity values decreased with flight distance 3 and flight distance 4 for predominantly Bos indicus and Bos taurus steers, respectively. Redness values increased with exit velocity 4 and feed conversion for predominantly Bos indicus steers, while it decreased with DMI for predominantly Bos taurus steers (Table 4).
There were no significant effects of temperament categories or genotype and their interaction for water retention capacity (Table 3). In this study, the average value of water retention capactity was 83.68% ± 3.21 and the average value of water loss was 16%, which are considered normal for bovine muscles.
The level of plasmatic cortisol did not show significant difference between genetic groups or temperament categories (Table 3). The overall mean was 55.63 ng/mL±19.31, with minimum value of 16.17 ng/mL and maximum of 98.82 ng/mL. Plasmatic cortisol values increased with flight distance 3 for predominantly Bos taurus steers, while it decreased with exit velocity 4 for predominantly Bos indicus steers (Table 4).
Discussion
The relationships between temperament categories created according to exit velocity 1 values and other behavioral attributes as composite score and flight distance indicate that they apparently measured the same personality trait. Regardless of the genotype group, excited steers were more agitated and flighty than those classified as calm, showing greater values for flight distance and composite score. The fear-eliciting nature of an event is due to the general characteristics of the event, e.g., novelty and physical characteristics of its presentation, such as movement,
ADG - average daily gain; EV - exit velocity; DMI - dry matter intake; FC - feed conversion; FD - flight distance; NS - non-significant.
1 Only significant regression equations were retained (P<0.10 and R2>0.15). 2 When only behavioral attributes were considered.
Regression equations – all steers (n = 79) P > T R2
ADG = 1.11 – 0.03 EV4 + 0.1 DMI – 0.1 FC 0.0001 0.94
pH 7 h post mortem = 6.17 + 0.02 FD3 – 0.03 DMI 0.0029 0.15
pH 12 h post mortem = 6.20 – 0.02 FD2 + 0.04 FD4 – 0.06 DMI 0.0100 0.22
Warner-Bratzler shear = 5.82 + 0.06 FD2 0.0030 0.16
Luminosity = 29.33 + 1.49 DMI – 0.75 FC 0.0046 0.66
ADG2 = 1.42 – 0.2 EV1 – 0.03 FD2 0.0001 0.39
DMI2 = 10.14 – 0.4 EV1 – 0.1 FD2 0.0018 0.16
Feed conversion2 = 6.94 + 1.02 EV1 + 0.1 FD2 0.0008 0.18
Regression equations – Bos indicus steers (n = 46) P > T R2
ADG = 0.92 + 0.1 DMI – 0.1 FC 0.0001 0.97
pH 1 h post mortem = 6.62 – 0.15 EV1 0.0009 0.24
pH 7 h post mortem = 6.04 + 0.1 EV4 – 0.03 FC 0.070 0.16
pH 12 h post mortem = 6.23 + 0.1 EV4 – 0.06 FC 0.0074 0.32
Warner-Bratzler shear = 8.09 – 0.6 EV1 – 0.33 DMI 0.0130 0.20
Luminosity = 43.8 + 0.3 FD2 – 0.8 FC 0.0070 0.24
CORTISOL = 91.2 – 19.2 EV4 0.0171 0.22
ADG2 = 1.27 – 0.1 EV1 0.0033 0.25
DMI2 = 10.98 – 1.3 EV1 – 0.2 FD2 + 0.2 FD3 0.0050 0.28
FC2 = NS NS NS
Regression equations – Bos taurus steers (n = 33) P > T R2
ADG = 1.17 + 0.11 DMI – 0.1 FC 0.0001 0.89
pH1 h post mortem = 7.48 – 0.1 DMI 0.0064 0.23
pH3 h post mortem = 7.3 – 0.13 DMI 0.0233 0.17
pH7 h post mortem = 5.85 – 0.04 FD3 0.0235 0.16
pH24 h post mortem = 5.44 + 0.1 FD4 0.0104 0.21
Warner-Bratzler shear = 4.11 + 0.2 FD4 – 0.2 FC 0.0625 0.20
Luminosity = 33.6 – 0.7 FD4 + 0.9 DMI 0.0062 0.30
CORTISOL = 39.20 + 5.89 FD3 0.0944 0.16
ADG2 = 1.41 – 0.2 EV1 0.0008 0.24
DMI2 = 9.8 – 02 FD3 0.0548 0.12
FC2 = 6.3 + 1.4 EV1 0.0133 0.19
intensity, duration and proximity or specific stimuli, such as height and darkness or in relation to evolutionary history as innate fears. Additionally, an event can elicit fear by being associated to previous experience. However, behavior patterns related to fear might vary greatly depending on the characteristics of the threat. They can be contradictory, since both active and passive strategies are observed (Forkman et al., 2007). The fear tests used in the present study are related to human presence and social isolation from herd mates. Moderate to high correlations found between behavioral attributes show a common psychological base (Morris et al., 1994; King et al., 2006). Some others studies have revealed distinct reactions between genotypes, reporting for Bos indicus breeds or crossbreds greater agitation compared with Bos taurus (Grandin & Deesing, 1998; Barbosa-Silveira et al., 2006; Barbosa-Silveira et al., 2008a, b). However, Kabuga & Appiah (1992) did not verify differences of handling ease between Bos taurus and Bos indicus crossbred steers, suggesting that it was more influenced by raising conditions and previous management.
Exit velocity and flight distance values remained relatively consistent and highly repeatable during the whole assay: 0.62 and 0.67, respectively, indicating little habituation of steers to handling management. Consistency of exit velocity values has been reported by Grandin (1993), Barbosa-Silveira et al. (2008a) for Aberdeen Angus and Aberdeen Angus × Nellore crossbreds. However, Müller & Keyserlingk (2006) evaluated exit velocity four times at 4-week intervals and observed an increase of exit velocity values at the fourth evaluation. Petherick et al. (2002) observed that exit velocity increased until day 70 and decreased by day 101 and credited it to the repeated handling of the animals. King et al. (2006) reported diminished values for exit velocity after the first evaluation due to habituation of the animals. Those discrepancies revealed that management and previous experience might influence repeatability.
Although facial whorl position has been related to temperament, with position above the top of the eye level related to poor temperament (Lanier et al., 2001), in the present study it was mostly affected by breed than by temperament categories within genotype groups.
Across genotypes groups, more reactive steers presented lower ADG. Moderate negative correlations between behavioral attributes (composite scores, exit velocity and flight distance) with ADG are in agreement with the results reported by Voisinet et al. (1997a), Fell et al. (1999), Petherick et al. (2002), Brown et al. (2004), Barbosa-Silveira et al. (2006). Müller & Keyserlingk (2006)
reported negative but quadratic relation between ADG and exit velocity.
In the present study, irrespective of genotype group, more reactive animals presented lower intake and worse feed conversion, although regression equations within genotype groups revealed for predominantly Bos indicus steers, that feed conversion was not related to behavioral attributes while intake was negatively related to exit velocity and flight distance. Among predominantly Bos taurus steers, feed conversion was positively related to exit velocity, but no relation was detected between exit velocity and DMI. Good or calm temperament was related by several authors to greaterintake (Kilgour & Walker, 2000; Brown et al., 2004) or to better feed conversion (Petherick et al., 2002), although they did not reported differences between genotypes groups.
Temperament categories did not consistently affect meat quality traits, except for pH 1 h post mortem of predominantly Bos indicus steers. Calmer Bos indicus steers presented higher pH values 1 h post mortem than those classified as intermediate or excited, and also higher values than predominantly Bos taurus steers. These result, in addition to the negative correlations between behavioral attributes (exit velocity and flight distance) and luminosity, are consistent with the results showed by King et al. (2006) and Barbosa-Silveira et al. (2006). More agitated cattle may deplete their glycogen reserves quicker, yielding higher lactate concentration in the muscles very soon after stunning, which might lower pH values 1 h post mortem (Gregory, 1998; Lawrie, 2005). Calm Bos indicus steers had pH values compatible to little stressed animals, close to 6.5 (Lawrie, 2005). Intermediate and excited predominantly Bos indicus steers presented lower pH values 1 h post mortem, which might be related to stress or partially related to muscle fiber type, as double-muscled Charolais cattle have a higher proportion of α-white fibers that are prone to
developing higher blood lactate levels during exercise (Gregory, 1998).
relation between temperament and beef quality, mainly ultimate pH, sarcomere length, Warner-Bratzler shear and cooking loss, except for bruising score of the carcass, which increased in cattle with poor temperament.
In the present study, temperament was measured from the first weighing after entering the feedlot, which might have influenced the strength of correlations. According to Behrends et al. (2009), temperament measurements made at weaning were more correlated to ADG, rib eye area, USDA yield grade and Warner-Bratzler shear than measurements made during finishing period.
In the present study, according to the regression equations generated, predominantly Bos taurus steers had larger Warner-Bratzler shear, pH 24 h post mortem and lower luminosity with increasing values for flight distance, which indicate the tendency of more agitated Bos taurus steers to present worse beef quality. However, this was not observed for Bos indicus steers.
Conclusions
Temperament categories according to exit velocity are effective in discriminate animals and differences remain quite constant. Calm steers show better performance compared with excited animals, but in general, they do not present better beef quality. Relationships between behavioral attributes and beef quality are not consistent for genotype groups, despite the same raising and finishing conditions.
References
ABULARACH, M.L.S.; ROCHA, C.E.; FELÍCIO, P.E. Características de qualidade do contrafilé (músculo “Longissimus dorsi”) de touros jovens da raça Nelore. Ciência e Tecnologia de Alimentos, v.18, p.205-210, 1998.
BARBOSA-SILVEIRA, I.D.; FISCHER, V.; SOARES, G.J.D. Relação entre o genótipo e o temperamento de novilhos em pastejo e seu efeito na qualidade da carne. Revista Brasileira de Zootecnia, v.35, p.591-526, 2006.
BARBOSA-SILVEIRA, I.D.; FISCHER, V.; SOARES, G.J.D. Effect of genotype on the temperament of steers handled under extensive conditions. Archivos de Zootecnia, v.57, p.123-129, 2008. BARBOSA-SILVEIRA, I.D.; FISCHER, V.; WIEGAND, M.M.
Temperamento de bovinos de corte: métodos de medidas em diferentes sistemas produtivos. Archivos de Zootecnia, v.57, p.321-332, 2008a.
BARBOSA-SILVEIRA, I.D.; FISCHER, V.; FARINATTI, L.H.E. et al. Relação entre genótipos e temperamento de novilhos Charolês x Nelore com confinamento. Revista Brasileira de Zootecnia, v.37, n.10, p.1808-1814, 2008b.
BENDALL, J.R. Post mortem changes in muscle. In: The structure and functions of muscle. 2.ed. New York: Academic Press, 1973. v.11, 243p.
BEHRENDS, S.M.; MILLER, R.K.; ROUQUETTE, F.M. et al. Relationship of temperament, growth, carcass characteristics and tenderness in beef cattle. Meat Science, v.81, p.433-438, 2009.
BOIVIN, X.; LE NEINDRE, P.; CHUPIN, J.M. Establisment of cattle-human relationship. Applied Animal Behaviour Science, v.32, p.325-335, 1992.
BROWN, E.G.; CARSTENS, G.E.; FOX, J.T. et al. Relationships between temperament and performance traits of growing calves. Maryland: College Station Texas A&M University, 2004. p.167-170. (Beef cattle research in Texas).
BURROW, H.M.; DILLON, R.D. Relationship between temperament and growth in a feedlot and commercial carcass traits of Bos indicus crossbreeds. Australian Journal of Experimental Agriculture, v.37, p.407-411, 1997.
FELL, L.R.; COLDITZ, I.G.; WALKER, K.H. et al. Associations between temperament, performance and immune function in cattle entering a commercial feedlot. Australian Journal of Experimental Agriculture, v.39, p.795-802, 1999. FORDYCE, G.; GODDARD, M.; SEIFERT, G.W. The measurement
of temperament in cattle and effect of experience and genotype. Animal Production, v.14, p.329-332, 1982.
FORDYCE, G.; DODT, R.M.; WYTHES, J.R. Cattle temperaments in extensive beef herds in northern Queensland. 1. Factors affecting temperament. Australian Journal of Experimental Agriculture, v.28, p.683-687, 1988a.
FORDYCE, G.; WYTHES, J.R.; SHORTHOSE, W.R. et al. Cattle temperaments in extensive beef herds in northern Queensland 2. Effect of temperament on carcass and meat quality. Australian Journal of Experimental Agriculture, v.28, p.689-693, 1988b. FORKMAN, B.; BOISSY, A.; MEUNIER-SALAUN, M.C. et al. A critical review of fear tests used on cattle, pigs, sheep, poultry and horses. Physiology and Behavior, v.92, p.340-374, 2007. GRANDIN, T. The effect of stress on livestock meat prior to and during slaughter. International Journal of Study Animal Problems, v.1, p.313-337, 1980.
GRANDIN, T.; DEESING, D. Genetics and behavioural of domestic animals. San Diego: Academic Press, 1998. 356p. GRANDIN, T. Behavioral agitation during handling of cattle is
persistent over time. Applied Animal Behaviour Science, v.36, p.1-9, 1993.
GRANDIN, T.; DEESING, M.J.; STRUTHERS, J.J. et al. Cattle with hair whore patterns above the eyes are more behaviorally agitated during restraint. Applied Animal Behaviour Science, v.46, p.117-123, 1995.
GREGORY, N.G. Animal welfare and meat science. New York: CABI Publishing, 1998. 296p.
HOUBEN, J.H.; DIJK, A.; EIKELENBOOM, G. et al. Effect of dietary vitamin E supplementation, fat level and packaging on colour stability and lipid oxidation in minced beef. Meat Science, v.55, p.331-336, 2000.
KABUGA, J.D.; APPIAH, P. A note on the ease of handling and flight distance of Bos indicus, Bos taurus and its crosses. Animal Production, v.54, p.309-311, 1992.
KADEL, M.J.; JOHNSON, D.J.; BURROW, H.M. et al. Genetics of flight time and other measures of temperament and their value as selection criteria for improving meat quality traits and their tropically adapted breeds of beef cattle. Australian Journal of Agriculture Research, v.57, p.1029-1035, 2006. KILGOUR, R.; WALKER, B. Temperament critical to feedlot
performance. New York: National Academy of Sciences, 2000. Cattle Research Council Sponsors Report. 210p.
KING, D.A.; PFEIFFER, C.E.S.; RANDEL, R.D. et al. Influence of animal temperament and stress responsiveness on the carcass quality and beef tenderness of feedlot cattle. Meat Science, v.74, p.546-556, 2006.
LANIER, J.L.; GRANDIN, T.; GREEN, R. et al. A note on hair position and cattle temperament in auction ring. Applied Animal Behavior Science, v.73, p.93-10, 2001.
LAWRIE, R.A. Ciência de la carne. 3.ed. Zaragoza, Espanha: Acribia, 2005. 367p.
Zealand Journal of Agriculture Research, v.37, p.167-175, 1994.
MUCHENGE, V.; DZAMA, K.; CHIMONYO, M. et al. Relationship between pre-slaughter stress responsiveness and beef cattle in three cattle breeds. Meat Science, v.81, p.653-657, 2009. MÜLLER, R.; von KEYSERLINGK, M.A.G. Consistency of flight
speed and its correlation to productivity and to personality in Bos taurus beef cattle. Applied Animal Behavior Science, v.99, p.193-204, 2006.
NATIONAL RESEARCH COUNCIL - NRC. Nutrient requirements of beef cattle. 7.ed. Washington, D.C., 1996. 232p. PETHERICK, J.C.; HOLROYD, R.G.; DOOGAN, V.J. et al.
Productivity, carcass and meat quality of lot fed Bos indicus cross steers grouped according to temperament. Australian Journal of Experimental Agriculture, v.42, p.389-398, 2002.
PIOVESAN, U. Análise de fatores genéticos e ambientais na reatividade de quatro raças de bovinos de corte ao manejo.
1998. 42f. Dissertação (Mestrado em Zootecnia) - Faculdade de Ciências Agrárias e Veterinárias, UNESP, Jaboticabal. REVERTER, A.; JOHNSTON, D.J.; PERRY, D.R. et al. Genetic and
phenotypic characterization of animal, carcass, and meat quality traits from temperate and tropically adapted beef breeds. 2. Abbatoir carcass traits. Australian Journal of Agricultural Research, v.54, p.119-134, 2003.
SIERRA, I. Producion de cordero joven y pesado em la raza Aragonesa. Instituto de Economia y Producciones Ganaderas del Ebro, I.E.P.G.E., n.18, 28p., 1973.
VOISINET, B.D.; GRANDIN, T.; TATUM, J.D. et al. Feedlot cattle with calm temperaments have higher average daily gains than cattle with excitable temperaments. Journal of Animal Science, v.75, p.892-896, 1997a.