D
ECENTRALIZATION AND
E
DUCATION
P
ERFORMANCE
:
A
F
IRST
V
IEW TO THE
B
RAZILIAN
P
ROCESS
MARIA CAROLINA LEME
RICARDO D. PAREDES
ANDRÉ PORTELA
Outubro
de 2009
T
T
e
e
x
x
t
t
o
o
s
s
p
p
a
a
r
r
a
a
D
D
i
i
s
s
c
c
u
u
s
s
s
s
ã
ã
o
o
TEXTO PARA DISCUSSÃO 207 • OUTUBRO DE 2009 • 1
Os artigos dos Textos para Discussão da Escola de Economia de São Paulo da Fundação Getulio
Vargas são de inteira responsabilidade dos autores e não refletem necessariamente a opinião da
FGV-EESP. É permitida a reprodução total ou parcial dos artigos, desde que creditada a fonte.
Decentralization and Education Performance: A First View to the Brazilian Process Maria Carolina Leme1, Ricardo D. Paredes2, André Portela1
Abstract
This paper analyses the impact of the decentralization in educational system that is taking place in Brazil in the last decade, as a result of several laws that encourage municipalities to invest in fundamental education. The proficiency tests undertaken by the government allows to follow some public schools in two points in time. Therefore we were able to create an experimental group with the schools that were under state system in the SAEB exam and have migrated to the municipality system by the time of Prova Brasil and a control group with the schools that were under the state system between the two exams and compare the difference in their results using a fixed effect panel data analysis. The difference in difference estimator indicates that there is no significant change in the performance of the students.
JEL Classification: I21, I28.
Keywords: schooling, performance, decentralization,
1. Introduction
As it is well known, by any international or national standards the quality of public education in Brazil is very poor. This is probably a consequence of the fast and disorganized increase in educational coverage that took place along the last decades. Decentralization of the educational system is viewed as one of the several possible policies to handle this problem, since it can turn the system more flexible and transparent, improve its accountability and governance and promote family and community participation. In Brazil decentralization is associated with the transfer of control to the municipalities of the fundamental education, 1st to 8th grades, which used to be, at least partially, under the control of the states administration. During the 1990s several laws2 consolidated this process, among them FUNDEF plays a fundamental role as it induces the municipalities to invest in fundamental education. A large amount of resources have been spent in this process in the last ten years but very few studies have been made to assess its effectiveness. The purpose of this paper is to evaluate the impact of this decentralization on student’s performance. We do this comparing the difference in the students performance at school level between two periods of time comparing three groups of schools: those that were already under the municipality control at the time of the SAEB exam; those that were under the states control in the SAEB exam and remained in it by the time of Prova Brasil and; those that migrated from the state to the municipality control between the two periods exams. The analysis is restricted to students in the 4th grade since it is the first cycle of the fundamental school the main goal of the decentralization.
2. School Performance in Brazil
Like in the most part of the world, students performance in Brazil is determined by family characteristics, institutional factors and school resources: classroom hours, access to
1 Fundação Getulio Vargas, São Paulo
2 Escuela de Ingeniería, Pontificia Universidad Católica de Chile
2 Lei de Diretrizes e Bases da Educação Nacional 9394/96, Emenda Constitucional 14/96 (FUNDEF), Lei
books, teacher experience and teaching methods (e.g., Fuller, 1990; Fuller and Clarke, 1994 and Hanushek, 1995). Those resources are intimately related to the school management and, consequently, to the educational system to which the school belongs. In Brazil public schools can be under federal, state or municipal control, that correspond roughly to the degree of decentralization and autonomy of decisions at school level The research on the impact of decentralization on education in Brazil has two approaches: the first one are case studies (Gil and Arelano, 2004, Araújo, 2005, Oliveira 1999, Oliveira , 1997, Pinto 2000) that highlight the absence of coordination between the state and municipal educational systems that resulted in a miscellaneous of pedagogical policies; the absence of scale economies that turned the system unnecessarily expensive and the administrative inexperience of the municipalities in this subject.
The other approach are quantitative studies that, using econometrics methods, try to understand the impact on the student’s perform of several factors such as family background, school facilities, community resources, opportunity cost of education, and the educational system to which the school belongs to: private or public and among the public: municipal or state. School performance is usually measured by years of schooling, enrolment and abandon rates, age-grade distortion and, more recently, by the proficiency scores in the national exams promoted by the federal government.
One of the first studies to take into account those factors is Barros, Mendonça, Santos and Quintaes (2001).Using the Brazilian Household Surveys, PNAD and PPV it founds that even taking into account all above mentioned variables, still the most important determination of years of schooling is the family background, mainly parents schooling and family per capita income. Community resources, measured by average schooling and income of the population, school resources, measured by number of schools and commuting time have a positive but inexpressive impact while schooling of the teachers had an ambiguous effect: positive for fundamental school and negative for high school. Albernaz, Ferreira and Franco (2002), also include school’s information in the analysis of the determinants of students performance as measured by the proficiency scores of the SAEB tests in a HLM model. Apart from the usual results they found that the socioeconomic level of the student’s peers are also important determinants of educational performance and that students in private schools perform better than those in public schools. Riani (2004) studying age-grade distortions found that family background and school resources are also the most important factors but among the community resources the percentage of public schools, and particularly of municipal schools, plays a positive role in reducing distortion in the fundamental cycle.
the system. Using data from the School Census from 1996 to 2003 he analyzes the impact of the control transfer to municipalities on abandon, enrolment and age-grade distortion as well as in the use of schools inputs such as number of hours in the classroom, size of the classroom, and equipment utilization. The results are ambiguous: they show a significant positive impact on the use of school inputs but a negative impact on students` performance indicators, confirming D’Atri results. The results of both studies are very interesting but present some limitations mainly the use of performance indicators such as enrolment, abandon and age-grade distortions that may be tainted by issues not directly related to it. Another drawback, specifically to D’Atri study, is the use of data at the municipal level that apart from the limitations of this level of aggregation, it doesn’t control for the fixed effects of the schools that is a possible source of bias in the analysis. In our study we try to overcome those limitations using a panel data study that allows us to compare the results of the students in schools before and after the change in control to the municipalities takes place with the results of students in schools that remained under the states control in both periods.
3. Descriptive Analysis
The proficiency results of the 4th grade students along the years show that students in private schools perform better than those in the public system, either municipal or state managed. Their score was 30% higher on average but, on the other hand they also presented a higher variance 40% in math and 30% in reading.
Table 1
Proficiency Scores: SAEB e Prova Brasil
4ª grade Math Reading
Math 1997 1999 2001 2003 2005 1997 1999 2001 2003 2005
State 178,8 173,0 172,8 176,9 177,7 174,4 159,8 162,0 168,1 168,5
(37,2) (36,3) (39,9) (40,2) (42,2) (39,8) (38,8) (43,3) (42,8) (41,0) Municipal 174,9 169,4 165,9 171,3 172,5 170,5 156,2 155,2 164,5 163,8
(36,4) (35,2) (38,8) (39,1) (41,7) (37,7) (37,6) (42,7) (42,1) (40,7)
Private 225,1 217,6 223,8 225,1 227,8 219,2 208,9 209,7 215,2 213,9
(49,3) (44,0) (48,1) (45,9) (47,6) (50,5) (48,5) (48,0) (45,4) (43,6) Total 189,0 183,7 185,8 190,7 193,6 184,4 171,9 174,0 182,2 182,9
(45,4) (43,5) (49,3) (48,2) (50,9) (46,7) (47,2) (50,6) (49,1) (47,7)
SD in parenthesis
Within the public system, the students in the state schools presented a better performance than those at the municipal schools, but the difference is very small although significant: 2% on average in both, math and reading.
Table 2
Score Difference between State and Municipal Schools ∆(S-M)
1997 1999 2001 2003 2005 Math 3,91 3,64 6,86 5,66 5,19
(0,734**) (0,779**) (0,754**) (0,621**) (0,739**)
Reading 3,87 3,61 6,75 3,63 4,66
(0,789**) (0,835**) (0,825**) (0,666**) (0,723**)
The data bases from SAEB and Prova Brasil, on the other hand, allow us to make a more detailed comparative analysis since we can follow some of the schools at least in two periods of time: the year the school participated in the SAEB test and the year of Prova Brasil, which is mandatory for almost all schools in the public system. We can also track schools that belonged to the state system in the SAEB test but at the time of Prova Brasil had already moved to the municipal system. Therefore we can have the results of the same schools in at least two points in time under the same system, either state, which we will call the S-S schools or municipal, the M-M schools, or under the two different systems the S-M schools.3 As a consequence we have 4 panels for each school cohort: 1997-2005; 1999-2005, 2001-2005 and 2003-1999-2005, taking into account each group of schools. Unfortunately we don’t know exactly when the change of control to the municipalities occurred. For instance for a school that was under the state control when it participated in the SAEB exam in 1997 and was under the municipality in 2005 in Prova Brasil, the transfer may have occurred in any of those eight years.
The school panel, i.e. the number of schools that matched SAEB and Prova Brasil, represent 23% of the total schools of the SAEB data base as can be seen in Table 3.
Table 3
Public School Panel
S-S M-M S-M % TOTAL ANO 1997 205 227 6 26,0% 1999 499 674 27 22,3% 2001 297 413 17 14,3% 2003 649 687 22 33,2% Total 1650 2001 73 22,9% Source: INEP
On the other hand the number of students of those schools represent between 23% to 52% of the students of the public system in the SAEBs data base, as can be seen in Table 4.. Table 4
School Panel: Number of Students (math+reading) S-S M-M S-M % TOTAL
1997 3320 3135 99 37,4% 1999 1989 2759 142 22,6% 2001 3167 4387 174 27,8% 2003 6112 6567 185 52,2% Source: INEP
3 There is also the possibility of the school moving form the municipal to the state system, but in practice we
The performance of the three groups of schools in the proficiency tests can be seen in Table 5.
Table 5
School Panels Proficiency Scores - SAEB e Prova Brasil 4a grade
Math 1997 2005 1999 2005 2001 2005 2003 2005 Total 178,79 179,21 173,48 177,73 171,24 178,12 175,14 180,13 S-M 178,53 187,86 174,43 179,65 174,16 181,06 170,96 179,92 M-M 177,65 175,52 173,14 176,36 169,11 177,26 172,52 178,73 S-S 179,83 183,23 173,93 179,98 174,04 179,60 177,87 181,97 reading 1997 2005 1999 2005 2001 2005 2003 2005 Total 174,87 172,64 161,39 170,71 160,86 171,21 167,82 172,79 S-M 176,27 177,19 161,50 173,45 163,22 173,01 169,91 175,01 M-M 173,33 168,48 161,31 169,04 159,09 170,17 165,80 171,09 S-S 183,98 177,30 159,25 173,41 162,58 171,89 159,95 172,15
As we observed before, for the whole sample, state schools, either those that remained as such or those that migrated to the municipal system later on, performed a little better than the municipals ones in math and presented an oscillatory behavior with respect to reading in both exams, SAEB and Prova Brasil.
Our main interest is to compare the results of the group of state schools that remained in the system, the S-S schools, (our control group) with the group of schools that eventually moved to municipal control, the S-M schools (our treatment group). We observe in Table 6 that the difference in scores between the two groups in the SAEB test, i.e. before the change of control took place, is not significantly different:
Table 6
School Panels: Difference Proficiency Results in the SAEBs Tests
Math Reading
∆S-S S-M ∆SS-S M
1997 1,3 -7,7
(0,33) (-1,2)
1999 -0,5 2,2
(-0,15) (0,6)
2001 -0,1 0,6
(-0,03) (0,2)
2003 6,9 10,0
(2,67) (3,3)
t- statistics in parenthesis
The differences in performance oscillate in favor of one or the other system but they are significant only in 2003 cohort when the schools that latter moved to the municipality control presented a clear and significant inferior result in both math and reading.. For the other cohorts, although we observe some higher differences like in the 1997, they were not significant at 5% level.
Table 7
School Panels: Students Profile in Schools under State Control by Group of Schools
Cohort 1997 1999 2001 2003 Skin Color (% whites and yellows)
S-S 45,1% 43,9% 44,3% 40,1% S-M 42,6% 38,5% 39,1% 30,9% Age
S-S 11,4 11,3 10,7 10,8 S-M 11,8 10,9 10,9 10,8 Father’s Schooling
S-S 7,1 7,0 7,1 8,0 S-M 7,0 6,8 7,5 7,8 Mother’s Schooling
S-S 7,1 7,0 6,9 7,9 S-M 6,8 7,0 7,2 8,0
The largest difference, between the students in the two groups of schools, is with respect to the skin color. We observe a significant higher presence of non whites in the schools that were latter under the municipality control. With respect to age and parents’ schooling the cohorts of both groups of schools were, on average, very similar..
The difference in performance of the students of both groups in Prova Brasil, i.e., after transfer of control to the municipalities took place for the S-M group, is shown in Table 8. We observe in math an oscillatory behavior across cohorts and in reading a light better perform of the schools that remained in the state system. But for both subjects the differences are not significant at 5% level.
Table 8: School Panels: Difference Proficiency Results in the 2005 Prova Brasil Test
∆S-S S-M
Cohort Math Reading 1997 -4,63 -0,11
(-1,80) (-0,04)
1999 0,33 0,04
(0,27) (0,03)
2001 -1,46 1,11
(-0,96) (0,74)
2003 2,05 1,82
(1,40) (1,57)
t statistics in parenthesis
We also don’t observe large changes in the student profile between the two groups after the change to the municipalities, as we can see in Table 9 below.
1997 1999 2001 2003 Skin Color
S-S 32,9% 35,4% 36,7% 37,7% S-M 32,9% 29,7% 34,8% 30,9% Age
S-S 10,9 10,9 10,9 10,8 S-M 10,7 11,3 11,0 11,1 Father’s Schooling
S-S 8,6 7,9 8,0 8,1 S-M 8,9 7,3 8,0 7,3 Mother’s Schooling
S-S 8,4 7,9 7,8 7,9 S-M 8,0 7,3 7,5 7,0
The differences are not very high, the percentage of non-whites in the schools that moved to municipal control is higher than in the other group and the difference is significant for the 1999 and 2003 cohorts. Mother’s schooling is also lower and the difference is significant for those same cohorts. On the other hand father’s schooling is significant only for the 1999 cohort and the difference is against the schools that moved to municipal control. These schools also present younger students on average.
Table 10
Schools Panels: Students Profile Differences in 2005
∆S-S S-M 1997 1999 2001 2003
Age 0,15 -0,03 -0,17 -0,31
(1,99) (-0,71) (-2,76) (-5,02)
Father’s Schooling -0,33 0,64 0,00 0,01
(-1,03) (3,81) (0,01) (0,22)
Mother’s Schooling 0,36 0,64 0,38 0,90
(1,17) (3,96) (1,81) (4,37)
Skin Color 0,00 0,06 0,02 0,07
(0,001) (4,06) (1,08) (3,61)
t statistics in parenthesis
4. The Model and Data
To analyze the impact of the municipal school management in the students
performance as measured by the scores test in math and reading we estimated the following equation
(1) yisrt =
β
0 +β
1Mis+β
2Tis +β
3Mis*Tis +ϕ
s +∑
δ
ixi +ε
ist2005, of Prova Brasil and T = 0 if any other year (1997, 1999, 2001 and 2003). xi is the vector of control variables for each student: age, sex, skin color, father’s and mother’s education.
ϕ
sis the fixed effect estimator for the schoolsFirst notice that:
(i) Eyist /M =0,T =0,
ϕ
sSS)=β
0 +ϕ
sSS (ii) Eyist /M =0,T =1,ϕ
sSS)=β
0 +β
2 +ϕ
sSS(iii) sMM
MM s ist M T
Ey / =1, =0,ϕ )=β0 +β1+ϕ
(iv) sMM
MM s ist M T
Ey / =1, =1,ϕ )=β0+β1+β2 +β3+ϕ
(v)
Ey
ist/
M
=
0
,
T
=
0
,
ϕ
sSM)
=
β
0+
ϕ
sSM(vi)Eyist /M =1,T =1,
ϕ
sSM)=β
0 +β
1+β
2 +β
3+ϕ
sSMTherefore, if we subtract equations (i) and (ii) we get the estimator of the difference in performance of the state schools that remained as such in both periods:
(vii) ∆SS =
β
2If we subtract equations (iii) and (iv) we get the estimator of the difference in performance of the municipal school that remained as such in both periods:
(viii)∆MM =
β
2 +β
3;If we subtract equations (v) and (vi) we get the estimator of the difference in performance of the schools that moved prom the state system to the municipal system between the two periods:
(ix) ∆SM =
β
1+β
2 +β
3.Using those estimators we can obtain three difference-in-difference estimators:
1. the DID between state and municipal schools that remained in the same school system in both periods
3
β
= ∆ −
∆MM SS ;
2. the DID estimator between the state schools that moved to municipality control and those that were already under it
1
β
= ∆ −
∆SM MM
3. and finally, the estimator that we are looking for, the DID estimator between the schools that moved to the municipality control and the schools under the states control.
3 1
β
β
+ = ∆ −∆SM SS ,
As discussed before we used the data from the 1997, 1999, 2001 and 2003 SAEBs and 2005 Prova Brasil from INEP- MEC. We used information only of schools that
matched in both tests. We restricted the analysis to the results of the math and reading tests of the students of the 4th grade.
5. Results
Equation 1 was estimated by ordinary least square and fixed effects separately for the reading and the math tests for the four matching years. Therefore we have a total of 16 panels, one for each of the 4 years of SAEB, 1997, 1999, 2001 and 2003, compared to Prova Brasil-2005, for each subject, math and reading, and for the estimation methods, OSL and FE.
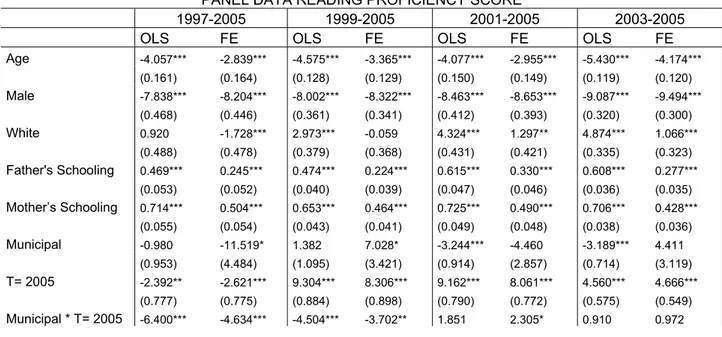
Table 11 shows the results for the reading test of the four panels for the 4 SAEBs-Prova Brasil cohorts of schools. The constant captures the omitted dummies: female and non white/yellow individuals. With respect to the control variables the first thing to notice is that the classical result of girls doing better in reading than boys is also true for Brazil. As for the remaining variables, the expected result also holds: the older the student the lower the score, the more educated the parents the better the results and whites tend to perform better but not always than non whites. What is interesting is that although the coefficients are not very different, except for sex, FE estimators tend to be lower than OLS, indicating a positive bias between young, white, with more educated parents students and schools characteristics fixed between the two periods..
Table 11
PANEL DATA READING PROFICIENCY SCORE
1997-2005 1999-2005 2001-2005 2003-2005
OLS FE OLS FE OLS FE OLS FE
Age -4.057*** -2.839*** -4.575*** -3.365*** -4.077*** -2.955*** -5.430*** -4.174*** (0.161) (0.164) (0.128) (0.129) (0.150) (0.149) (0.119) (0.120)
Male -7.838*** -8.204*** -8.002*** -8.322*** -8.463*** -8.653*** -9.087*** -9.494***
(0.468) (0.446) (0.361) (0.341) (0.412) (0.393) (0.320) (0.300)
White 0.920 -1.728*** 2.973*** -0.059 4.324*** 1.297** 4.874*** 1.066***
(0.488) (0.478) (0.379) (0.368) (0.431) (0.421) (0.335) (0.323)
Father's Schooling 0.469*** 0.245*** 0.474*** 0.224*** 0.615*** 0.330*** 0.608*** 0.277***
(0.053) (0.052) (0.040) (0.039) (0.047) (0.046) (0.036) (0.035)
Mother’s Schooling 0.714*** 0.504*** 0.653*** 0.464*** 0.725*** 0.490*** 0.706*** 0.428***
(0.055) (0.054) (0.043) (0.041) (0.049) (0.048) (0.038) (0.036)
Municipal -0.980 -11.519* 1.382 7.028* -3.244*** -4.460 -3.189*** 4.411
(0.953) (4.484) (1.095) (3.421) (0.914) (2.857) (0.714) (3.119)
T= 2005 -2.392** -2.621*** 9.304*** 8.306*** 9.162*** 8.061*** 4.560*** 4.666***
(0.777) (0.775) (0.884) (0.898) (0.790) (0.772) (0.575) (0.549)
(1.092) (1.105) (1.163) (1.174) (1.031) (0.998) (0.797) (0.758)
Constant 217.606*** 213.501*** 208.290*** 196.427*** 200.223*** 194.469*** 221.951*** 210.253***
(2.081) (3.012) (1.756) (2.592) (1.854) (2.458) (1.488) (2.183)
Number of obs. 27902 27902 46984 46984 37570 37570 62726 62764
F( k, n-k) 257.06 129.71 456,22 258,49 219,93 219,93 762,13 414,76
R-squared 0.0698 0.0535 0,0735 0,0615 0,0774 0,0735 0,0882 0,0698
The estimators of equations (vii)-(ix) computed from the coefficients from table 11 are shown in Table 12 that presents the difference in the proficiency between Prova Brasil and each SAEB for the groups of schools. We observe that that schools in the state system presented a more volatile behavior than the schools in the municipal or those that migrated from the state to the municipal systems.
Table 12
Differences in Reading Scores Between Group of Schools
1997-2005 1999-2005 2001-2005 2003-2005
∆S-S(
β
2) -11,519 7,028 -4,460 4,411(4,484**) (3,421**) (2,857) (3,119)
∆M-M(
β
2+β
3) -7,255 4,604 10,366 5,638(0,801**) (0,762**) (0,634**) (0,522**)
∆S-M(
β
1+β
2+β
3) -18,774 11,632 5,906 10,049(4,427**) (3,337**) (2,793**) (3,082**) SD in parenthesis
Comparing with the unconditional differences that can be calculated from Table 5 above and are plotted in Figure 1 below, we observe that, controlling for individual characteristics and school fixed effect, the differences in scores in the reading test for the schools that remained in the state system, indicated by the red line, SS*, lay always below the blue line of the unconditional differences, increasing the negative differences and dumping the positives.
Differences in Performance Prova Brasil SAEBs
-15 -10 -5 0 5 10 15 20
1997 1999 2001 2003
Schools in the States Systems
SS SS*
For the schools that remained in the municipals system, Figure 2 shows a similar pattern although less pronounced: the conditional differences are larger than the unconditional for the negative differences and lower for the positives. Differently from the S-S group, in the M-M group all differences are significant as we can see in Table 12 above.
Figure2
Differences in Performance Prova Brasil SAEBs
-10 -5 0 5 10 15
1997 1999 2001 2003
Schools in the Municipals Systems
MM MM*
Prova Brasil, turns out to be a much larger negative difference when we take into account students characteristics and school fixed effect, while the modest improvement in 2003 becomes more significant.
Figure 3
Differences in Performance Prova Brasil SAEBs
-25 -20 -15 -10 -5 0 5 10 15
1997 1999 2001 2003
Schools that Migrated from State to Muncipal Systems
SM SM*
Finally, with respect to the difference in difference estimator, first we observe that controlling for students characteristics and school fixed effect only the 1997-2005 difference is close but higher than the unconditional one. The significant negative difference of 1999-2005 in the unconditional data is actually statically not different from zero when controls are included, as it is for the remaining years..
Table 13
Difference in Difference Estimators – Reading Scores 1997-2005 1999-2005 2001-2005 2003-2005 FE∆SM-SS -16,153 3,326 -2,155 5,383
(4,481**) (3,505) (2,879) (3,123)
Unconditionall ∆SM-SS -15,726 -5,430 -0,058 -1,441
(3,159**) (2,534**) (99999) (1,283)
SD in parenthesis
With respect to the math scores, we find similar results for the control variables, except for the impact of the sex of the student: in this case we also have the classical result of boys performing better than girls in math, although the impact is much lower than the negative impact on the reading test. For the remaining variables we have again that white, younger students with parents more educated tend to perform better with the fixed effect coefficients lower than the OLSs, indicating a positive bias between these characteristics and the unchanged characteristics of the schools.
Table 14
PANEL DATA MATH PROFICIENCY SCORE
OLS FE OLS FE OLS FE OLS FE
Age -3.764*** -2.454*** -3.869*** -2.632*** -3.723*** -2.475*** -4.917*** -3.471*** (0.153) (0.152) (0.123) (0.122) (0.142) (0.140) (0.115) (0.114)
Male 2.172*** 1.741*** 1.343*** 1.004** 1.922*** 1.753*** 1.460*** 0.973***
(0.442) (0.419) (0.343) (0.323) (0.389) (0.368) (0.306) (0.285)
White 2.418*** -0.542 3.519*** 0.282 4.492*** 1.098** 5.310*** 0.977**
(0.467) (0.448) (0.362) (0.349) (0.410) (0.395) (0.322) (0.306)
Father’s Schooling 0.421*** 0.201*** 0.370*** 0.178*** 0.483*** 0.236*** 0.515*** 0.217*** (0.050) (0.048) (0.039) (0.037) (0.044) (0.043) (0.034) (0.033)
Mother’s Schooling 0.558*** 0.399*** 0.563*** 0.440*** 0.664*** 0.469*** 0.634*** 0.412*** (0.052) (0.050) (0.040) (0.038) (0.047) (0.045) (0.036) (0.034)
Municipal -0.461 5.105 0.903 1.400 -3.737*** -5.161 -4.353*** 1.062
(0.887) (3.995) (1.007) (3.095) (0.862) (2.843) (0.668) (2.880)
T=2005 0.400 -0.042 3.918*** 3.101*** 5.128*** 4.572*** 3.664*** 3.572***
(0.724) (0.719) (0.814) (0.851) (0.742) (0.731) (0.546) (0.521)
Municipal * T=2005 -6.120*** -4.405*** -3.451** -2.881** 2.686** 2.691** 2.539*** 2.792*** (1.1022) (1.020) (1.073) (1.108) (0.973) (0.951) (0.751) (0.718)
Constant 213.530*** 200.124*** 208.878*** 199.037*** 203.022*** 195.377*** 219.862*** 206.922***
(1.974) (2.748) (1.669) (2.375) (1.771) (2.365) (1.429) (2.043)
.
Number of obsv 28188 28188 47029 47029 37024 37024 62932 62764
F( k, n-k) 183.13 62.29 280,82 113,39 265,11 109,79 558,3 218,11
R-squared 0.0523 0.0397 0,0472 0,0454 0,0562 0,0526 0,0673 0,0545
The estimators of equations (vii)-(ix) computed from the coefficients from table 12 for the math scores are shown in Table 13 with the following results:
Table 15
Differences in Math Scores Between Group of Schools
1997-2005 1999-2005 2001-2005 2003-2005
∆SS (
β
2) -0,042 3,101 4,572 3,572(0,719) (0,851**) (0,731**) (0,521**)
∆MM(
β
2 +β
3) -4,447 0,22 7,263 6,364(0,737**) (0,733) (0,612**) (0,493**)
∆SM(
β
1+β
2 +β
3) 0,658 1,62 2,102 7,426(3,798) (3,008) (2,784) (2,845**) SE in parenthesis
Figure 4
Difference in Performance Math Scores SAEB Prova Brasil
0 1 2 3 4 5 6
1997 1999 2001 2003
Schools in States Systems
∆SS ∆SS*
For the schools that remained in the municipal system, we observe, after the significant negative decrease in the 1997 -2005 tests, positive and significant, for 2001 and 2003, differences, all of them lower than suggested by the unconditional data.
Figure 5
Difference in Performance Math Scores SAEB Prova Brasil
-6 -4 -2 0 2 4 6 8 10
1997 1999 2001 2003
Schools in the Municipal System
With respect to the schools that migrated fro the state to the municipal systems we observe that after controlling for the students characteristics and schools fixed effects, the differences are less pronounced than the unconditional ones. On the other hand all differences are positive although significant only in 2003
Figure 6
Difference in Performance Math Scores SAEB Prova Brasil
-4 -2 0 2 4 6 8
1997 1999 2001 2003
Schools that Migrated from State to Muncipal System
∆SM ∆SM*
Finally with respect to the difference in difference estimator we observe an
oscillatory behavior but the differences like in the unconditional differences continue to be statistically insignificant.
Table 16
Difference in Difference Estimators – Math Scores
1997-2005 1999-2005 2001-2005 2003-2005
FE∆SM-SS 0,7 -1,481 -2,47 3,854
(0,754) (3,157) (2,871) (2,880)
Unconditional ∆SM-SS -3,09 -2,936 0,393 1,725
(2,906) (2,381) (1,965) (2,076)
SE in parenthesis
6. Conclusions
SAEB and later in Prova Brasil and create an experimental group of schools that were under state control in the SAEB exam and have migrated to the municipality control by the time of Prova Brasil, and a control group of schools that were under the state system all the time. Comparing ex ante the students in these two groups we observe that the results in terms of the proficiency tests were very similar as they were in their personal characteristics: similar proportion of boys and girls, of whites and non whites, about the same age and parents schooling. Comparing ex post we observe that the change in the proficiency results of the two groups, the DID estimator is not significant except for the reading test of the first SAEB exam when the control group, the schools that have remained under the states control, performed better. For the math test the DID estimators were not significant.
7. References
Albernaz, A. Ferreira F, Franco C (2002) Qualidade e equidade no ensino fundamental brasileiro. PPE v 32 no 3, dez.
D’Atri, F (2007), Municipalização Do Ensino Fundamental da Rede Pública. Os impactos sobre o desempenho escolar. Fundação Getúlio Vargas, Escola de Economia de São Paulo. Araújo, G,C. Município, Federação e Educação História das Instituições e das Idéias Políticas No Brasil, tese de doutorado Faculdade de Educação da Universidade de São Paulo.
Barros, R.P., Mendonça R, Santos, D. S. Quintaes, G. (2001) Determinantes do desempenho Educacional no Brasil, PPE v 31 no 1.
Fuller, B (1990). Raising School Quality in Developing Countries: What Investments Boosts Learning? Discussion Paper 76. Washington: World Bank.
Fuller, B and P. Clarke (1994). Raising School Effects While Ignoring Cultura, Local Conditions and the Influence of Classroom Tools, Rules and Pedagogy. Review of
Educational Research 64(1):119-157.
Gil, J. Arellano, L (2004) Municipalização do Ensino Brasileiro, in Gil, J. Educação Municipal, Estação Palavra, Ubatuba.
Hanushek, E (1995). Interpreting Recent Research on Schooling in Developing Countries.
World Bank Research Observer 10(2): 227-46.
Maderia, R. (2007) The Effect of Descentralization on Schooling: Evidence from São Paulo State´s Education Reform, Mimeo FEA-USP.
Oliveira, R.P (1997) A Municipalização do Ensino no Brasil in Oliveira, D. Gestão Democrática da educação. Editora Vozes Petrópolis, R.J.
Pinto, J. M. (2000) Os Recursos para Educação no Brasil no Contexto das Finanças Públicas. Editora plana, Brasília.