Long-term modelling of nitrogen turnover and critical loads in a
forested catchment using the INCA model
Jens-Johann Langusch and Egbert Matzner
Department of Soil Ecology, Bayreuth Institute for Terrestrial Ecosystem Research (BITÖK),University of Bayreuth, D-95440 Bayreuth, Germany
Email for corresponding author: [email protected]
Abstract
Many forest ecosystems in Central Europe have reached the status of N saturation due to chronically high N deposition. In consequence, the
NO3 leaching into ground- and surface waters is often substantial. Critical loads have been defined to abate the negative consequences of the
NO3 leaching such as soil acidification and nutrient losses. The steady state mass balance method is normally used to calculate critical loads
for N deposition in forest ecosystems. However, the steady state mass balance approach is limited because it does not take into account hydrology and the time until the steady state is reached. The aim of this study was to test the suitability of another approach: the dynamic model INCA (Integrated Nitrogen Model for European Catchments). Long-term effects of changing N deposition and critical loads for N were simulated using INCA for the Lehstenbach spruce catchment (Fichtelgebirge, NE Bavaria, Germany) under different hydrological conditions.
Long-term scenarios of either increasing or decreasing N deposition indicated that, in this catchment, the response of nitrate concentrations in runoff to changing N deposition is buffered by a large groundwater reservoir. The critical load simulated by the INCA model with respect to a nitrate concentration of 0.4 mg N l–1 as threshold value in runoff was 9.7 kg N ha–1 yr–1 compared to 10 kg ha–1 yr–1 for the steady state
model. Under conditions of lower precipitation (520 mm) the resulting critical load was 7.7 kg N ha–1 yr–1, suggesting the necessity to account
for different hydrological conditions when calculating critical loads. The INCA model seems to be suitable to calculate critical loads for N in forested catchments under varying hydrological conditions e.g. as a consequence of climate change.
Key words:forest ecosystem, N saturation, critical load, modelling, long-term scenario, nitrate leaching, critical loads reduction, INCA
Introduction
Under high atmospheric N deposition, many forest ecosystems in Central Europe have reached the status of N saturation in the last decades. According to Aber et al. (1989), the status of N saturation is reached when the deposition of N and N mineralisation exceed the biological N demand resulting in enhanced nitrate fluxes with soil solution and runoff. In response to this and other pollutants, the critical load concept was developed (Nilsson, 1986; Nilsson and Grennfelt, 1988; van der Salm and de Vries, 2001). Critical loads for N can be defined as: “A quantitative estimate of an N deposition rate below which significant harmful effects on specified sensitive elements of the environment do not occur according to present knowledge” (Nilsson and Grennfelt, 1988; Bull, 1993). Nutritional disturbances, vegetation changes, N loss as denitrification and nitrate leaching may be considered as harmful effects.
Often the steady state mass balance method (SSMB) is used to determine critical loads for N (Cresser, 2000). Its calculation requires estimates (or measurements) of long-term average fluxes for the major N sinks of the ecosystem (Posch et al., 1993; Werner et al., 1999):
CL(N) = Nu(crit) + Ni(crit) + [Nl(acc) / (1 – fde)], - Nu(crit) = net N uptake in biomass under critical load
[kg ha–1 yr–1]
- Ni(crit) = N immobilisation under critical load [kg ha–1 yr–1]
- Nl(acc) = ‘acceptable’ N output with seepage [kg ha–1 yr–1]
- fde = denitrification factor [0 < fde < 1].
are no feedbacks between deposition and sinks, and no relationships to hydrological conditions. As an example, the SSMB cannot account for the fact that deposition in winter is more likely to be transferred to runoff than that in summer, when the activity of N sinks is higher. Furthermore, the N sinks need to be estimated at the critical load input. This is difficult to assess since the rates of such processes of the N cycle as denitrification, nitrification and plant uptake are in part dependent on concentrations of NH4 and NO3 in soil solutions (van Miegroet and Johnson, 1993; Berger et al., 1995; Jochheim et al., 1995; Papen and Butterbach-Bahl, 1999). The mineral N concentration of soil solutions is influenced by uptake, denitrification, ammonification, nitrification, hydrological conditions and by the actual N deposition and is thus highly variable over time. The SSMB approach is not capable of taking the high temporal variations of concentrations into account since only annual fluxes are considered.
Dynamic models have been applied for both short and long-term responses of ecosystems to changing N deposition (Kjonaas and Wright, 1998; Tietema et al., 1998, Wright et al., 1998 a, b) and for the calculation of critical loads for acidity (Gregor et al., 1996; Walse et al., 1998; Becker et al., 2000), but not for the calculation of critical loads for N. The aim of this study was to test the suitability of the dynamic model INCA (Integrated Nitrogen Model for European Catchments, version 1.6; Wade et al., 2002) to simulate long-term effects of changing N deposition and to assess critical loads for N for the Lehstenbach catchment (Fichtelgebirge, NE Bavaria, Germany) under different hydrological conditions.
SITE
The Lehstenbach catchment (419 ha) is located in the Fichtelgebirge, NE Bavaria, Germany, 50°08’ N, 11°52’ E at 690-871 m.a.s.l. The average air temperature is 5.8°C and the mean annual precipitation is 1100 mm (Bittersohl and Lischeid, 1995). Bedrock is granite and the dominating soil types are acidic Cambisols, Gleysols and Histosols (FAO-System). About 35 % of the catchment is covered by wetlands. The catchment is stocked with Norway spruce (Picea abies (L.) Karst.) of 45 to 140 years age.
Runoff is at a minimum in summer with a baseflow of about 0.25 mm d–1. Snow cover and snow melt have a
substantial effect on winter and spring hydrology (Bittersohl and Lischeid, 1995). The Lehstenbach catchment has a highly weathered and deep (up to 40 m) aquifer. During calibration of the INCA model (Langusch and Matzner, 2002) to the hydrological conditions, the groundwater volume was estimated at 8 × 10⁶ m3; equivalent to about
2000 l m–2. The size of the groundwater reservoir is
determined by field measurements of the groundwater table and the porosity of the bedrock.
In contrast to throughfall, mineral N in soil solutions and in runoff is almost completely represented by NO3 (Langusch and Matzner, 2002). The mean NO3 concentration observed in runoff from 1993–1999 was about 0.9 mg N l–1. Furthermore, there was a seasonal pattern with lower
NO3 concentrations in summer and autumn followed by higher concentrations in winter and spring. The concentrations of NO3 are not related to discharge volume (Langusch and Matzner, 2002).
The fluxes of mineral N with throughfall were on average 21 kg N ha–1 yr–1 in the period 1995–1999. Taking the
throughfall fluxes of N as deposition input and stream water fluxes as output, the Lehstenbach catchment retains (including estimated gaseous emissions) about 17 kg N ha–1 yr–1. In the wetlands, the concentration of nitrate in soil
solution is low (Bittersohl and Lischeid, 1995) which may be partly due to denitrification (Matzner et al., 2001).
PARAMETERISATION OF THE INCA MODEL
The INCA model simulates flow pathways, N turnover, fluxes, and concentrations of both NO3 and NH4 in the soil, the groundwater and the river (Whitehead et al., 1998a, b). The model was calibrated to the measured mean concentration of nitrate in runoff (0.9 mg N l–1) and to the
seasonal dynamics of NO3 in the stream, using an annual N deposition of 21 kg ha–1 a–1 (Langusch and Matzner, 2002).
For the calibration phase 1995–1999 the N-input was implemented in the model with an NH4/NO3-ratio of about 0.75. The soil N pools were assumed to be constant (Table 1) and, subsequently, the rates of mineralisation, immobilisation and biological N2-fixation were set to zero. Only one forest type was postulated. The plant growth period was set to 160 days and plant uptake was adjusted to result in the N demand for net increment of the tree biomass of about 10 kg ha–1 a–1 (Feger, 1993; Matzner, 1988).
To take account of the large area of wetlands, the denitrification rate for the catchment was adjusted during the calibration to relatively high rates, since measurements of gaseous N emissions were not available. Under these conditions the average partitioning of N deposition was 9 kg N ha–1 a–1 taken up by plants, 6.3 kg N ha–1 yr–1 being lost by
denitrification and 5.4 kg N ha–1 yr–1 lost with runoff
(Langusch and Matzner, 2002).
temperature, actual throughfall, discharge and mineral N-concentrations were compiled.
According to the parameterisation, the unsaturated soil zone comprises 59% of the NO3 in runoff. The groundwater flow comprises the remaining 41%.
In the INCA model uptake and denitrification are both linearly dependent on the inorganic dissolved N concentration in soil solution. Besides the concentration in soil solution, N uptake is regulated by the duration of the growing season, and the maximum annual uptake rates. Plant uptake and denitrification cease if soil water deficits exceed 40 mm. Denitrification, furthermore, is dependent on temperature. In all, three scenarios were investigated. Two
deposition scenarios were performed to test the suitability of the model for long-term simulations using the parameter set of the calibration phase with minor simplifications: No in-stream processes were allowed, the N-input was implemented as wet only deposition with an NH4/NO3-ratio of 1.
In scenario 1, a linear increase of N deposition from 1 to 20 kg ha–1 yr–1 over 50 years was simulated, followed by a
linear decrease back to the start conditions over the next 50 years.
In scenario 2 a linear increase of N deposition over 50 years from 1 to 20 kg ha–1 yr–1 was followed by a constant
deposition up to year 56 and a sudden reduction to 0 kg N ha–1 yr–1, remaining at zero over the next 44 years.
In a third scenario the influence of the hydrological conditions on the N sinks and the critical loads was assessed. The same deposition time series as in scenario 1 was applied. The hydrologically effective rainfall and the sustain flow in the saturated zone were halved. The limit of soil moisture deficit (SMD) at which denitrification ceases was set to 100 mm. These hydrological conditions apply to low elevation catchments in Germany.
CALCULATING CRITICAL LOADS WITH INCA
A critical N-deposition rate can be derived with the objective of avoiding N pollution of surface- and groundwater, since N in runoff is a very sensitive indicator of changes in N cycling within the ecosystem (Wright et al., 1998a). A concentration of about 0.4 mg NO3-N l–1 in runoff was
defined as threshold, corresponding to an N loss with runoff of about 2 kg N ha–1 yr–1 under current hydrological
conditions. The critical N deposition was determined by iteration of the N deposition using the model parametrisation from the calibration phase. The actual precipitation was used as well as the scenario with halved precipitation.
Results
Critical load for N deposition assessed by INCA
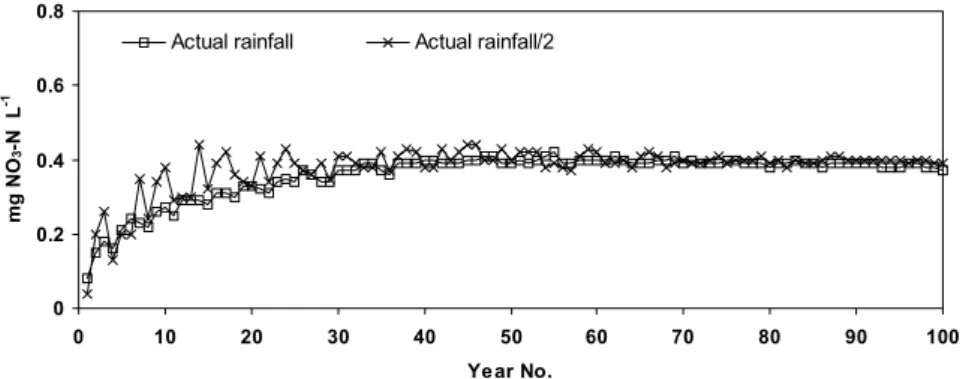
The iterative change of N deposition under average hydrological conditions resulted in a critical load of 9.7 kg N ha–1 yr–1. At that input the chosen threshold runoff
concentration of 0.4 mg N l–1 was reached after about 40
years (initial conditions in groundwater of 0 mg N l–1) and
was almost constant from then on (Fig. 1). According to the chosen model parametrisation, the partitioning of N deposition under these conditions was 3.9 kg N ha–1 a–1 taken
up by plants, 3.6 kg ha-1 a-1 lost by denitrification and
2.7 kg N in runoff (store: –0.5 kg N ha–1 yr–1).
Table 1. Parameters of the INCA model
Denitrification m day–1 0.007
Nitrogen fixation (kg N ha–1 day–1) 0
Nitrification m day–1 0.025
Mineralisation (kg N ha–1 day–1) 0
Immobilisation m day–1 0
Soil moisture Deficit maximum (mm) 40
Max. temperature difference (°C) 4.5
Sustain Surface flow at (m³ s–1) 0
Sustain Sub-surface flow at (m³ s–1) 0.007
Stop denitrification at (°C) 0
Stop nitrification at (°C) 0
Fertilizer addition start day 0
Fertilizer addition period (days) 0
Nitrate addition rate (kg N ha–1day–1) 0
Ammonium addition rate (kg N ha–1day–1) 0
Plant growth start day 90
Plant growth period (days) 160
Nitrate uptake rate m day–1 0.01
Ammonium uptake rate m day–1 0.8
Maximum uptake (kg N ha–1yr–1) 70
VrMax (depth x porosity) 0.2
Soil reactive zone (days) 1
Groundwater zone (days) 40
Initial Surface flow (m³ s–1) 0
Initial Surface nitrate (mg l–1) 0
Initial Surface Drainage volume (m³) 1000
Initial Sub-surface flow (m³ s–1) 0
Initial Sub-surface nitrate (mg l–1) 0
Initial Sub-surface Drainage volume (m³) 8E6 Instream Denitrification rate (day–1) 0
Instream Ammonium nitrification rate (day–1) 0
Reach parameter a 0.04
Reach parameter b 0.67
Hydrological conditions influenced the critical load calculation. Under low precipitation (reduction of about 50%), the calculated critical load was 7.7 kg N ha–1 yr–1 .
The partitioning of N deposition under changed conditions was 3.6 kg N ha–1 yr–1 taken up by plants, 3.6 kg ha–1 yr–1
lost by denitrification and 0.5 kg N ha–1 a–1 in runoff
indicating a greater efficiency of plant uptake and denitrification as N sinks in comparison to scenario 1.
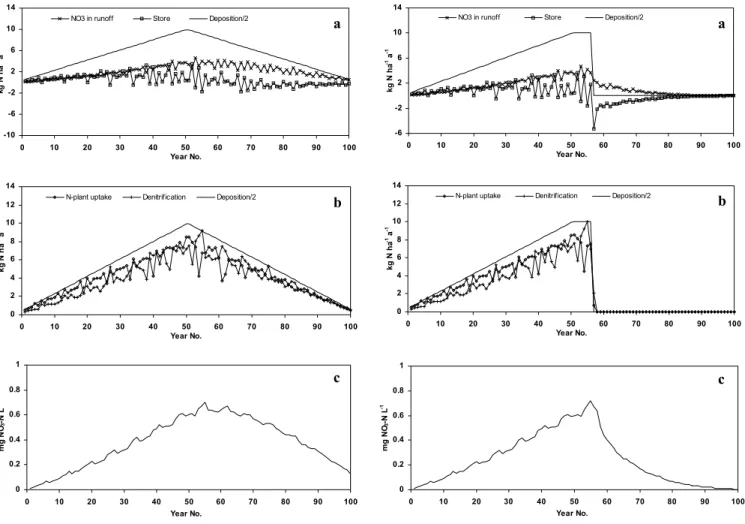
Scenario 1: In dry years NO3 leaching is low and a considerable amount of the N input is stored in the catchment (Fig. 2a). During wet years the NO3 leaching increases, since the previously stored NO3 is mobilised. Under high N deposition the difference in NO3 leaching was greater between wet and dry years. The variation is caused by the different precipitation and runoff rates in the single years. Plant uptake and denitrification as concentration dependent processes increased or decreased linearly with changing deposition (Fig. 2b). Under high deposition rates the annual variation of both processes increased, especially that of denitrification. During the increase in deposition the proportion of N deposited taken up by the plants was slightly higher than the proportion denitrified (Fig. 2b). In the two years of maximum deposition (20 kg N ha–1 yr–1), the model
predicted an average uptake of the deposited N of 8.5 kg ha–1 yr–1 and a denitrification loss of about 7.4 kg ha–1 yr–1
(Fig. 2b) The defined threshold of N in runoff (0.4 mg N l–1) was reached after about 33 years (Fig. 2c). The
threshold under decreasing N input was reached 33 years after the deposition maximum (year 84), as well. The peak concentration of about 0.7 mg N l–1 in runoff was reached
in year 55, four years after the maximum N deposition. Under increasing deposition the N budget of the catchment was slightly positive. Under decreasing N deposition, the N budget became negative indicating nitrate release from the groundwater store (Fig. 2a). Over the whole period of 100 years the groundwater stored only 0.9 kg N ha–1.
Scenario 2: The sudden decline in N deposition from 20 to 0 kg N ha–1 yr–1 (Fig. 3a) had an immediate effect on uptake
and denitrification (Fig. 3b). The N input from deposition was considered the only source of N in the model and thus the quick response and decrease to zero is not surprising. The response of the NO3 concentrations and fluxes in runoff were delayed by release of NO3 from the groundwater store, but still the response predicted by the model was quick (Fig. 3a, c) being caused by the proportion of nitrate in runoff generated from the unsaturated zone. Four years after the sudden decrease of deposition, the defined critical concentration of 0.4 mg N l–1 was passed (Fig. 3c). The
“pre-industrial” level of the N in runoff (< 0.1 mg l–1) was
reached after 21 years.
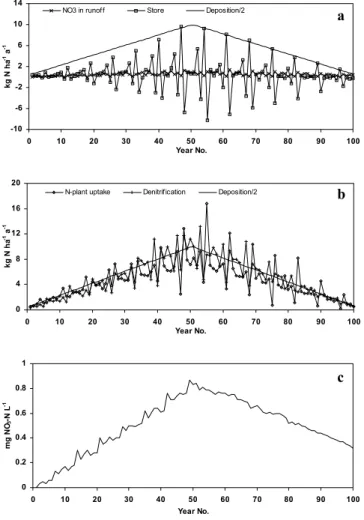
Scenario 3: Like scenario 1, the annual variation of N-plant uptake and denitrification increased under increasing N deposition and half of the actual precipitation (Fig. 4a, b). In dry years the N fluxes to plant uptake and to denitrification were low whereas in wet years the N consumption by denitrification and especially plant uptake increased strongly being concentration-dependent processes. The maximum plant uptake was 16.7 kg N ha–1 yr–1, predicted for year 55
(Fig. 4b). The annual dynamics of plant uptake and denitrification led to a strong positive N budget of the catchment in dry years whereas the N budget in wet years was negative. As a result of the N-partitioning calculated by the model, the NO3 leaching remained below 2 kg N ha–1 yr–1, even under maximum deposition.
The defined threshold of N in runoff (0.4 mg N l–1) was
reached after about 21 years (Fig. 4), 12 years earlier than under actual precipitation. Under decreasing N input the threshold was reached 43 years after the deposition maximum (year 93). The peak concentration of about 0.87 mg N l–1 in runoff was reached in year 49, one year
before the maximum N deposition. Over the whole period of 100 years, the groundwater stored 35.5 kg N ha–1.
0 0.2 0.4 0.6 0.8
0 10 20 30 40 50 60 70 80 90 100
Ye ar No.
mg NO
3
-N L
-1
Actual rainfall Actual rainfall/2
Fig. 1. NO3-N concentration in runoff under current rainfall with constant N deposition of about 9.7 kg ha
-1 yr
-10 -6 -2 2 6 10 14
0 10 20 30 40 50 60 70 80 90 100
Year No.
kg
N
h
a
-1 a
-1
NO3 in runoff Store Deposition/2
0 2 4 6 8 10 12 14
0 10 20 30 40 50 60 70 80 90 100
Year No.
kg
N
h
a
-1 a
-1
N-plant uptake Denitrification Deposition/2
0 0.2 0.4 0.6 0.8 1
0 10 20 30 40 50 60 70 80 90 100
Year No.
mg
N
O3
-N
L
-1
-6 -2 2 6 10 14
0 10 20 30 40 50 60 70 80 90 100
Year No.
kg N ha
-1 a
-1
NO3 in runoff Store Deposition/2
0 2 4 6 8 10 12 14
0 10 20 30 40 50 60 70 80 90 100
Year No.
kg N ha
-1 a
-1
N-plant uptake Denitrification Deposition/2
0 0.2 0.4 0.6 0.8 1
0 10 20 30 40 50 60 70 80 90 100
Year No.
mg NO
3
-N L
-1
Fig. 2. The fluxes NO3-N in runoff, changes in stored N, N plant
uptake, denitrification and NO3-N concentration in runoff calculated
in scenario 1.
Fig. 3. The fluxes NO3-N in runoff, changes in stored N, N plant
uptake, denitrification and NO3-N concentration in runoff calculated
in scenario 2.
Discussion
The steady state mass balance approach for critical load calculations is based on estimates of the annual rates of N sinks, especially plant uptake, immobilisation and denitrification (Gregor et al., 1996). In contrast to SSMB, the INCA model takes hydrology, short-term temporal variations and concentration dependencies into account and calculates the sinks. Thus, if the model is calibrated to the site its predictions of the N sinks at the critical load have a better rationale compared to the SSMB. With INCA a more detailed and site-specific assessment of critical loads for N at the catchment scale seems possible.
The parameterisation of the N turnover in the INCA model is still simplistic (e.g. denitrification is linearly dependent on NO3 concentrations; no rooting patterns considered, no long-term changes in process rates). However, given the scale of the model and its attempted application in management practices, simplifications are necessary. The predicted critical load (9.7 kg N ha–1 yr–1) for the
Lehstenbach catchment was similar to a SSMB estimate for
the Fichtelgebirge area of 10 kg N ha–1 yr–1 which was
suggested by Werner et al. (1999). However, by the application of INCA further conclusions became possible: The results of the hydrological scenario with current and halved precipitation indicated that the critical loads under dry conditions are lower than under wet conditions if the NO3 concentration in runoff is chosen as threshold. However, since denitrification and N-uptake respond to higher frequencies and intensities of soil water deficit and to higher concentrations in soil solutions at different time periods, the reduction in critical load was not a single linear proportion of the reduction in water input.
The model prediction of the response to changing deposition is dominated by the concentration dependency of the N sinks. Nitrogen uptake and denitrification increase linearly with deposition and are also influenced by soil moisture deficit. As a consequence, NO3 in runoff also increases linearly and decreases with deposition, if groundwater storage is neglected. This model performance seems somewhat unrealistic, since in many forested
a
b
c
a
b
catchments, the NO3 concentrations in runoff today are close to zero, despite rather high rates of deposition (Dise et al., 1998). This might be due to the fact that in our model parametrisation additional N sinks by immobilisation and N accumulation in litter are not considered. The latter would have reduced the level of NO3 in runoff, but the general dependency of NO3 in runoff on deposition development remains.
Wright et al. (1998 a, b) applied MERLIN (Model of Ecosystem Retention and Loss of Inorganic Nitrogen; Cosby et al., 1997) and MAGIC7 (Model of Acidification of Groundwaters in Catchments; Cosby et al., 1985) to the NITREX sites Aber, UK and Risdalsheia, Norway (RAIN and CLIMEX projects). In some short-term applications (10–15 years), the general level and temporal variation of NO3 in runoff was matched. MERLIN and MAGIC7 consider the soil organic layer as the only N pool within a catchment and neglect the groundwater store. Further conclusions about the capability of long-term simulations
can be drawn by the comparison of MERLIN with INCA under a sudden cessation of the N input. The response of INCA to a sudden decrease in N deposition was rather quick since the lack of N inputs causes a quick response of soil solution concentrations and soil processes which can be ascribed to the fact that the internal processes like mineralisation and immobilisation were neglected for simplification. Tietema et al. (1998) applied MERLIN for modelling a sudden decrease of NO3 leaching in a Douglas fir forest in the Netherlands due to experimental manipulation. MERLIN could only simulate the fast response of NO3 leaching after changing the parametrisation by decreasing the mineralisation rate of ROM (Refractory Organic Matter). In the case of the Lehstenbach catchment a change in the parametrisation was not necessary. The response of NO3 in runoff to the sudden decrease in deposition was delayed by the large groundwater body. The soil internal processes and concentrations responded quickly which corresponds to results from similar experimental reduction of N inputs in “roof-experiments” (Bredemeier et al., 1998a, b; Boxman et al., 1998). In these studies, a sudden decrease of the N deposition caused a strong decline of the NO3 in soil solutions to almost zero within one to two years.
The groundwater body determines to a large degree the response time of nitrate in runoff to changing inputs. The critical load calculation (Fig. 1) showed that with initial concentrations of 0 mg N l–1 in groundwater and a constant
input of 9.7 kg N ha–1yr–1 it takes about 40 years to reach
the critical concentration of 0.4 mg N l–1 in runoff. The model
suggests a time period of about 30 years until the concentrations in runoff are < 0.1 mg N l–1 if deposition
decreased suddenly. Furthermore, the model suggests that a linear decrease of N inputs over 50 years from the present levels to zero will result in runoff concentrations < 0.4 mg N l–1 after about 30 years. These examples demonstrate
that the recovery of the runoff of the Lehstenbach catchment from the present NO3 load may take several decades, even if optimistic deposition scenarios are assumed.
Conclusions
The application of the INCA model to a small forested catchment indicated the general applicability of the model for regional and long-term analysis of N fluxes. Following the calibration of the model, scenarios of changing deposition offer estimates of response times and suggest critical loads under various conditions and different criteria. Additionally to the SSMB method INCA allows a more detailed prognosis of critical loads under changing hydrological conditions, since it takes temporal variations -10
-6 -2 2 6 10 14
0 10 20 30 40 50 60 70 80 90 100
Year No.
kg N ha
-1 a
-1
NO3 in runof f Store Deposition/2
0 4 8 12 16 20
0 10 20 30 40 50 60 70 80 90 100
Year No.
kg N ha
-1 a
-1
N-plant uptake Denitrif ication Deposition/2
0 0.2 0.4 0.6 0.8 1
0 10 20 30 40 50 60 70 80 90 100
Year No.
mg NO
3
-N L
-1
Fig. 4. The fluxes NO3-N in runoff, changes in stored N, N plant
uptake, denitrification and NO3-N concentration in runoff calculated
in scenario 3.
a
b
of the groundwater store and N concentrations into account. Gaseous emissions are highly important for the N budget at the Lehstenbach catchment. At the moment the calculation of critical loads for N is hampered by the lack of measurements for N2O/NO. Subsequently, the denitrification rates still have to be estimated. An improvement for the calculation of critical loads with INCA can be the examination of gaseous N emissions from the different soil types in the Lehstenbach catchment.
Acknowledgement
This work was funded by the EU under grant No. EVK1-CT1999-00011 and by the German Ministry of Education, Science and Technology (BMBF; grant No. BEO 0339476D). The authors thank Drs Bernhard Manderscheid, Christine Alewell and Gunnar Lischeid for providing data on N fluxes as well as Uwe Hell, Andreas Kolb, Jan Irmler and the members of the Central Analytic Department of BITÖK (Bettina Popp, Petra Dietrich and Kerstin Moser) for their long-lasting help in field sampling and chemical analysis of soil and water samples.
References
Aber, J.D., Nadelhoffer, K.J., Steuder, P. and Melillo, J.M., 1989. Nitrogen Saturation in Northern Forest Ecosystems. BioSci.,
39, 378–386.
Becker, R., Block, J., Schimming, C.-G., Spranger, T. and Wellbrock, N., 2000. Critical Loads für Waldökosysteme -Methoden und Ergebnisses für Standorte des Level II-Programms. Arbeitskreis A der Bund-Länder Arbeitsgruppe Level II, Bundesministerium für Ernährung, Landwirtschaft und Forsten (BML), 71pp.
Berger, A., Oren, R. and Schulze, E.-D., 1995. Ammonium- und Nitrataufnahme über die Wurzeln von Fichtenkeimlingen, Umweltbundesamt, Texte, 28/95, 69–79.
Bittersohl, J. and Lischeid, G., 1995. Hydrogeologie und Abflußverhalten im Einzugsgebiet Lehstenbach. In:
Wassereinzugsgebiet ‘Lehstenbach’ - das BITÖK-Untersuchungsgebiet am Waldstein (Fichtelgebirge, NO-Bayern). B. Manderscheid and A. Göttlein (Eds.). bfö, 18, 40– 48.
Boxman, A.W., van der Ven, P.J.M. and Roelofs, J.G.M., 1998. Ecosystem recovery after a decrease in nitrogen input to a Scots pine stand at Ysselsteyn, the Netherlands. Forest Ecol. Manage.,
101, 155–163.
Bredemeier, M., Blanck, K., Dohrenbusch, A., Lamersdorf, N., Meyer, A.C., Murach, D., Parth, A. and Xu, Y.-J., 1998a. The Solling roof project - site characteristics, experiments and results. Forest Ecol. Manage., 101, 281–293.
Bredemeier, M., Blanck, K., Xu, Y.-J., Tietema, A., Boxman, A.W., Emmett, B., Moldan, F., Gundersen, P., Schleppi, P. and Wright, R.F., 1998b. Input-output budgets at the NITREX sites. Forest Ecol. Manage., 101, 57–64.
Bull, K.R., 1993. Development of the critical loads concept and the UN-ECE mapping programme. In: Critical loads: concept and applications. M. Hornung and R.A. Skeffington (Eds.). London: HMSO, 8–10.
Cosby, B.J., Wright, R.F., Hornberger, G.M. and Galloway, J.N., 1985. Modelling the effects of acid deposition: Assessment of a lumped parameter model soil water and streamwater chemistry.
Water Resour. Res., 21, 51–63.
Cosby, B.J., Ferrier, R.C., Jenkins, A., Emmett, B.A., Wright, R.F. and Tietema, A., 1997. Modelling the ecosystem effects of nitrogen deposition at the catchment scale: Model of Ecosystem Retention and Loss of Inorganic Nitrogen (MERLIN). Hydrol. Earth Syst. Sci., 1, 137–158.
Cresser, M.S., 2000. The critical loads concept: milestone or millstone for the new millennium? Sci. Tot. Environ., 249, 51– 62.
Dise, N.B., Matzner, E. and Gundersen, P., 1998. Synthesis of nitrogen pools and fluxes from European forest ecosystems.
Water Air Soil Pollut., 105, 143–154.
Feger, K.-H., 1993. Bedeutung von ökosysteminternen Umsätzen und Nutzungseingriffen für den Stoffhaushalt von Waldökosystemen. Freiburger Bodenkundliche Abhandlungen,
31, 237 pp.
Gregor, H.-D., Werner, B. and Spranger, T., 1996. Manual on methodologies and criteria for mapping critical levels/loads and geographical areas where they are exceeded. Umweltbundesamt,
Texte, 71/96, 144pp.
Jochheim, H., Gerke, H.H. and Hüttl, R., 1995. Auswirkungen von Stickstoff auf den Ernährungszustand von Waldbeständen. Umweltbundesamt, Texte, 28/95, 107–119.
Kjonaas, O.J. and Wright, R.F., 1998. Nitrogen leaching from N limited forest ecosystems: the MERLIN model applied to Gardsjön, Sweden. Hydrol. Earth Syst. Sci., 2, 415–429. Langusch, J.-J. and Matzner, E., 2002. N fluxes in two nitrogen
saturated forested catchments in Germany: Dynamics and modelling with INCA. Hydrol. Earth Syst. Sci., 6, 383–394. Matzner, E., 1988. Der Stoffumsatz zweier Waldökosysteme im
Solling. Ber. d. Forschungszentrums Waldökosysteme/Wald-sterben d. Univ. Göttingen, Reihe A, 40, 217 pp.
Matzner, E., Alewell, C., Bittersohl, J., Lischeid, G., Kammerer, G., Manderscheid, B., Matschonat, G., Moritz, K., Tenhunen, J.D. and Totsche, K., 2001. Biogeochemistry of a spruce forest catchment of the Fichtelgebirge in response to changing atmospheric deposition. In: Ecosystem Approaches to Landscape Management in Central Europe. J.D. Tenhunen, R. Lenz and R. Hantschel (Eds.). Springer-Heidelberg, Ecol. Stud., 147, 463– 504.
Nilsson, J. (Ed.), 1986. Critical loads for sulphur and nitrogen. Nordisk Ministerrad, Miljö Rapport, 11, 232pp.
Nilsson, J. and Grennfelt, P., 1988. Critical loads for sulphur and nitrogen: report. Copenhagen: Nordic Council of Ministers, 15, 343pp.
Papen, H. and Butterbach-Bahl, K., 1999. A 3-year continuous record of nitrogen trace gas fluxes from untreated and limed soil of a N-saturated spruce and beech forest ecosystem in Germany 1. N2O emissions. J. Geophys. Res., 104, 487–503. Posch, M., Hettelingh, J.-P., Sverdrup, H.U., Bull, K. and de Vries,
W., 1993. Guidelines for the computation and mapping of critical loads and exceedances of sulphur and nitrogen in Europe. In:
Calculation and mapping of critical loads in Europe. R.J. Downing, J.-P. Hettelingh and P.A.M. de Smet (Eds.). CCE Status Report, Bilthoven, 25–38.
Tietema, A., Emmett, B.A. and Cosby, B.J., 1998. Applying MERLIN for modelling nitrate leaching in a saturated Douglas fir forest in the Netherlands after decreased atmospheric nitrogen input. Hydrol. Earth Syst. Sci., 2, 431–438.
van der Salm, C. and de Vries, W., 2001. A review of the calculation procedure for critical acid loads for terrestrial ecosystems. Sci. Tot. Environ., 271, 11–25.
van Miegroet, H. and Johnson, D.W., 1993. Nitrate dynamics in forest soils. In: Nitrate: Processes, patterns and management.
T.P. Burt, A.L. Heathwaite and S.T. Trudgill (Eds.). Wiley, Chichester, UK, 75–97.
Walse, C., Blanck, K., Bredemeier, M., Lamersdorf, N., Warfvinge, P. and Xu, Y.-J., 1998. Application of the SAFE model to the Solling clean rain roof experiment. Forest Ecol. Manage., 101, 307–317.
Werner, B., Henze, C.-H. and Nagel, H.-D., 1999. Critical loads für den Stickstoffeintrag, In: Ökologische Belastungsgrenzen Critical loads & Levels. H.-D. Nagel and H.-D. Gregor (Eds.). Springer Berlin, 80–110.
Whitehead, P.G., Wilson, E.J. and Butterfield, D., 1998a. A semi-distributed Integrated Nitrogen model for multiple source assessment in Catchments (INCA): Part I - model structure and process equations. Sci. Tot. Environ., 210/211, 547–558.
Whitehead, P.G., Wilson, E.J., Butterfield, D. and Seed, K., 1998b. A semi-distributed integrated flow and nitrogen model for multiple source assessment in catchments (INCA): Part II -application to large river basins in south Wales and eastern England. Sci. Tot. Environ., 210/211, 559–583.
Wright, R.F., Beier, C. and Cosby, B.J., 1998a. Effects of nitrogen deposition and climate change on nitrogen runoff at Norwegian boreal forest catchments: the MERLIN model applied to Risdalsheia (RAIN and CLIMEX projects). Hydrol. Earth Syst. Sci., 2, 399–414.