729
Calibration of the INCA model in a Mediterranean forested
catchment: the effect of hydrological inter-annual variability in an
intermittent stream
S. Bernal
1, A. Butturini
2, J.L. Riera
1, E. Vázquez
1and F. Sabater
11Departament d´Ecologia, Facultat de Biologia, Universitat de Barcelona. Diagonal 645, 08028- Barcelona, Spain 2Institut de Ciències de la Terra Jaume Almera (CSIC). Lluís Solé Safaris s/n, 08020, Barcelona, Spain
E-mail address of the corresponding author: [email protected]
Abstract
Mediterranean regions are characterised by a stream hydrology with a marked seasonal pattern and high inter-annual variability. Accordingly, soil N processes and leaching of solutes in Mediterranean regions also show a marked seasonality, occurring in pulses as soils re-wet following rain. The Integrated Nitrogen Catchment model (INCA) was applied to Fuirosos, a Mediterranean catchment located in NE Spain, using hydrological data and streamwater nitrate and ammonium concentrations collected from 1999 to 2002. This study tested the model under Mediterranean climate conditions and assessed the effect of the high inter-annual variability on the ability of INCA to simulate discharge and N fluxes. The model was calibrated for the whole three-year period and the n coefficients of determination (r2) between simulated and observed data were 0.54 and 0.1 for discharge and nitrate temporal dynamics, respectively. Ammonium dynamics were simulated poorly and the linear regression between observed and simulated data was not significant statistically. To assess the effect of inter-annual variability on INCA simulations, the calibration process was run separately for two contrasting hydrological years: a dry year with a total rainfall of 525 mm and a wet year with a total of 871 mm. The coefficients of determination for the correlation between observed and simulated discharge for these two periods were 0.67 (p<0.0001) and 0.62 (p<0.0001), respectively. Nitrate temporal dynamics were not simulated as well in the dry year (r2= 0.13 p<0.0001) as in the wet year (r2 = 0.56 p<0.0001). Annual nitrate balances were similar to those estimated from observations. Results suggest that, in Mediterranean catchments, both hydrology and nitrate mobilisation are influenced strongly by soil moisture, which is highly variable within and between years; also, a single parameter set is insufficient to capture the inter-annual variability in Fuirosos. It is suggested that, when using INCA in semiarid systems such as those in Mediterranean regions, certain of the parameters currently fixed in INCA (e.g. base flow index or drainage area) be treated as variables dependent on soil moisture deficit.
Keywords: environmental modelling, intermittent stream, Mediterranean climate, Fuirosos, hydrology, nitrate
Introduction
In recent decades, nitrate export has become a major concern in river systems because of increases in both atmospheric deposition of nitrogen and diffuse transport from agricultural land uses (Vitousek et al. 1979). The Integrated Nitrogen in Catchments model (INCA) (Wade et al., 2002) is one of the first models to simulate the integrated effects of both point and diffuse N sources of streamwater nitrogen and to estimate N loads resulting from microbial processes in the plant/soil system (Whitehead et al., 1998). To develop INCA as a means for improving understanding of the functioning of river systems and as a tool for integrated catchment
730
behaviour. This consists mainly of a long summer dry period that lasts until the first rains in autumn, when the water table recovers, and is followed by a wet period that extends through the autumn and winter months (Butturini et al. 2002; Gallart et al., 2002). Although hydrological stream responses are highly variable, a gradual change from dry to wet periods can be established, from flashy to more damped hydrographs with relevant recession limbs, and from low to high runoff coefficients (Àvila et al., 2002; Butturini et al., 2002; Gallart et al., 2002). Accordingly, Butturini et al. (2002) have suggested the near-stream zone as a key compartment in regulating the hydrological stream response during the transition from the dry to the wet period. Their study, in Fuirosos (Spain) (the catchment studied here), demonstrated that stream runoff and rainfall input were well correlated only after this riparian near-stream compartment was refilled with streamwater. This suggests that, in Mediterranean catchments, the upland and the drainage network may become disconnected for some periods of the year, or even for some years. Another characteristic of Mediterranean zones is the occurrence of intense precipitation events, resulting in overland flow when rainfall exceeds the soil infiltration rate (Castillo et al., 2003) and leads to extreme flood events, with stream discharge rates orders of magnitude higher than baseflow (Butturini et al., 2002).
Regarding inorganic nitrogen, previous studies in arid and semiarid regions have stressed the importance of alternating dry and humid conditions on soil microbial activity. Soil processes occur in pulses stimulated by the re-wetting of soil after rains (Mummey et al., 1994; Terrades, 1996). Moreover, N mineralisation in Mediterranean soils exhibits a marked seasonality, with the highest rates occurring in spring and autumn when temperature is favourable and enough water is available (Read and Mitchell, 1983; Serrasolses et al., 1999). Nitrate leaching is one of the major pathways for N loss in terrestrial ecosystems because nitrate is relatively mobile in soils (Schlesinger, 2001). In Mediterranean catchments, nitrate leaching has also a marked seasonal pattern determined by rainfall and almost coincident with the N mineralisation pattern (Serrasolses et al., 1999). This is consistent with studies on nitrate dynamics during stormflow periods in Mediterranean and semi-arid regions that have described important peaks of nitrate concentrations during the first rains after the drought period (Àvila, 1995; Biron et al., 1999). Nevertheless, the relationship between discharge and nitrate concentration in Mediterranean catchments remains unclear: a study conducted in a sub-humid Mediterramean catchment, Riera Major, concluded that discharge was a key control on nitrogen dynamics (Butturini and Sabater, 2002), while recent work at Fuirosos showed that discharge was not a
good predictor of nitrate concentrations (Bernal et al., 2002). Within this hydrological and biogeochemical framework, the aim of this study was to test the ability of the INCA model (Wade et al., 2002) to simulate streamflow and streamwater nitrate and ammonium dynamics and loads in a Mediterranean catchment and thereby to test whether the model structure was an appropriate representation of the hydrological and nutrient dynamics. The model was applied to the Fuirosos river basin, an almost pristine, undisturbed forested catchment, with little agricultural activity and no urban areas. Therefore, validating the capacity of INCA to simulate discharge and N loads can be accomplished without interference by any significant point or diffuse agricultural N sources. Because stream hydrology at Fuirosos shows a high inter-annual variability, the model calibration may be affected by the period selected. Thus, in addition to the three-year period, the model was calibrated for two three-years with contrasting precipitation regimes. This calibration process is an essential step before the INCA model can be used to investigate climate, deposition or land-use change scenarios in Mediterranean catchments.
Material and methods
STUDY SITE
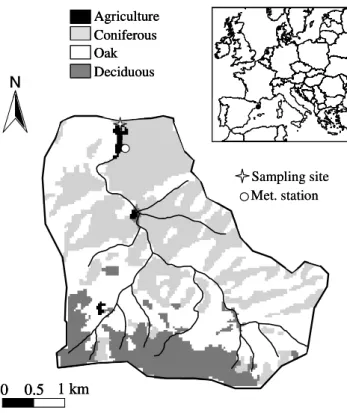
Fuirosos is a third order stream in a forested catchment (10.5 km2) near Barcelona, in north-eastern Spain (latitude
41º 42´N, longitude 2º 34´; altitude range 50770 m a.s.l.) (Fig. 1). The climate is typically Mediterranean, with monthly mean temperatures ranging from 3 ºC in January to 24 ºC in August. Winter air temperatures below 0 ºC are infrequent. Precipitation falls mostly in autumn and spring with only occasional storms in summer and the number of days with rain does not usually exceed 70 per year. Average annual precipitation for this region is 750 mm (Atlas Climàtic de Catalunya, Ninyerola et al., 2000).
0 0.5 1 Kilometers
N
Agriculture Coniferous Oak Deciduous
0 0.5 1 km
Sampling site Met. station
0 0.5 1 Kilometers
N
Agriculture Coniferous Oak Deciduous Agriculture Coniferous Oak Deciduous
0 0.5 1 km 0 0.5 1 km 0 0.5 1 km
Sampling site Met. station Sampling site Met. station
Fig. 1. Map of Fuirosos catchment (10.5 km2) (Catalonia, NE Spain)
showing type of vegetation, land uses and the location of the monitoring site and the meteorological station.
and fine sand (24%), with smaller amounts of silt and clay (15% each, Sala, 1983).
The traditional land uses are the periodic harvesting of bark from the cork trees and the partial clearing of pines and shrubs. Agricultural fields occupy less than 10% of the catchment area.
The stream channel, 3 to 5 m wide, is characterised by a steep-pool morphology with large cobbles and boulders. The stream is flanked by a well developed riparian area 10 to 20 m wide, consisting mainly of alder (Alnus glutinosa) and an exotic species, plane (Platanus acerifolia). The riparian soil is poorly developed and plane leaf litter tends to accumulate on the forest floor because of extremely low decomposition rates (Bernal et al., 2003). The baseflow discharge of the stream is characterised by a long dry period from June to late SeptemberOctober, when the first autumn rainstorms occur. During the wet period, average water discharge ranges from 0.007 m3 s1 in spring to 0.025 m3 s1 in
winter.
HYDROLOGICAL MONITORING, SAMPLING AND WATER ANALYSIS
Stream water level was monitored continuously from 1 July 1998 using a water pressure sensor connected to an
automatic sampler (Sigma 900 Max) (Fig. 1). An empirical relationship between discharge and stream water level was obtained using the slug chloride addition method in the field (Gordon et al., 1992).
Baseflow stream water samples were taken at least once every ten days. To monitor nutrient dynamics during stormflow, the automatic sampler was programmed to start sampling at an increment in the streamwater level of 23 cm. In this way, water samples were taken during the rising and the recession limb of the hydrograph. A daily average of nitrogen concentrations during stormflow conditions was used to compare simulated and measured daily nitrogen concentration. All water samples were filtered through pre-ashed fibreglass filters (WhatmanÒ GF/F) and
cold-stored until analysed. Both nitrate and ammonium were analysed colorimetrically with a Technicon Autoanalyser©
(Technicon, 1976); nitrate with the Griess-Ilosvay method (Keeney and Nelson, 1982) after reduction by percolation on a copperised cadmium column and ammonium after oxidation with salicilate using sodium nitroprusside as a catalyser (Hach, 1992). To compare the estimations of export of inorganic nitrogen derived from the measurements with those derived from INCA N estimations, NO3-N and NH4-N stream fluxes were calculated by multiplying average daily discharges by solute instantaneous concentrations. At basal conditions, daily continuous solute concentration was estimated by linear interpolation of the measured solute concentration.
INCA MODEL DESCRIPTION
On the basis of earlier work by Whitehead et al. (1998), a new version of the process-based INCA model has been developed (Wade et al., 2002; Wade, 2004). This model integrates hydrology, catchment and river N processes, and simulates daily NO3-N and NH4-N concentrations. Sources of nitrogen include atmospheric deposition, terrestrial environment, urban areas and direct discharges. The hydrological model is based on a simple two-compartment system, i.e. the soil zone and the groundwater compartment. Daily stream flow is derived from the output of the two compartments as follows (Whitehead et al., 1998):
Soil zone:
dx1 / dt = (HER x1) /T1 (1)
Groundwater:
dx2 / dt = (BFI x1 x2) /T2 (2)
where x1 and x2 are output flows from the soil and groundwater stores (m3 s1 km-2), T
732
times in days in each compartment, HER is the hydrologically effective rainfall (mm), and BFI is the base flow index, i.e. the proportion of water being transferred from the soil zone to the groundwater zone.
MODEL INPUT DATA
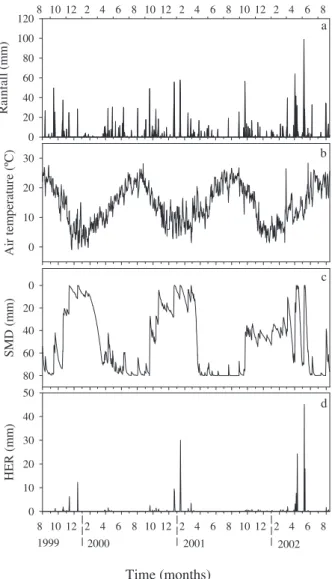
The input data for INCA are daily measurements of precipitation, air temperature, soil moisture deficit and hydrologically effective rainfall (Fig. 2).
Precipitation and air temperature
Precipitation and air temperatures were recorded continuously at 15-min intervals at a meteorological station commissioned in April 1999 at the study site. Previous precipitation data were provided by the Catalan Meteorological service (SMC) for a meteorological station located 5 km away. On-site daily meteorological measurements facilitated estimation of daily potential evapotranspiration (PET, mm) using the Penman-Monteith equation (Campbell and Norman, 1998).
Soil moisture deficit (SMD)
Daily soil moisture deficit (SMD, mm) was estimated for the xth day as:
SMDx = SMDx-1 (Px Ix)+ AETx if SMDx-1 >
(Px - Ix) AETx (3)
SMDx = 0 if SMDx-1 < (Px Ix) AETx (4)
where, P is the observed daily rainfall (mm), AET is the estimated actual evapotranspiration (mm) and I is the rainfall interception by tree canopies (mm).
Based on previous studies in Mediterranean catchments, rainfall interception by tree canopies at event scale was assumed to be 15% of the total bulk precipitation, except for events occurring during very dry atmospheric conditions when rainfall interception can be up to 49% of the total bulk precipitation (Llorens et al., 1997).
Actual evapotranspiration (AET)
Regarding tree transpiration (T), previous work showed a strong dependency of transpiration on PET when soil water was not limiting (Levitt et al., 1995). Several studies have reported a ratio T/PET ranging from 0.7 to 0.8 (Bréda et al., 1993). In the present work a value of 0.8 has been used. Further, Mediterranean vegetation can limit transpiration when soil becomes dry by mechanisms related to stomatal closure (Terrades, 2001). Bréda and Granier (1996) showed that under conditions of water stress, the ratio T/PET decreases linearly as soon as extractable water falls below
8 10 12 2 4 6 8 10 12 2 4 6 8 10 12 2 4 6 8
R
ain
fall
(m
m
)
0 20 40 60 80 100 120
S
M
D
(
mm)
0
20 40
60
80
Time (months)
8 10 12 2 4 6 8 10 12 2 4 6 8 10 12 2 4 6 8
H
E
R
(
mm)
0 10 20 30 40 50
Ai
r tem
p
erat
ure (º
C
)
0 10 20 30
1999 2000 2001 2002
a
b
c
d
Fig. 2. Bulk precipitation, air temperature, soil moisture deficit (SMD) and hydrologically effective rainfall (HER) at Fuirosos for the period 19992002.
a threshold, when regulation of transpiration occurs because of stomatal closure. This critical value was around 0.4 and was found to be constant for both coniferous and broad-leaved species, regardless of the technique used to estimate transpiration (Granier et al., 1999). Thus, actual evapo-transpiration for the xth day was estimated here as follows:
AET x = kc PETx if SMDx-1 < SMDTHR (5)
AET x = kc PETx (SMDx-1 SMDMAX) / (SMDTHR SMDMAX) if SMDx-1 >SMDTHR (6)
733 deficit and SMDTHR is the value of SMD at which
transpiration begins to decrease due to water stress.
Hydrologically effective rainfall (HER)
In the INCA model, Hydrologically Effective Rainfall (HER) is used to drive the water flow and N fluxes through the catchment system. Generally, HER for the xth day is
calculated as follows,
HERx = (Px-Ix) - SMDx-1 AETx if Px-Ix > SMDx-1
+ AETx (7)
HERx = 0 if Px-Ix < SMDx-1 + AETx (8)
where P is observed daily rainfall (mm), I is rainfall interception (mm), AET is estimated actual evapo-transpiration (mm) and SMD is estimated soil moisture deficit (mm). Unfortunately, no standard method for the calculation of HER is yet available for Mediterranean regions and, thus, some additional points based on field observation are considered here. For instance, in Fuirosos small to medium peak discharges occur even when most of the soil moisture in the catchment is below field capacity, because some zones in the valley bottom and near the stream channel may be water-saturated. Those episodes imply the leaching of soluble compounds and, although they may be negligible in terms of annual N fluxes, they may be relevant in terms of temporal dynamics. In Fuirosos, this riparian zone has been estimated to be 0.7% of the total catchment area and, in this study, it has been considered that the net precipitation falling on that area reaches the stream channel, except during the driest moments.
Land use and N deposition
Land use data were derived from the 1998 digital land use / land cover map of Catalonia, a raster dataset with 30 m cell size derived from Landsat TM satellite imagery (Fig. 1).
Recently, Rodà et al. (2002) have estimated the atmospheric N deposition in a forest situated in Montseny Mountains, less than 30 km from Fuirosos. The wet deposition of inorganic N for this region was 5.7 kg N ha1
yr1, 52% as ammonium and 48% as nitrate. The dry
deposition of inorganic N was 9.2 kg N ha1 yr1, 55% as
nitrate and the remaining 45% as ammonium (Rodà et al., 2002).
Parameterisation
The plant growth period was set to 190 days and plant uptake was adjusted to give the N demand estimated for other Mediterranean oak forests (Bonilla and Rodà, 1992).
In INCA, the following velocityflow relationship is used
to estimate residence times of water (Wade et al., 2002):
V = a Q b (9)
where V and Q are mean daily velocity and flow respectively, and a and b are constants. In Fuirosos, this relationship has been estimated empirically by tracer additions: a=0.867 and b=0.630 (r2 = 0.94, d.f. =16, p<0.0001).
Parameters such as the base flow index or time constants for the soil reactive zone and the groundwater zone were adjusted against the peaks of the hydrograph. Parameters related to soil N processes were adjusted to obtain: (i) simulated streamwater nitrate concentrations similar to those measured in the field, and (ii) simulated nitrogen annual rates similar to those reported in the literature.
Calibration of the INCA model for different hydrological periods
Climatic data were available for the period 19992002. These three hydrological years were characterised by a large variability in river flow and climatic conditions. A hydrological year was defined from the recovery of stream water with the first autumn rains until the stream bed dried out in early summer. During the first hydrological year 19992000, rainfall input was low (525 mm) and there was a prolonged drought in the summer, with the stream bed dry for 75 days. The total runoff for this period was 38.4 mm, less than 8% of the total rainfall. During the second hydrological year (20002001), total precipitation (P) was 753 mm, of which 35% was due to two single events: December 2000 (P = 128 mm, Qpeak = 829 L s1) and January
2001 (P = 132 mm, Qpeak = 26000 L s1). Annual runoff was
14% of total rainfall, with 71% of it due to the storm in January 2001. During this year the stream was dry for 72 days. The third period (20012002) was by far the wettest with a total precipitation of 871 mm. Annual runoff accounted for 26% of total rainfall and the stream did not dry out in the summer. In May 2002, an extreme flood event (P = 150 mm, Qpeak = 28000 L s1) was responsible for 40%
of the annual runoff. The events occurring in January 2001 and May 2002 were so severe that the field equipment was swept away by the flood waters, which implies a high uncertainty in the estimation of discharge. For this reason, these two extreme events were not considered when comparing simulated and observed data.
and one for wet years, improve model fit substantially. Unfortunately, with only three years of data it is not possible to perform an appropriate two-step calibration process, i.e. to divide the data into two parts and then adjust the parameters of the model with one part and test with the other (Oreskes et al., 1994). In the present study, the testing process refers to the runs made with INCA for each of the three hydrological years after calibrating the model separately for the dry year and the wet year. This was used as an indicator of how useful those two parameter sets could be for simulating different hydrological periods.
To test INCA, the goodness of fit was measured by the coefficient of determination (r2) and by the slope of the
linear regression between simulated and observed data series. Also, differences between water outputs and N loads estimated from observed and simulated data were quantified.
Results
CALIBRATION OF THE HYDROLOGICAL COMPONENT OF THE INCA MODEL
Observed mean daily stream flow at Fuirosos from 1999 to 2002 and the corresponding simulated mean daily stream flow are shown in Fig. 3a. In general, INCA reproduced the temporal pattern of flow to some extent (r2 = 0.54,
p<0.0001). Nevertheless, when calibration was made for a single hydrological year, the simulated data reproduced the observations for that year. Figure 3b and 3c show that the timing of peak flows was well simulated, though the absolute magnitude was not always matched. In the dry year (19992000), the drought period (June to September) was not simulated well (Fig. 3b). In the wet year (2001 2002), the wetter months (December to June) were well simulated, although discharge was clearly over-estimated during the transitions from dry to wet and from wet to dry conditions (Fig. 3c). In both simulations, the coefficient of
Time (months)
9 10 11 12 1 2 3 4 5 6 7 8
Q (
m
3 s -1 )
0.01 0.1 1 10
10 11 12 1 2 3 4 5 6 7 8 9
Q (
m
3 s
-1 )
0.00 0.05 0.10 0.15
b 10 12 2 4 6 8 10 12 2 4 6 8 10 12 2 4 6 8
Q (
m
3 s -1)
0.01 0.1 1
10 a
1999 2000 2001 2002
1999 2000
c
2001 2002
Table 1. Water fluxes (mm) and N loads (kg N km2 yr1) for each hydrological period at Fuirosos (Catalonia, Spain) calculated from
observed values and INCA simulated values. DRY set, simulated values using the calibration of the hydrological period 19992000 (dry year); WET set, simulated values using the calibration of the hydrological period 20012002 (wet year). In brackets, percentage of error for the simulated values in relation to observed values. * The two most severe floods (January 2001 and May 2002) have not been considered when estimating annual discharge and nitrate loads.
Water flux (mm) NO3-N (kg N km-2 yr-1) *
Hydrological period Observed DRY set WET set Observed DRY set WET set
19992000 (dry) 40.4 41.8 (+ 3.5%) 58.4 (+ 44.5%) 10.5 13.3 (+ 26%) 71.5 (> + 100%)
20002001 55.7 73.8 (+ 32.4%) 68.0 (+ 22%) 33.3 25.4 (- 24%) 131.6 (> + 100%)
2001-2002 (wet) 93.3 101.6 (+ 8.8%) 91.8 (+ 1.6%) 86.55 31 (- 64%) 86.3 (< - 1%)
Fig. 3. INCA outputs and mean daily discharge (m3 s1): (a) for the
three-year run (19992002), (b) for the period 19992000 (dry year), and (c) for the period 20012002 (wet year). The area filled in grey represents the simulated discharge in (a), (b) and (c), respectively. The area filled with coarse lines represents the observed streamwater discharge in (a), (b) and (c), respectively. Note that the discharge axis in (a) and (c) is logarithmic.
determination (r2) was above 0.6 and the slope between
sets were related to the water residence time in the soil and
groundwater compartments and to the baseflow index (Table 2).
N DYNAMICS AND N LOAD IN THE STREAM
In general, the observed baseflow nitrate concentrations in Fuirosos in late autumn and winter ranged between 0.15 and 0.8 mg N L1, and between 0.01 and 0.46 mg N L1 in
spring and summer. However, no clear annual pattern was observed in the driest year (19992000) when basal nitrate concentrations were always lower than 0.5 mg N L1. During
stormflow, nitrate increased by 1.3 to 9 times the baseflow concentration, though the observed concentrations were not explained by variations in discharge (r2=0.04, p<0.0001).
During the most extreme events, the nitrate concentration fell, which may be due to a dilution effect because of the high amount of water flowing in those episodes.
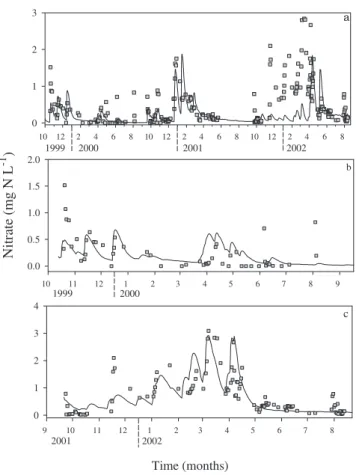
Figure 5a shows the temporal dynamics of simulated and observed values of daily nitrate concentrations for the period 19992002. The INCA model was unable to match the
seasonal pattern for the entire period (19992002): baseflow nitrate concentrations were well simulated from October 1999 to June 2001, while during the hydrological cycle 20012002 the observed seasonal pattern could not be simulated. The coefficient of determination for the correlation between observed and the simulated data for this simulation was low (r2 = 0.11, p<0.0001). In general, peak
concentrations were under-estimated during the wetting-up period (Fig. 5a). After separate calibrations for the dry and wet year, INCA reproduced the seasonal pattern of stream nitrate concentrations successfully, although nitrate concentrations during peak discharges were not always matched (Fig. 5b and c) and the coefficient of determination (r2) was still poor for the dry period 19992000 (Fig. 4g).
During the wet year, simulated and observed nitrate concentrations fitted better (Fig. 4l). Annual nitrate loads were overestimated during the dry year, while during the wet year simulated and observed nitrate loads were similar (Table 1).
In Fuirosos, the observed baseflow ammonium concentrations ranged between 0.01 and 0.1 mg N L1 and
Period 2000-2001
Period 1999-2000
(dry)
Period 2001-2002
(wet)
OBSERVED
SI
MU
L
A
T
E
D
Dry set Wet set
0.00 0.06 0.12 0.00
0.06 0.12r
2
= 0.67 a = 0.87
0.00 0.06 0.12
r2= 0.41 a = 1.33
0 1 2
0 1 2
0.0 0.5 1.0 0.0
0.5 1.0r
2
= 0.74 a = 2.38
0.0 0.5 1.0 0.0
0.5 1.0r
2
= 0.43 a = 0.49
DISCHARGE (m3 s-1)
a b
c
e
0.0 0.5 1.0
r2= 0.65 a = 1.46
d
0.0 0.5 1.0
r2= 0.62 a = 0.89
f
0.0 1.5 3.0 0.0
1.5 3.0
Dry set Wet set
r2= 0.13 a = 0.23
0.0 2.5 5.0 0.0
2.5 5.0r
2
= 0.47 a = 1.5
0 1 2
0 1 2r
2
= 0.55 a = 0.27
0.0 2.5 5.0 0.0
2.5 5.0r
2
= 0.29 a = 0.16
0.0 1.5 3.0 0.0
1.5 3.0 r
2
= 0.56 a = 0.92 NITRATE (mg N L-1)
g h
i j
k l
n.s.
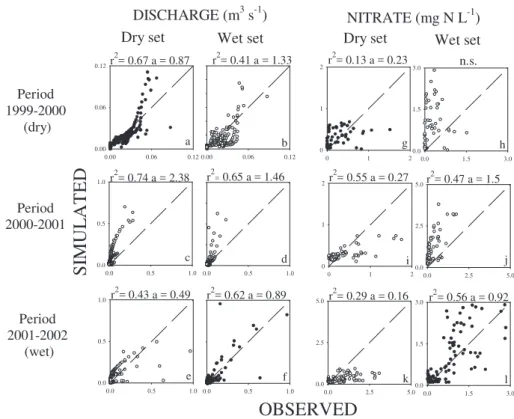
Fig. 4. Relationship between observed and INCA simulated discharge (m3 s-1) for the 3 hydrological periods (19992000, 20002001 and
20012002) using: (a), (c) and (e) the dry parameter set, and (b), (d) and (f) the wet parameter set, for each period respectively. Relationship between measured and INCA simulated nitrate concentrations (mg N L-1) for the 3 hydrological periods (19992000, 20002001 and 2001
2002) using: (g), (i) and (k) the dry parameter set, and (h), (j) and (l) the wet parameter set, for each period respectively. Note that (a), (f), (g) and (l) correspond to the model runs after the adjusting process (black circles) and (b), (c), (d), (e), (h), (i), (j) and (k) correspond to the runs of the testing process (white circles). In all cases, the dashed line is the 1:1 relationship; r2 is the coefficient of determination of the correlation
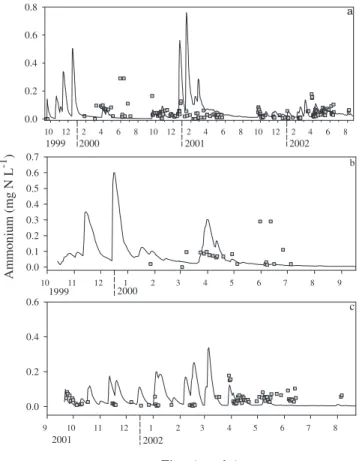
showed no clear seasonal pattern (Fig. 6a). During stormflow, ammonium concentration increased by 1.3 to 4 times in some cases, while in other cases the concentration decreased by up to 10 times. The observed ammonium concentrations were not related to discharge (r2 = 0.1,
p<0.0001). In contrast, simulated ammonium concentrations tended to peak with discharge (Fig. 6a, b and c). The coefficient of determination (r2) between the observed and
simulated ammonium concentrations was neither significant when the whole study period (19992002) was used for the calibration nor when the calibration was made separately for the dry and wet periods. Because of the poor fit between the observed and simulated ammonium concentrations, this
solute was not considered for testing the model.
After calibration for both wet and dry periods, the values of the parameters related to soil N processes were generally higher for the wet than for the dry year (Table 2). The soil water residence time and the Vr (soil retention volume) appeared to be key parameters in the simulation of nitrogen streamwater concentrations.
The annual rates of net mineralisation and nitrate uptake by vegetation estimated by INCA were in the range of values reported for Mediterranean oak forests. In contrast, ammonium uptake by vegetation was below the values found in the literature (Table 3).
TESTING INCA CALIBRATIONS
The testing process consisted of running the model for each of the three available hydrological years, with each of the two sets of parameters obtained after calibrating the model for the wet and dry year separately. For 20002001, the
Table 2. Parameters of the INCA model used for modelling the
hydrological period 19992000 (dry year) and 20012002 (wet year) at the Fuirosos catchment.
19992000 20012002
Soil N processes
Denitrification m day-1 0 0.002
Nitrogen fixation (kg N ha-1 day 1) 0 0
Nitrification m day-1 0.015 0.04
Mineralisation (kg N ha-1 day1) 0.3 0.5
Immobilisation m day-1 0.005 0.01
Max soil moisture deficit (mm) 80 80
Max temperature difference (ºC) 7 7
Stop denitrification at (ºC) 0 0
Stop nitrification at (ºC) 0 0
Plant growth start day 90 90
Plant growth period (days) 190 190
Nitrate uptake rate m day-1 0.045 0.08
Ammonium uptake rate m day-1 0.65 1
Maximum uptake rate kg N ha-1 yr -1 90 90
Hydrological values
Sustain Surface flow (m3 s-1) 0 0.0005
Sustain Sub-surface flow (m3 s-1) 0 0
Vr max (depth x porosity) 1.5 0.55
Soil water residence time (days) 4 2.5
Groundwater water residence time (days) 60 150
Base flow index 0.65 0.35
Initial values
Initial surface flow (m3 s-1) 0 0
Initial surface nitrate (mg l-1) 0.6 0.6
Initial surface ammonium (mg l-1) 0.1 0.1
Initial surface Drainage volume (m3) 1000 1000
Initial sub-surface flow (m3 s-1) 0 0
Initial sub-surface nitrate (mg l-1) 0.1 0.1
Initial sub-surface ammonium (mg l-1) 0.06 0.06
Initial sub-surface Drainage volume (m3) 105 105
Instream processes
Instream Denitrification rate (day-1) 0.2 0.15
Instream Nitrification rate (day-1) 0.3 0.3
Fig. 5. INCA outputs and measured nitrate concentrations (mg N L1): (a) for the three-year run (19992002), (b) for the period
19992000 (dry year), and (c) for the period 20012002 (wet year). The solid lines represent the simulated nitrate concentrations in (a), (b) and (c), respectively. The square symbols represent the measured streamwater nitrate concentrations in (a), (b) and (c), respectively.
Time (months)
a
1999 2000 2001 2002
10 12 2 4 6 8 10 12 2 4 6 8 10 12 2 4 6 8 0
1 2 3
10 11 12 1 2 3 4 5 6 7 8 9
Ni
tr
ate (
m
g
N
L
-1 )
0.0 0.5 1.0 1.5 2.0
b
1999 2000
9 10 11 12 1 2 3 4 5 6 7 8 0
1 2 3 4
c
737
Time (months)
a
1999 2000 2001 2002
b
1999 2000
c
2001 2002
10 12 2 4 6 8 10 12 2 4 6 8 10 12 2 4 6 8 0.0
0.2 0.4 0.6 0.8
10 11 12 1 2 3 4 5 6 7 8 9
Ammon
ium (mg N
L
-1 )
0.0 0.1 0.2 0.3 0.4 0.5 0.6 0.7
9 10 11 12 1 2 3 4 5 6 7 8 0.0
0.2 0.4 0.6
Table 3. Nitrogen annual process rates: a comparison of values from previous studies in forests of Quercus ilex
in Catalonia (Spain) with simulated values for the periods 19992000 (dry year) and 2001-2002 (wet year).
N process Measured values(kg N ha-1 yr-1) Simulated values(kg N ha-1 yr-1)
DRY year WET year
Net mineralisation 32.4a - 80.1b 36.7 62.8
Net nitrification 4.4a - 7.5b 11.4 34.3
Immobilisation 0.08c 5.7 8.6
Nitrate uptake by vegetation 10.3c 58d 10.7 33.5
Ammonium uptake by vegetation 53d - 80.5c 30 33.6
References: a Serrasolses
et al. (1999), b Bonilla and Rodà (1992), c Bonilla (1990), d Escarré
et al. (1987).
Fig. 6. INCA outputs and measured ammonium concentrations (mg N L1): (a) for the three-year run (19992002), (b) for the period
19992000 (dry year), and (c) for the period 20012002 (wet year). The solid lines represent the simulated ammonium concentrations in (a), (b) and (c), respectively. The square symbols represent the measured streamwater ammonium concentrations in (a), (b) and (c), respectively.
therefore, annual discharges were over-estimated (Table 1). For the same period, the coefficient of determination (r2) for
nitrate was moderately good using either the dry or the wet parameter set (Fig. 4i and j), indicating that the concentration dynamics were captured by the model. However, nitrate concentrations were underestimated with the dry set (Fig. 4i), while they were overestimated with the wet parameter set (Fig. 4j). Also, nitrate concentrations during 19992000 were highly overestimated when using the parameter set obtained from the wet year (Fig. 4h).
Discussion
In general, adequate field measurements of hydrological and soil processes are difficult because these mechanisms are highly variable in space and time. Usually, the scale at which these processes are measured in the field is smaller than that of the model elements (Oreskes et al., 1994). In consequence, many of the parameters required by any given model cannot be fixed prior to the calibration process and are adjusted to achieve an acceptable fit. Commonly, there are multiple acceptable parameterisations and qualitative information may be used to constrain model uncertainties (Franks et al., 1998). Although the parameter sets obtained in the present study are not the only acceptable ones, the results obtained are adequate to allow discussion of the merits of the INCA model structure as a representation of the hydrological and nutrient dynamics in Mediterranean catchments.
HYDROLOGICAL PROCESSES
Annual water yield in Fuirosos during the period 19992002 varied from 8% to 26% of total annual precipitation. However, if the two most severe storm events (P > 100 mm, January 2001 and May 2002) are excluded, the estimated annual discharges were 7.9%, 7.5% and 10.5% of the total annual precipitation, for the three consecutive years. Thus, coefficient of determination (r2) between observed and
evapotranspiration is the key factor controlling annual water budgets in this catchment and changes in the water yield are related more to the distribution of rainfall throughout the year than to the annual volumes. Other studies in Mediterranean and semi-arid catchments have also described a high variability in the amount of discharge from year to year and have reported similar ranges for annual yields (e.g. Piñol et al., 1991; Ceballos and Schnabel, 1998). In contrast, in humid regions, variations in annual water yields are more damped and the annual discharge is a higher fraction of total bulk rainfall (Wade et al., 2002; Hudson, 1988). Indeed, the records at Fuirosos account for a wide range of climatic and stream hydrological conditions, although the monitoring period is still not very long. This circumstance has allowed testing of the models ability to simulate highly contrasting hydrological conditions.
In general, INCA matched the general flow dynamics well and the coefficient of determination was above 0.54 in all cases. The timing of the storm events was well simulated, though the actual value of peak flows was not always captured. Nevertheless, INCA had difficulties simulating the most complex episodes of the Mediterranean hydrology, i.e. the wetting-up period, the transition from wet to dry conditions and the extreme floods. INCA splits the volume of water stored in the soil and in the groundwater by means of the baseflow index. This index is based on observed river flows in the UK and purports to attribute the proportions of water in a stream derived from surface and deeper groundwater sources (Wade et al., 2002). So far, the baseflow index in INCA is a fixed value within and between years. There might be two underlying assumptions: (i) that the whole drainage area is contributing to the catchment runoff and, (ii) that the relative contribution of the two runoff mechanisms considered (i.e. saturation excess surface flow and groundwater flow) is constant over time. This approximation to catchment hydrology is not appropriate in Mediterranean catchments. Regarding the area contributing to the generation of runoff, Butturini et al. (2002) showed that, in Fuirosos, the streamriparian system was totally or partially disconnected from the rest of the catchment during the drought and the wetting-up period. Moreover, Gallart et al. (1997) showed that in Vallcebre catchments (Catalonia, Spain) groundwater transfer, which frequently feeds saturated areas, was interrupted during dry periods (early autumn and late spring) and that the timing of the drought and wetting-up period showed a high inter-annual variability. Both studies suggest a common idea, i.e. that, in Mediterranean catchments, the area contributing to runoff generation contracts and expands within a year and between years. There have been attempts to reproduce the hydrological response of semi-arid catchments during the
wetting-up period by using TOPMODEL, a hydrological model widely used in temperate catchments that is based on topographic indices of hydrological similarity (e.g. Ambroise et al., 1996). Piñol et al. (1997) showed that simulated stream flow in Mediterranean catchments improved significantly provided both an extra runoff generation process, i.e. from unsaturated areas to the stream (lateral unsaturated flow), as well as a variable effective upslope drainage area that was a function of soil saturation deficit. Recently, Castillo et al. (2003) reported a simulation approach showing that in Mediterranean semi-arid catchments the hydrological response after high intensity storms (P > 50 mm h1) is independent of the initial soil
739
N EXPORT, SOIL N PROCESSES AND N DYNAMICS IN STREAMWATER
The export of nutrients in catchments is linked strongly to hydrological processes. Particularly, soil studies in semi-arid regions often conclude that leaching and mobilisation of nutrients in these regions are closely linked to precipitation events (e.g. Mummey et al., 1994; Terrades, 1996). In Fuirosos, the observed leaching of ammonium was not related to precipitation events, while a recent study has reported that nitrate export during wet years was from 1.5 to 4 times higher than that during dry years (Bernal et al., 2002). Differences between years were due mainly to large rain episodes that strongly influenced the flush of solutes. To account for the influence of precipitation events on nutrient leaching, monitoring in Fuirosos has been intense during stormflow, which is essential to test the models ability to simulate nitrogen dynamics.
Water has not only a flushing effect but also an impact on soil microbial processes owing to an increase in soil moisture. In semi-arid regions, microbial soil processes, for instance denitrification, occur in pulses stimulated by the re-wetting of soil after rains (Mummey et al., 1994). Accordingly, soil N process rates in INCA were higher during the wet year than the dry year. Yet, previous studies in Mediterranean oak forests have shown that nitrification is limited by soil moisture (Serrasolses et al., 1999) and that the ratio between mineralisation and nitrification is roughly 10:1 (Table 3). This may well be the reason why nitrogen uptake by vegetation is mainly in the form of ammonium (Serrasolses et al., 1999). However, in the present INCA simulations, annual nitrification rates were only two to three times lower than mineralisation rates, reflecting the fact that the model structure does not include a soil moisture threshold for nitrification.
In general, INCA simulations of flow and concentration led to annual nitrate loads roughly similar to observed values. However, even in the best cases, the model captured less than 56% of the variance in daily nitrate concentrations. During the wetting-up period and the transition from wet to dry conditions, nitrate peaks during stormflow were usually underestimated. Yet, at those moments, the release of nutrients stored in the unsaturated riparian soil layers might be provoked by stream reverse fluxes (Butturini et al., 2003). Reverse fluxes are characteristic of arid and semiarid areas and this hydrological process may not be general enough to be included in a wide scope model such as INCA. However, there might be other hydrological mechanisms following storm events such as shallow subsurface flow generated in the vadose zone (or lateral unsaturated flow) that also occur in temperate catchments, which allow for flushing of soil nutrients from the near-surface zones (Stieglitz et al., 2003).
In Fuirosos, nitrate concentration dynamics showed strong inter-annual variation. During 20002001 and 20012002, baseflow nitrate concentrations were higher during the non-vegetative than the non-vegetative period; this trend was not observed in the driest year, due possibly to a non-mobilisation of nutrients or to a longer vegetative period. In any case, results showed that further work is needed if INCA is to capture all the observed inter-annual variability in nitrate dynamics. When the calibration was made for the dry and the wet year separately, INCA was more able to capture the seasonal pattern in both cases (especially in the wet year), though the coefficient of determination for the dry year was still very low. Differences between both parameter sets were in INCA parameters that had a major influence on nitrate dynamics, in particular the soil water residence time and the soil retention volume (Vr), which is related to the mobilisation of solutes in the soil. This indicates that nitrate mobilisation in Mediterranean catchments is highly variable from year to year depending on the rainfall regime and the soil moisture conditions. Thus, high nitrate concentrations during stormflow in the wet year (20012002) might respond to an intense mobilisation of nutrients (perhaps from soil areas which, during drier years, may even be isolated), which might well be accompanied by higher soil nitrification rates.
In Fuirosos, ammonium concentrations were low even during precipitation events; INCA simulated ammonium leaching during stormflow. Further work is needed if INCA is to simulate the observed concentration dynamics of ammonium. Rapid ammonium uptake by vegetation together with non-biological uptake may explain the observed low ammonium mobilisation. Non-biological uptake should be taken into account for an appropriate simulation of ammonium dynamics and the incorporation of ammonium adsorption into INCA is strongly recommended.
Concluding remarks
set for several years fails to capture the intrinsic inter-annual variability of Mediterranean regions. However, really to test whether two or more parameter sets for contrasting hydrological conditions could be used to apply INCA in semi-arid catchments, long data series (at least 10 years), including several dry and wet years, would be needed.
The implementation of a variable effective drainage area and a lateral unsaturated flow may improve INCA´s ability to simulate flow and nitrogen dynamics in semi-arid catchments. It is also suggested that infiltration excess overland flow mechanisms are incorporated into the INCA model structure, because in semi-arid regions extreme storm events are responsible for the major part of water and nutrients annual export. Nevertheless, it has been shown that adding model components and parameters to reproduce specific aspects of catchment behaviour does not necessarily lead to better results or to easier parameter calibration (Hornberger et al., 1985).
Catchment size may also be important. Several authors have suggested that the effect of the heterogeneity of soil characteristics and water flowpaths on water quality is more apparent in small catchments (<50 km2) than in larger ones
(e.g. Wade et al., 2001). Consequently, the detailed descriptions of hydrological and soil processes needed when modelling small catchments may shift to dominant or key processes that control water quality at larger scales (Sivapalan et al., 2003). Applying INCA to larger Mediterranean catchments than Fuirosos, preferably with permanent flows, may give fresh insights into the usefulness of INCA for semi-arid systems.
INCA has shown widely its ability to simulate discharge and nitrate dynamics in humid catchments (see this HESS special volume). However, further work is needed before INCA becomes a suitable management tool for semi-arid catchments. Also, present results call for caution when running climatic scenarios, including drier conditions and more irregularly distributed rainfall patterns, in any catchment.
Acknowledgements
The authors thank P. Llorens, C. Gracia and INCA project partners for their constructive comments. Suggestions from three anonymous referees are also greatly appreciated. This study was supported by funds provided by the European Community (INCA project EVK1-1999-00011) and by the Comisión Interministerial de Ciencia y Tecnología (CICYT, reference # REN 01-3327).
References
Ambroise, B., Beven, K. and Freer, J., 1996. Towards a generalisation of the TOPMODEL concepts: topographic indices of hydrological similarity. Water Resour. Res., 32, 21352145.
Àvila, A., Bonilla, D., Rodà, F., Piñol, J. and Neal, C., 1995. Soilwater chemistry in a holm oak (Quercus ilex) forest:
inferences on biogeochemical processes for a montane Mediterranean area. J. Hydrol., 166, 1535.
Àvila, A., Rodrigo, A. and Rodà, F., 2002. Nitrogen circulation on a Mediterranean holm oak forest, La Castanya, Montseny, norheastern Spain. Hydrol. Earth Syst. Sci.,6, 551557.
Bernal, S., Butturini, A. and Sabater, F., 2002. Variability of DOC and nitrate responses to storms in a small Mediterranean forested catchment. Hydrol. Earth Syst. Sci., 6, 10311041.
Bernal, S., Butturini, A., Nin, E., Sabater, F. and Sabater, S., 2003. Leaf litter dynamics and nitrous oxide emission in a Mediterranean riparian forest: implications for soil nitrogen dynamics. J.Environ. Qual., 32, 191197.
Biron, P.M., Roy, A.G., Courschesne, F., Hendershot, W.H., Coté, B. and Fyles, J., 1999. The effect of antecedent moisture conditions on the relationship of hydrology to hydrochemistry in a small forested watershed. Hydrol. Process., 13, 15411555.
Bonilla, D., 1990. Biogeoquímica del suelo en un encinar y landas del Montseny: la solución del suelo, la dinámica del nitrógeno y la respuesta a una perturbación experimental.
Ph.D.Dissertation. Autonomous University of Barcelona, Bellaterra, Spain.
Bonilla, D. and Rodà, F., 1989. Dinámica del nitrógeno en el suelo de un encinar montano: respuesta a una perturbación experimental. Options Mediterraneennes-serie seminaries, 3,
187190.
Bonilla, D. and Rodà, F., 1992. Soil nitrogen dynamics in a holm oak forest. Vegetatio, 99/100, 247257.
Bréda, N. and Granier, A., 1996. Intra- and inter-annual variation of transpiration, leaf area index and radial growth of a sessile oak stand (Quercus petraea). Ann. Sci. Forest., 53, 521-536.
Bréda, N., Cochard, H., Dreyer, E. and Granier, A., 1993. Seasonal evolution of water transfer in a mature oak stand (Quercus
petraea Matt. Liebl.) submitted to drought. Can. J. Forest. Res.,
23, 11361143.
Butturini, A. and Sabater, F., 2002. Nitrogen concentrations in a small Mediterranean stream: I. Nitrate. II. Ammonium. Hydrol.
Earth Syst. Sci.,6, 539550.
Butturini, A., Bernal, S., Sabater, S. and Sabater, F., 2002. The influence of riparian-hyporheic zone on the hydrological responses in an intermittent stream. Hydrol. Earth Syst. Sci.,6,
515525.
Buttirini, A., Bernal, S., Nin, E., Hellín, C., Rivero, L., Sabater, S. and Sabater, F., 2003. Influences of the stream groundwater hydrology on nitrate concentration in unsaturated riparian area bounded by an intermittent Mediterranean stream. Water Resour. Res., 39, SBH 12.
Campbell, G.S. and Norman, J.M., 1998. An introduction to
environmental biophysics. 2nd ed. Springer, NY, Inc. USA.
281pp.
Castillo, V.M., Gómez-Plaza, A. and Martínez-Mena, M., 2003. The role of antecedent soil water content in the runoff response of semiarid catchments: a simulation approach. J. Hydrol., 284,
114130.
Escarré, A., Ferrés, L., López, R., Martín, J., Rodà, F. and Terrades, J. 1987. Nutrient use strategy by evergreen oak (Quercus ilex ssp. ilex) in NE Spain. In: Plant responses to stress, J.D.
Tenhunen et al. (Eds.), NATO ASI series, Springer, Berlin,
Germany. 429-435.
Franks, S.W., Gineste, P., Beven, K. and Merot, P., 1998. On constraining the predictions of a distributed model: the incorporation of fuzzy estimates of saturated areas into the calibration process. Water Resour. Res., 34, 787797.
Gallart, F., Latron, J., Llorens, P. and Rabadà, D., 1997. Hydrological functioning of Mediterranean mountain basins in Vallcebre, Catalonia: some challenges for hydrological modelling. Hydrol. Process.,11, 12631272.
Gallart, F., Llorens, P., Latron, J. and Regüés, D., 2002. Hydrological processes and their seasonal controls in a small
Mediterranean catchment in the Pyrenees. Hydrol. Earth Syst.
Sci., 6, 527537.
Gordon, N.D., McMahon, T.A. and Finlayson, B.L., 1992. Stream
hydrology. An introduction for ecologist. Prentice Hall, New
Jersey, USA.
Granier, A., Bréda, N., Biron, P. and Villete, S., 1999. A lumped water balance model to evaluate duration and intensity of drought constrains in forest stands. Ecol. Model., 116, 269
283.
Hach Water Analysis Handbook (2nd edition), 1992. Hach
Company: Loveland, Co.
Hornberger, G.M., Beven, K.J., Cosby, B.J. and Sappintong, D.E., 1985. Shenandoah watershed study: calibration of a topography based variable contributing area model to a small forested catchment. Water Resour. Res., 21, 18411850.
Hudson, J.A., 1988. The contribution of soil moisture storage to the water balances of upland forested and grassland catchments.
Hydrolog. Sci. J., 33, 289309.
Keeney, D.R. and Nelson, D.W., 1982. Nitrogen Inorganic Forms.
In: Methods of Soil Analysis, part 2. Chemical and
Microbiological properties, A.L. Page (Ed.) Agronomy
Monographs #9, AA-SSSA Publisher, USA. 643698. Levitt, D.G., Simpson, J.R. and Tipton, J.L., 1995. Water use of
two landscape tree species in Tucson, Arizona. J. Amer. Soc.
Hortic. Sci., 120, 409416.
Llorens, P., Poch, R., Latron, J. and Gallart, F., 1997. Rainfall interception by a Pinus sylvestris forest path overgrown in a
Mediterranean mountainous abandoned area I. Monitoring design and results to the event scale. J. Hydrol., 199, 331345.
Mummey, D.L., Smith, J.L. and Bolton, H.J., 1994. Nitrous oxide flux from a shrub-steppe ecosystem: sources and regulation.
Soil Biol. Biochem., 26, 279286.
Ninyerola, M., Pons, X. and Roure, J.M., 2000. A methodological approach of climatological modelling of air temperature and precipitation through GIS techniques. Int. J. Climate., 20, 1823
1841.
Oreskes, N., Shrader-Frechette, K. and Belitz, K. 1994. Verification, validation, and confirmation of numerical models in the earth sciences. Science, 263, 641646.
Piñol, J., Lledó, M.J. and Escarré, A., 1991. Hydrological balance of two Mediterranean forested catchments (Prades, northeast Spain). Hydrolog. Sci. J., 36, 95107.
Piñol, J., Beven, K. and Freer, J., 1997. Modelling the hydrological responses of Mediterranean catchments, Prades, Catalonia. The use of distributed models aids to hypothesis formulation. Hydrol.
Process., 11, 12871306.
Read, D.J. and Mitchell, D.T., 1983. Decomposition and mineralisation processes in Mediterranean-type ecosystems and in heathlands of similar structure. Ecol. Stud.: analysis synthesis, 43, 208232.
Rodà, F., Àvila,. A. and Rodrigo, A., 2002. Nitrogen deposition in Mediterranean forests. Environ. Pollut., 118, 205213.
Sala, M., 1983. Fluvial and slope processes in the Fuirosos basin,
Catalan Ranges, Northeast Iberian coast. Z. Geomorphologue.
N.F., 27, 393411.
Schlesinger, W.H., 2001. Biogeochemistry. An Analysis of Global
Change. 2nd edition. Academic Press, San Diego, USA. 588pp.
Serrasolses, I., Diego, V. and Bonilla, D., 1999. Soil nitrogen
dynamics. In: Ecology of Mediterranean evergreen oak forests,
F. Roda (Ed). Ecolological. Studies 137. Springer, Berlin. Germany.
Sivapalan, M., 2003. Process complexity at hillslope scale, process simplicity at the watershed scale: is there a connection?. Hydrol.
Process., 17, 10371041.
Stieglitz, M., Shaman, J., McNamara, J., Engel, V., Shanley, J. and Kling, G.W., 2003. An approach to understanding hydrological connectivity on the hillslope and the implications for nutrient transport. Global Biogeochem. Cycles, 17, 1105,
doi:10.1029/2003GB002041.
Technicon, 1976. Technicon instrument System. Technicon Method
Guide. Tarrytown. NY, USA.
Terrades, J., 1996. Ecologia del foc. Ed. Proa, Barcelona, Spain.
Terrades, J., 2001. Ecología de la vegetación. De la ecofisiología
de las plantas a la dinámica de comunidades y paisajes. Ed.
Omega. Barcelona. 703pp.
Vitousek, P.M., Gosz, J.R., Grier, C.C., Melillo, J.M., Reiners, W.A. and Todd, R.L. 1979. Nitrate losses from disturbed ecosystems. Science, 204, 469474.
Wade, A.J., Neal, C., Soulsby, C., Langan, S.J. and Smart, R.P., 2001. On modelling the effects of afforestation on acidification in heterogeneous catchments at different spatial and temporal scales. J. Hydrol., 250, 149169.
Wade, A.J., Durand, P., Beaujouan, V., Wessel, W.W., Raat, K.J., Whitehead, P.G., Butterfield, D., Rankinen, K. and Lepistö, A., 2002. A nitrogen model for European catchments: INCA, new model structure and equations. Hydrol. Earth Syst. Sci., 6, 559
582. (See also Errata. Hydrol. Earth Syst. Sci., 8, 858859.)