Jan Zizka (Eds) : CCSIT, SIPP, AISC, PDCTA - 2013
pp. 233–240, 2013. © CS & IT-CSCP 2013 DOI : 10.5121/csit.2013.3626
J. K. Mandal and Abhinaba Ghosh
Department of Computer Science and Engineering, University of Kalyani
Kalyani, Nadia-741235, West Bengal, India
Email- {[email protected], [email protected]}
A
BSTRACTIn this paper a novel edge detection method has been proposed which outperform Otsu method [1]. The proposed detection algorithm has been devised using the concept of genetic algorithm in spatial domain. The key of edge detection is the choice of threshold; which determines the results of edge detection. GA has been used to determine an optimal threshold over the image. Results are compared with existing Otsu technique which shows better performances.
K
EYWORDSOtsu Method, Edge Detection, Advanced Sobel Operator, Genetic algorithm, Crossover, Chromosome.
1. I
NTRODUCTION
In digital image, edge is a collection of the pixels whose gray value has a step or roof change, and it also refers to the part where the brightness local area of the image changes significantly. Edge detection of an image is a very vital area in the field of Computer Vision. Edges are significant local changes of intensity in an image. Edges typically occur on the boundary between two different regions in an image. Edges can be modeled according to their intensity profiles [2]. The quality of edge detection is highly dependent on lighting conditions, density of edges in the scene and noise. While each of these problems can be handled by adjusting certain values in the edge detector and changing the threshold value for what is considered an edge, no good method has been determined for automatically setting these values, so they must be manually changed by an operator each time the detector is run with a different set of data [3]. Since different edge detectors work better under different conditions, it would be ideal to have an algorithm that makes use of appropriate edge detection. In order to create this system, we must first know which edge detectors perform better under which conditions.
2. L
ITERATURE
S
URVEY
Edge detection find out outlines in the image. An edge-detection anti-aliased video streams. The b that determines the level of varia calculated by forming a matrix c value of this matrix area is above [5]. Examples of gradient-based gradient-based algorithms have directions which are orthogona operators have been used for edg reviewed briefly. All this edge de
In section 2.1 we have discusse section 2.2 and that of Prewitt e 2.4.
2.1 The Roberts edge detecto
The Roberts Cross operator p measurement on an image [3]. It are very sharp. Convolution met My represents the vertical 2*2 m is given below.
These masks are convoluted wit detected image. It highlights regi
2.2
The Sobel edge detectorThe Sobel operator performs a emphasizes regions of high spati the approximate absolute gradie discrete differentiation operator intensity function. Mx represent mask. The vertical and horizonta
The Sobel operator is slower convolution kernel smoothes the
EY
s of an object and boundaries between objects and the on filter can also be used to improve the appearance
basic edge-detection operator is a matrix area gradi riance between different pixels [4]. The edge-detectio
centered on a pixel chosen as the center of the matri ve a given threshold, then the middle pixel is classifie d edge detectors are Roberts, Prewitt, and Sobel oper ve kernel operators that calculate the strength of nal to each other, commonly vertical and horizonta
dge detection of digital image in spatial domain; som detection operators’ work for gray scale images in spa
ssed the Roberts edge detection method, Sobel edg t edge detection scheme in section 2.3 and Otsu meth
ctor
performs a simple, quick to compute, 2-D spa It also produces very weak responses to genuine edge ethod is applied here. Mx represents the horizontal 2 mask. The vertical and horizontal masks for Robert e
ith the original image and the output image is the r gions of high spatial frequency which often correspon
a 2-D spatial gradient measurement on an image atial frequency that correspond to edges. Typically it i
ient magnitude at each point in an input grayscale i tor computing an approximation of the gradient o nts the horizontal 3*3 mask and My represents the tal masks for sobel edge detection are given below.
r to compute than the Roberts Cross operator, b the input image to a greater extent and so makes the
the background e of blurred or dient operation tion operator is trix area. If the ified as an edge erators. All the f the slope in ntal [6]. Many me of them are patial domain.
dge detector in thod in section
patial gradient ges unless they l 2*2 mask and t edge detection
e required edge ond to edges.
ge [3] and so t is used to find e image. It is a of the image he vertical 3*3
sensitive to noise. The operator also generally produces considerably higher output values for similar edges, compared with the Roberts Cross.
2.3 Prewitt’s operator:
Prewitt operator is similar to the Sobel operator and is used for detecting vertical and horizontal edges in images [3]. It is a discrete differentiation operator, computing an approximation of the gradient of the image intensity function. Mx represents the horizontal 3*3 mask and My represents the vertical 3*3 mask. The vertical and horizontal masks for prewitt edge detection are given below.
At each image point, the gradient vector points in the direction of largest possible intensity increase and the length of the gradient vector corresponds to the rate of change in that direction. This implies the result of the Prewitt operator at an image point which is in a region of constant image intensity is a zero vector and at a point on an edge is a vector which points across the edge, from darker to brighter values.
2.4 Otsu method of Edge detection
There are many threshold selection methods. Depending on the scope of applications, the threshold methods can be divided into the 1) overall threshold method, 2) local threshold and 3) dynamic threshold method. In this paper, GA-based edge detection belongs to the overall Otsu threshold method [1].
Suppose f (x, y) is the objective image that we want to segment, its gray range is {0, 1,…, L-1}. The image pixels will be divided into two categories by threshold t: C0 = {0, 1, …, t}, C1 = {t +1, t +2, …., L-1}. C0 and C1 respectively represent the target and background [7]. The Classes square error between C0 and C1 is given below:
(1)
Here t is threshold, W0 (t) is the number of pixels in which gray value of its image are less than the threshold t. W1 (t) is the number of pixels in which the image gray value are greater than the threshold value t. 0(t) is the average gray value of the pixels in which the image gray value are less than the threshold t. And 1 (t) is the average gray value of the pixels in which the image gray values are greater than the threshold t. The t that makes variance the greatest value is the best partition threshold.
3. T
HE
T
ECHNIQUE
Initial population: A chromosome is an array of parameter values to be optimized. In our algorithm we have taken 8 bit chromosome as there are 256 no of gray levels in the input image. Any chromosome represents the string between 0 (00000000) to code L-1 (11111111) where there are L gray level values. We have taken all possible 50 randomly generated chromosomes as the initial population.
Fitness function Calculation: Threshold methods are used for segmentation of image, and these
methods can be divided into the (1) Global threshold method, (2) local threshold and (3) dynamic threshold method. We have used both local and global threshold method to perform the image segmentation and this is implemented by Genetic algorithm based approach. We have taken a gray scale image f (x, y) as input. The gray levels are in between [0 to 255] denoted by [0 to L-1]. The number of pixels at level i is denoted by ni and the total number of pixels by N =n0 + n1 +……+ nL-1.
(2)
As next step image pixels are partitioned into two classes C0 and C1 (background and object, or vice versa) at gray level t. C0 denotes pixels with gray level [0, 1,….., t] and C1 denotes pixels with gray level [t+1, t+2,..., L-1].
Let, the probabilities of class occurrence and the class mean level respectively are given by w0 and w1.
(3)
Let, 0 is the average gray value of the pixels in which the image gray value are less than the threshold ‘t’ and 1 is the average gray value of the pixels in which the image gray values are greater than the threshold ‘t’.
Then,
(5)
If c 2
and T 2
are the class variance and total class variance of gray levels respectively, their ratio is considered as the fitness function for this algorithm.
Here, c 2
=w0*w1*( 0 - 1)2 and
T 2
=w0 ( 0 – t)2+ w1( 1 – t)2+…+ wm-1( m-1 – t)2 (6)
Calculate the ratio, y= c2/ T2. This ratio is the fitness function of our algorithm. Now it is to find the threshold t which minimizes this ratio y. GA is used to find out this maximization.
Selection: The selection evaluates each individual and keeps only the fittest ones in the
population. The fitness values are calculated and 20 chromosomes are selected for next step. In addition to those fittest individuals, 10 less fit ones have also been selected according to a small probability. The others are removed from the current population.
Crossover and Mutation: The crossover recombines two individuals to have new ones which
might be better. The mutation induces changes in a small number of chromosomes units. Its purpose is to maintain the population diversified enough during the optimization process. Single point crossover has been used with crossover probability 0.9. Mutation operation has been applied on the recently selected chromosome with mutation probability Pm which follows a decaying exponential function with starting value 0.05.
Algorithm
Input: Gray scale lenna image
Output: Edge detected image
Method: Enhanced Otsu method
Step1. We have taken a gray scale image of 200*200 dimensions with the gray levels between
[0 to 255] denoted by [0 to L-1].We calculate the gradient image f (x, y) by using advanced Sobel operator.
Step2. Partition the gradient image pixels into two classes C0 and C1 (background and object, or
vice versa) at gray level t. C0 denotes pixels with gray level [0, 1,….., t] and C1 denotes pixels with gray level [t+1, t+2,..., L-1].
Step3. The fitness function is taken as y= c
2 / T
2
, where c 2
and T
2
are the class variance and total class variance of gray levels respectively.
Here, c 2
=w0*w1*( 0 - 1)2 and
T 2
=w0 ( 0 – t)2+ w1( 1 – t)2+…….+ wm-1( m-1 – t)2
Now the objective is to take that particular threshold value t which gives the maximized ratio of fitness function y.
Step4. Initialize randomly a population space of size 50 (each chromosome is of 8 bit binary
string and its value is in between gray level value 0 to 255).
Step5. We have taken all the 50 chromosomes and fitness value of each has been calculated and
then20 best fitted chromosomes are selected. Roulette Wheel is used in this selection operation. We have also arbitrarily selected 5 chromosome of less probability for future crossovers.
Step6. Single point crossover is applied at 6th bit on this less probability based chromosome and
Step7. Mutation operation is applied on the recently selected chromosome with mutation probability Pm which follows a decaying exponential function with starting value 0.05.
Step8. Threshold value t is obtained which has maximized the fitness function.
Step9. Goto step 4 and check if the new t gives better value then replace the old one by new one
and vice versa. If the iteration is more than 50, goto next step.
Step10. Finally we have got the threshold t. Let, new edge detected image is denoted g(x, y). Put
all g(x, y) = 0 (marked as non-edge or background points) if f(x, y) <t; and put all f(x, y) = 255 (edge points) if g(x, y) >= t;
Step11. This image is processed through edge thinning and finally we got the edge detected
image g’(x, y)
4. R
ESULTS
C language has been used to implement this GA based modified algorithm. We have taken Lenna image as input, the size of image is a 200 * 200 pixel. Here the Figure 1, figure 2 and figure 3 are original image, edge detected image by Otsu method, edge detected image by proposed method respectively.
Fig. 1. Original Image Fig. 2. Otsu method Fig. 3. Proposed method
5. P
ERFORMANCE
E
VALUATION
A
ND
C
OMPARISON
Comparing the results from fig 2 and fig 3 regarding detected edge of image given in fig 1, it can be easily seen that the proposed algorithm that used improved detection template and GA got better result than the Otsu method. The proposed algorithm has stronger edge search capability and more complete edge. We have done experiment on choosing crossover at points 2nd, 3rd, 4th, 5th, 6th, 7th bit of the selected chromosome, and got better result has been obtained at 6th bit crossover. So, we have taken this 6th bit crossover point in this algorithm.
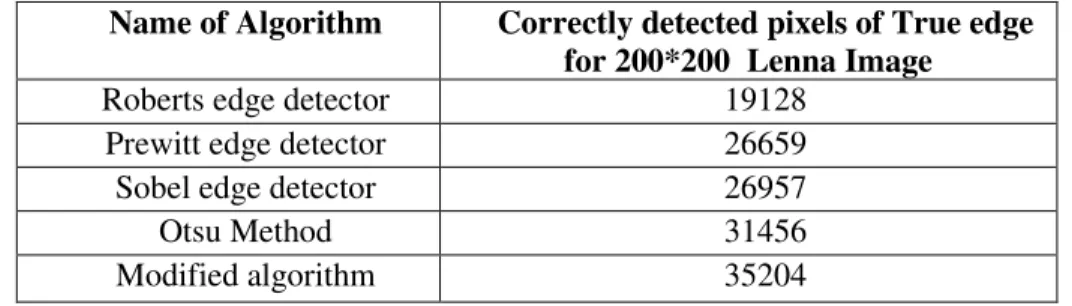
Table 1. Comparison of performance of proposed technique
Name of Algorithm Correctly detected pixels of True edge
for 200*200 Lenna Image
Roberts edge detector 19128 Prewitt edge detector 26659 Sobel edge detector 26957
Otsu Method 31456
Modified algorithm 35204
Advantages and disadvantages
The main advantage of the proposed method is that it solves problem with multiple solutions (i.e. multiple optimal threshold) and it can be easily implemented. No absolute assurance that a genetic algorithm will find a global optimum and difference between the shortest and the longest optimization response time is larger
6. C
ONCLUSIONS
This method used improved Sobel operator and genetic algorithms to optimize segmentation threshold of gradient image and proposed a new automatic optimal threshold algorithm. It overcomes classical Sobel operator’s shortcomings such as over segmentation and sensitivity. Otsu has used only global thresholding method and has taken the variance of total class difference but in our algorithm we have used local thresholding method and have considered the ratio of the class variance and total class variance of gray levels. The proposed algorithm gives better performance compared to Otsu method of edge detection. A better refining operator will be developed in the future.
A
CKNOWLEDGEMENTThe authors expressed deep sense of gratitude to the PURSE scheme of DST, the Govt. of India under which the research has been carried out.
R
EFERENCES[1] Nobuyuki Otsu, “A threshold selection method from gray-level histograms". IEEE Trans. Sys., Man., Cyber. 9 (1): 62–66. (1979).
[2] Gonzalez, R., and Woods, R. (2002). Digital image processing (2nd ed). Prentice-Hall Inc, 567-612. (2002).
[3] R. Rakesh, P. Chaudhuri and C. Murthy, “Thresholding in Edge Detection: A Statistical Approach”, IEEE Trans. Image Processing, Vol 13, No. 7, pp. 927-936, 2004.
[4] D.Ziou and S. Tabbone "Edge detection techniques: An overview", International Journal of Pattern Recognition and Image Analysis, 8(4):537–559, 1998 (1998).
[5] Kang C.C. and Wang W.J., “A novel edge detection method based on the maximizing objective function,” Pattern Recognition, vol. 40, no. 2, pp. 609–618, 2007
[7] Chang Huang, C. (2002). Edge detection based on class ratio. 152, sec.3, Peishen Rd., Shenkeng, Taipei,22202, Taiwan, R.O.C. (2002).