A Population-Based Study
Wei Gao1*, Yuen K. Ho1, Julia Verne2, Myer Glickman3, Irene J. Higginson1, on behalf of the GUIDE_Care project"
1King’s College London, School of Medicine, Cicely Saunders Institute, Department of Palliative Care, Policy and Rehabilitation, London, United Kingdom,2South West Public Health Observatory, Bristol, United Kingdom,3Life Events & Population Sources Division, Office for National Statistics, Newport, Wales, United Kingdom
Abstract
Background:Most patients with cancer prefer to die at home or in a hospice, but hospitals remain the most common place of death (PoD).This study aims to explore the changing time trends of PoD and the associated factors, which are essential for end-of-life care improvement.
Methods and Findings:The study analysed all cancer deaths in England collected by the Office for National Statistics during 1993–2010 (n= 2,281,223). Time trends of age- and gender-standardised proportion of deaths in individual PoDs were evaluated using weighted piecewise linear regression. Variables associated with PoD (home or hospice versus hospital) were determined using proportion ratio (PR) derived from the log-binomial regression, adjusting for clustering effects. Hospital remained the most common PoD throughout the study period (48.0%; 95% CI 47.9%–48.0%), followed by home (24.5%; 95% CI 24.4%–24.5%), and hospice (16.4%; 95% CI 16.3%–16.4%). Home and hospice deaths increased since 2005 (0.87%; 95% CI 0.74%–0.99%/year, 0.24%; 95% CI 0.17%–0.32%/year, respectively, p,0.001), while hospital deaths declined (21.20%; 95% CI21.41 to20.99/year,p,0.001). Patients who died from haematological cancer (PRs 0.46–0.52), who were single, widowed, or divorced (PRs 0.75–0.88), and aged over 75 (PRs 0.81–0.84 for 75–84; 0.66–0.72 for 85+) were less likely to die in home or hospice (p,0.001; reference groups: colorectal cancer, married, age 25–54). There was little improvement in patients with lung cancer of dying in home or hospice (PRs 0.87–0.88). Marital status became the second most important factor associated with PoD, after cancer type. Patients from less deprived areas (higher quintile of the deprivation index) were more likely to die at home or in a hospice than those from more deprived areas (lower quintile of the deprivation index; PRs 1.02–1.12). The analysis is limited by a lack of data on individual patients’ preferences for PoD or a clinical indication of the most appropriate PoD.
Conclusions:More efforts are needed to reduce hospital deaths. Health care facilities should be improved and enhanced to support the increased home and hospice deaths. People who are single, widowed, or divorced should be a focus for end-of-life care improvement, along with known at risk groups such as haematological cancer, lung cancer, older age, and deprivation.
Please see later in the article for the Editors’ Summary.
Citation:Gao W, Ho YK, Verne J, Glickman M, Higginson IJ, et al. (2013) Changing Patterns in Place of Cancer Death in England: A Population-Based Study. PLoS Med 10(3): e1001410. doi:10.1371/journal.pmed.1001410
Academic Editor:Anne Merriman, Hospice Africa, Uganda
ReceivedOctober 11, 2012;AcceptedFebruary 15, 2013;PublishedMarch 26, 2013
Copyright:ß2013 Gao et al. This is an open-access article distributed under the terms of the Creative Commons Attribution License, which permits unrestricted use, distribution, and reproduction in any medium, provided the original author and source are credited.
Funding:The GUIDE_Care project was funded by the National Institute for Health Research Health Services and Delivery Research (NIHR HS&DR) programme (project number 09/2000/58). The funders had no role in study design, data collection and analysis, decision to publish, or preparation of the manuscript. The views and opinions expressed therein are those of the authors and do not necessarily reflect those of the HS&DR programme, NIHR, NHS, or the Department of Health.
Competing Interests:The authors have declared that no competing interests exist.
Abbreviations:IMD, index of multiple deprivation; LSOA, layer super output area; ONS, Office for National Statistics; PoD, place of death; PR, proportion ratio; SES, socio-economic status
* E-mail: [email protected]
Introduction
End-of-life care is an issue that is relevant to everyone, as death is the only certain factor of life. Every year, around 8 million people die of cancer worldwide and the global number of cancer deaths is projected to increase [1]. Patients with cancer usually prefer to die at home or a hospice should they have a choice, particularly in high resource European countries [2]. However, cancer deaths still most commonly occur in hospitals, which is consistently regarded as the least preferred place of death (PoD) [2]. Patients with cancer who die in a hospital or intensive care unit (ICU) have worse quality of life compared with those who die at home, and their bereaved caregivers are at increased risk for developing psychiatric illness [3–5]. Meeting people’s preferences for PoD also has cost implications [6]. Research found that end-of-life care in hospital is associated with three times higher daily costs than in community care settings [7]. Therefore, reducing inappropriate deaths in hospital, and increasing home and hospice support, has become a central focus of policy initiatives in many countries around the world [8–14].
Over the past decade, resources have been directed to enable more people, mainly those with cancer, to die in their preferred place. In England since the 1990s, several national end-of-life care initiatives have been established and implemented [8]. In 2004, a National Health Service (NHS) End of Life Care (EoLC) programme was further established to promote the rollout of national end-of-life care initiatives [15]. Although valuable for policy review and oversight, to our knowledge no study has evaluated the time trend of place of cancer deaths in the context of these programmes. For the development of effective intervention strategies and end-of-life care policies, it is essential to understand the factors associated with PoD in a dynamic rather than a static way. Understanding patterns of PoD in England has value for other countries. The health care system in England is provided and financed by the government through taxation (Beveridge), and represents one of four health care models (Beveridge, Bismarck, national health insurance, out-of-pocket) worldwide [13]. Further-more, the modern hospice movement, which offers assistance to patients with advanced diseases and their families, was started by Dame Cicely Saunders in England in 1967, and has spread globally. In England, most hospice care is provided by charitable hospices with a contribution from the NHS; it is free and provided on the basis of physical, psycho-social, and spiritual needs. Consistent evidence shows that hospice is usually considered as the second most preferred PoD, next to home; however, not all countries have the similar level of hospice service provision or models [16]. England’s evaluation data on PoD may provide useful insights for end-of-life care service development with different countries and health care settings.
Patterns in place of cancer deaths in England were investigated using death registry data for 1984–1994, but there has been no subsequent in-depth update [17]. One study using data from a regional cancer registry found PoD for people with cancer changed over time; but it was restricted to only the population covered by the registry, limiting the generalisability and applica-bility of the findings [18]. To make effective improvements in end-of-life care services and enable more people to die in their preferred place, it is essential to understand the factors associated with PoD and how those factors change over time. To our knowledge, no study has evaluated this aspect, or considered the relationship between possible factors and PoD in the context of change. In the UK and worldwide, the national Death Registra-tion database has been used as an important tool for public health
planning and surveillance [1,12,13]. It has been proposed as an ideal population-based data source for end-of-life care research [19].
This study aimed to investigate the changing patterns in the: (i) common places of cancer death; (ii) time trends in place of cancer death, and (iii) factors associated with place of cancer death and their relative importance.
Methods
Data Sources
Data are collected by the Office for National Statistics (ONS) from all death registrations in England. By law in England, a death must be registered within 5 d, unless it becomes the subject of a coroner’s inquiry. The underlying cause of death (CoD) was recorded in the database using the 9th (1993–2000) or 10th (2001– 2010) edition of International Classification of Diseases (ICD-9, ICD-10) codes.
Study Population
All deaths between 1993 and 2010 where cancer was the underlying CoD (ICD-10: C00–C97; ICD-9: 140–209) were extracted. We limited the analysis period to 1993 onwards, since hospice was only recorded as a separate PoD category from 1993. As there are important differences between children/young and older people in terms of disease profile, end-of-life care model, and associated infrastructure (e.g., hospice provision), we focused on those who died aged over 25. Any benign, in-situ neoplasms and neoplasms of unknown and uncertain behaviour were excluded as the accuracy of these underlying CoD is questionable [20].
Variables
Statistical Analysis
We analysed the time trend of age- and gender-standardised proportion of deaths in each of the five PoDs. Proportions were standardised using the 2005–2010 mortality structure for more developed countries from the United Nations standard popula-tion [24]. Age- and gender-adjusted proporpopula-tions were plotted against year of death. Changes in proportions were inspected visually. Then we conducted a weighted piecewise linear regression (WPLR) analysis to confirm the findings [25]. The WPLR model was run separately for the five PoDs. In these analyses, the time trend was analysed across the whole period (1993–2010) and year of death was evaluated as a continuous variable.
To examine changing patterns, the study period was divided into four: 1993–1995, 1996–2000, 2001–2005, 2006–2010. The division took into consideration major changes in coding schemes, including PoD and ICD coding system. These included: (i) ‘‘Hospice’’ was coded as a separate category from 1993; (ii) the ICD coding system changed from the ICD-9 to the ICD-10 in 2001.
The log-binomial model was used to investigate factors associated with PoD. The dependent variable was a binary indicator for PoD (1, home or hospice; 0, hospital). In these analyses, we focused on the top three PoDs. ‘‘Home’’ and ‘‘hospice’’ categories were combined because these are usually the two most preferred PoDs, whereas ‘‘hospital’’ is the least preferred [2,26]. The clustering effect within the geographical units (LSOA) was adjusted using the general estimating equation (GEE) method, assuming an exchangeable working correlation matrix. Explanatory variables (age, gender, cancer site, year of death, marital status, SES, and regions) were forced to stay in the model. The relative importance of explanatory variables was determined by the change in the score statistics between the full and the reduced models [27]. The PRs for individual explanatory variables were derived from the constructed period-specific models. Two-way interaction effects between important factors were explored. All analyses were performed using the SAS 9.3 (SAS Institute).
Ethics and Permission
Following ONS procedures a Data Access Agreement was signed and all required forms provided in a formal agreement of data management, protection, and management. In addition, as required, all researchers accessing the data (WG, IJH, and HK) were individually assessed and approved by ONS. This study was based on fully anonymised records therefore no ethical approval was required according to the Information Commissioner’s Office (ICO) guidelines, ONS procedures, and those of the King’s College London Research Ethics Committee.
Results
After exclusion of 3,968 (0.2%) delayed registrations and 23,746 (1.0%) with missing data on key variables, the final data set consisted of 2,281,223 adults ($25 y) who died from cancer between the years 1993–2010 in England. The annual deaths fluctuated between 121,197 and 129,941.
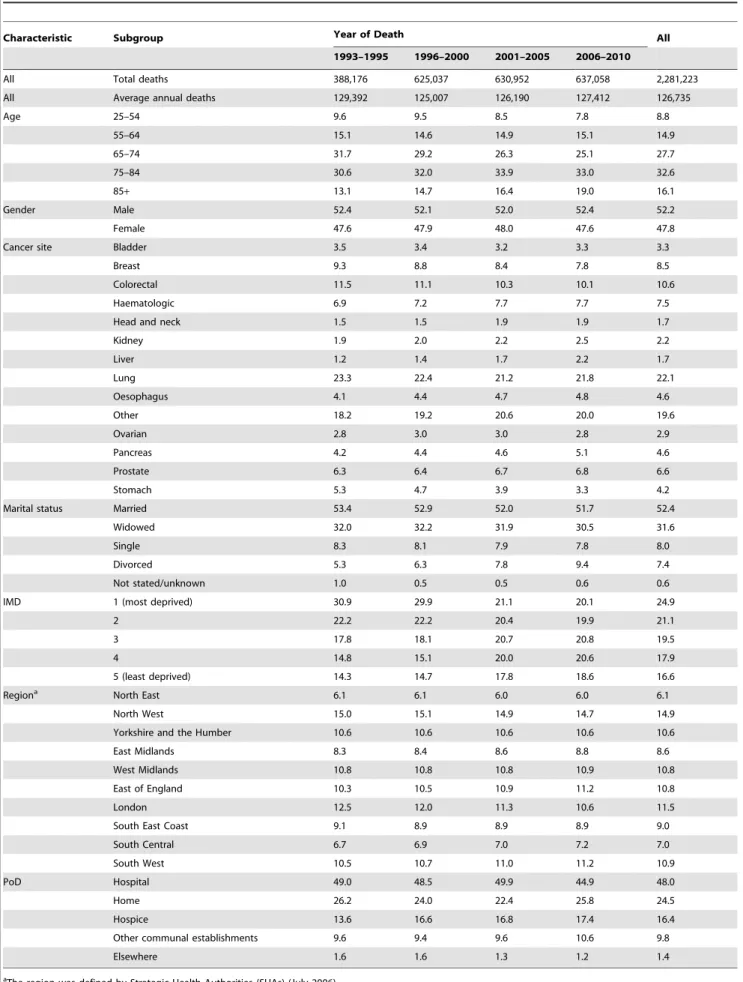
Patients with cancer died increasingly at older ages; the proportion of cancer patients who died over age 65 rose from 43.7% in 1993–1996 to 52.0% in 2006–2010 (Table 2). Slightly more men than women died of cancer over the whole study period (52.2% versus 47.8%). The three most common causes of cancer death were lung (22.1%), colorectal (10.6%), and breast (8.5%). There was a slight rise in deaths from haematological cancers (6.9%–7.2% in 1993–2000 to 7.7 in 2001–2010). Nearly half (47.0%) of people that died were single, widowed, or divorced. While cancer deaths were more likely to be residents from deprived areas in earlier periods (e.g.,14.3%–14.7% least deprived versus 29.9%–30.9% most deprived in 1993–2000), they became more evenly distributed across socio-economic groups in the later periods (17.8%–18.6% least deprived versus 20.1%–21.1% most deprived in 2001–2010). The North West and North East area represented the lowest (6.1%) and the highest (14.9%) percentage of cancer deaths, approximately reflecting the underlying popu-lation size of the regions.
Throughout the study period, hospital was the most common PoD (48.0%; 95% CI 47.9%–48.0%), followed by home (24.5%; 95% CI 24.4%–24.5%), and hospice (16.4%; 95% CI 16.3%– 16.4%). Age- and gender-adjusted deaths at home had a slight but constant downward trend (annual reduction: 20.38% [95% CI 20.45% to 20.31%]; p,0.001) between 1993 (24.0%; 95% CI 23.6%–24.4%) and 2003 (20.9%; 95% CI 20.5%–21.3%); however, this trend started reversing in 2003/2004 and the proportion of home deaths rose to 26.5% (95% CI 26.1%–26.9%) in 2010 (annual increase: 0.87%; 95% CI 0.74%–0.99%; p,0.001). The weighted piecewise linear regression (WPLR) analysis identified a significant increase in home deaths in 2005/ 2006 (21.6%; 95% CI 21.2%–21.9%) to 22.7% (95% CI 22.3%– 23.1%; p,0.001, Fdf = 1= 25.5). The hospital deaths fluctuated between 47.5%%–49.8% before a significant reduction of 1.82% (95% CI 1.81%–1.83%; p,0.001,Fdf = 1= 152.9) in 2005/2006, mirroring the change in home deaths (annual increase: 0.87%; 95% CI 0.74%–0.99%). Hospital deaths continued to decline after then, to 41.9% (95% CI 41.4%–42.5%) in 2010 (annual decrease: 21.20%; 95% CI21.41 to20.99%;p,0.001). Deaths in hospice showed an overall increasing trend (annual increase: 0.24%; 95% CI 0.17%–0.32%;p,0.001), from 11.6% (95% CI 11.3%–11.8%) in 1993 to 16.8% (95% CI 16.5%–17.2%) in 2010. A 2.04% (95%CI 2.02%–2.06%) increase in hospice deaths was detected in 1996/1997 (p,0.001,Fdf = 1= 84.3) (Figure 1).
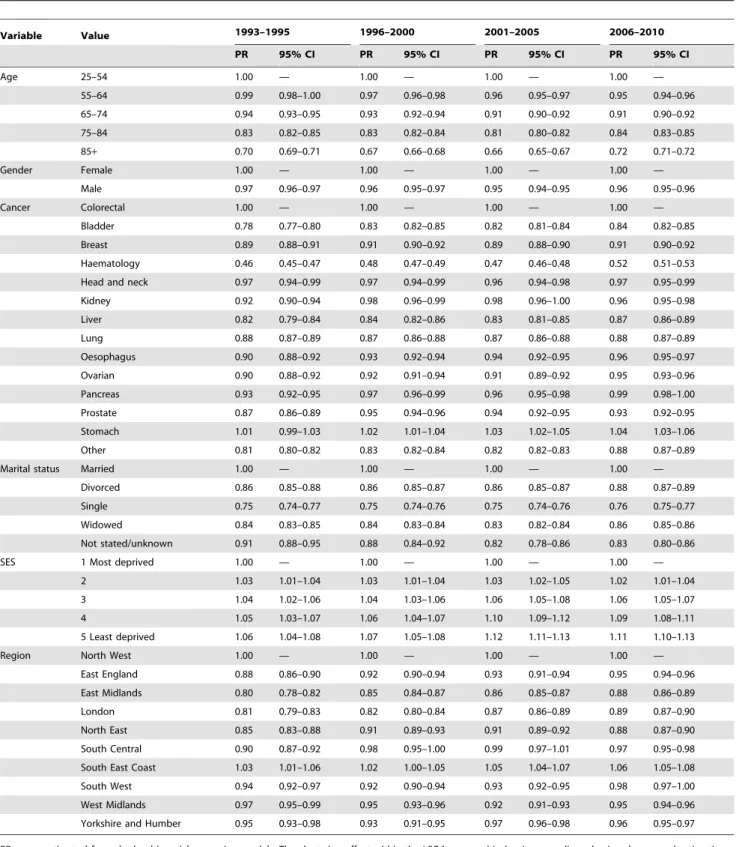
The relative importance of factors associated with where a cancer patient died (Table 3) changed over time. Cancer site was the most important factor associated with PoD (score statistics
Table 1.ICD-9 and ICD-10 codes used for the classification of underlying cause of death as cancers.
Cancer ICD-9 Codes (1993–2000) ICD-10 Codes (2001–2010)
Bladder 188 C67
Breast 174 C50
Colorectal 153,154 C18–C20
Head and neck 141,143–148,161 C00–C14,C30–C32
Kidney 189 C64–C66, C68
Haematology 200–209 C81–C96
Liver 155 C22
Lung 162 C33–C34
Oesophagus 150 C15
Ovarian 183 C56–C57
Pancreas 157 C25
Prostate 185 C61
Stomach 151 C16
Others 140–209
excluding above codes
C00–C97
excluding above codes
Table 2.Demographic characteristics of all deaths with cancer as the underlying cause of death in England, 1993–2010.
Characteristic Subgroup Year of Death All
1993–1995 1996–2000 2001–2005 2006–2010
All Total deaths 388,176 625,037 630,952 637,058 2,281,223
All Average annual deaths 129,392 125,007 126,190 127,412 126,735
Age 25–54 9.6 9.5 8.5 7.8 8.8
55–64 15.1 14.6 14.9 15.1 14.9
65–74 31.7 29.2 26.3 25.1 27.7
75–84 30.6 32.0 33.9 33.0 32.6
85+ 13.1 14.7 16.4 19.0 16.1
Gender Male 52.4 52.1 52.0 52.4 52.2
Female 47.6 47.9 48.0 47.6 47.8
Cancer site Bladder 3.5 3.4 3.2 3.3 3.3
Breast 9.3 8.8 8.4 7.8 8.5
Colorectal 11.5 11.1 10.3 10.1 10.6
Haematologic 6.9 7.2 7.7 7.7 7.5
Head and neck 1.5 1.5 1.9 1.9 1.7
Kidney 1.9 2.0 2.2 2.5 2.2
Liver 1.2 1.4 1.7 2.2 1.7
Lung 23.3 22.4 21.2 21.8 22.1
Oesophagus 4.1 4.4 4.7 4.8 4.6
Other 18.2 19.2 20.6 20.0 19.6
Ovarian 2.8 3.0 3.0 2.8 2.9
Pancreas 4.2 4.4 4.6 5.1 4.6
Prostate 6.3 6.4 6.7 6.8 6.6
Stomach 5.3 4.7 3.9 3.3 4.2
Marital status Married 53.4 52.9 52.0 51.7 52.4
Widowed 32.0 32.2 31.9 30.5 31.6
Single 8.3 8.1 7.9 7.8 8.0
Divorced 5.3 6.3 7.8 9.4 7.4
Not stated/unknown 1.0 0.5 0.5 0.6 0.6
IMD 1 (most deprived) 30.9 29.9 21.1 20.1 24.9
2 22.2 22.2 20.4 19.9 21.1
3 17.8 18.1 20.7 20.8 19.5
4 14.8 15.1 20.0 20.6 17.9
5 (least deprived) 14.3 14.7 17.8 18.6 16.6
Regiona North East 6.1 6.1 6.0 6.0 6.1
North West 15.0 15.1 14.9 14.7 14.9
Yorkshire and the Humber 10.6 10.6 10.6 10.6 10.6
East Midlands 8.3 8.4 8.6 8.8 8.6
West Midlands 10.8 10.8 10.8 10.9 10.8
East of England 10.3 10.5 10.9 11.2 10.8
London 12.5 12.0 11.3 10.6 11.5
South East Coast 9.1 8.9 8.9 8.9 9.0
South Central 6.7 6.9 7.0 7.2 7.0
South West 10.5 10.7 11.0 11.2 10.9
PoD Hospital 49.0 48.5 49.9 44.9 48.0
Home 26.2 24.0 22.4 25.8 24.5
Hospice 13.6 16.6 16.8 17.4 16.4
Other communal establishments 9.6 9.4 9.6 10.6 9.8
Elsewhere 1.6 1.6 1.3 1.2 1.4
a
range: 2257.0–5835.4;p,0.001) in all time periods. Marital status was the second most important factor during 1993–1995 (1,602.8 versus 1,471.6), but became the third during 1996–2005 (2,218.7 versus 2,321.9 in 1996–2000; 3,409.0 versus 3,983.9 in 2001– 2005); in 2006–2010, it was again second (3,369.8 versus 3,297.0). Overall, the gaps in PoD between subgroups of the three most important factors (cancer, marital status, and age; reference group: colorectal cancer, married and age 25–54) narrowed over time; this became more pronounced in 2006–2010 (Table 3). People with haematological cancers had the lowest chance of dying in home or hospice, but their likelihood of home or hospice death increased over time: the PR rose from 0.46 (95% CI 0.45–0.47) in 1993–1995 to 0.52 (95% CI 0.51–0.53) in 2006–2010. There was little improvement in chances of dying in home or hospice in lung cancer (PRs: 0.87–0.88), the most common cancer group. People who died aged over 85 were more likely to die in home or hospice in 2006–2010 (PRs: 0.72, 95% CI 0.71–0.72), than in earlier periods (PRs: 0.66–0.70). The inequality in home/hospice death by marital status slightly improved: the PRs for all status other than ‘‘married’’ in 2006–2010 were the highest (though marginal)
among subperiods (single:0.76, 95% CI 0.75–0.77; widowed:0.86, 95% CI 0.85–0.86; divorced:0.88, 95% CI 0.87–0.89).
The gaps between subgroups for less important factors (gender, SES, and region) remained stable. Men were less likely to die at home or in a hospice (PRs versus women: 0.95–0.97); patients from less deprived areas were more likely to die at home or in a hospice than those from more deprived areas (PRs:1.02–1.12). The PR difference between regions with the lowest (East Midlands or London) and highest (South East Coast) chance of death in home or hospice in four periods were: 0.23 (1993–1995), 0.20 (1996–2000), 0.19 (2001–2005), 0.18 (2006–2010). London was the lowest in 1993–2000, but was replaced by East Midlands from 2001. We also tested all models with age included as a continuous variable, the parameter estimates (Table S1, S2, S3) remained very similar to those in Table 3.
The two-way interaction effect between the top three most important factors were all significant at the level ofp,0.0001, but there was no substantial change in the parameter estimates for main effects by including the interaction term in the models (Table S4).
Figure 1. Place of cancer deaths in England, 1993–2010, age- and gender-standardised against the UN mortality standard
population[24].The 95% CIs were not plotted as they were too narrow to show.
Table 3.Proportion ratios and 95% CIs of variables associated with place of death (home/hospice versus hospital) in England 1993–2010.
Variable Value 1993–1995 1996–2000 2001–2005 2006–2010
PR 95% CI PR 95% CI PR 95% CI PR 95% CI
Age 25–54 1.00 — 1.00 — 1.00 — 1.00 —
55–64 0.99 0.98–1.00 0.97 0.96–0.98 0.96 0.95–0.97 0.95 0.94–0.96
65–74 0.94 0.93–0.95 0.93 0.92–0.94 0.91 0.90–0.92 0.91 0.90–0.92
75–84 0.83 0.82–0.85 0.83 0.82–0.84 0.81 0.80–0.82 0.84 0.83–0.85
85+ 0.70 0.69–0.71 0.67 0.66–0.68 0.66 0.65–0.67 0.72 0.71–0.72
Gender Female 1.00 — 1.00 — 1.00 — 1.00 —
Male 0.97 0.96–0.97 0.96 0.95–0.97 0.95 0.94–0.95 0.96 0.95–0.96
Cancer Colorectal 1.00 — 1.00 — 1.00 — 1.00 —
Bladder 0.78 0.77–0.80 0.83 0.82–0.85 0.82 0.81–0.84 0.84 0.82–0.85
Breast 0.89 0.88–0.91 0.91 0.90–0.92 0.89 0.88–0.90 0.91 0.90–0.92
Haematology 0.46 0.45–0.47 0.48 0.47–0.49 0.47 0.46–0.48 0.52 0.51–0.53
Head and neck 0.97 0.94–0.99 0.97 0.94–0.99 0.96 0.94–0.98 0.97 0.95–0.99
Kidney 0.92 0.90–0.94 0.98 0.96–0.99 0.98 0.96–1.00 0.96 0.95–0.98
Liver 0.82 0.79–0.84 0.84 0.82–0.86 0.83 0.81–0.85 0.87 0.86–0.89
Lung 0.88 0.87–0.89 0.87 0.86–0.88 0.87 0.86–0.88 0.88 0.87–0.89
Oesophagus 0.90 0.88–0.92 0.93 0.92–0.94 0.94 0.92–0.95 0.96 0.95–0.97
Ovarian 0.90 0.88–0.92 0.92 0.91–0.94 0.91 0.89–0.92 0.95 0.93–0.96
Pancreas 0.93 0.92–0.95 0.97 0.96–0.99 0.96 0.95–0.98 0.99 0.98–1.00
Prostate 0.87 0.86–0.89 0.95 0.94–0.96 0.94 0.92–0.95 0.93 0.92–0.95
Stomach 1.01 0.99–1.03 1.02 1.01–1.04 1.03 1.02–1.05 1.04 1.03–1.06
Other 0.81 0.80–0.82 0.83 0.82–0.84 0.82 0.82–0.83 0.88 0.87–0.89
Marital status Married 1.00 — 1.00 — 1.00 — 1.00 —
Divorced 0.86 0.85–0.88 0.86 0.85–0.87 0.86 0.85–0.87 0.88 0.87–0.89
Single 0.75 0.74–0.77 0.75 0.74–0.76 0.75 0.74–0.76 0.76 0.75–0.77
Widowed 0.84 0.83–0.85 0.84 0.83–0.84 0.83 0.82–0.84 0.86 0.85–0.86
Not stated/unknown 0.91 0.88–0.95 0.88 0.84–0.92 0.82 0.78–0.86 0.83 0.80–0.86
SES 1 Most deprived 1.00 — 1.00 — 1.00 — 1.00 —
2 1.03 1.01–1.04 1.03 1.01–1.04 1.03 1.02–1.05 1.02 1.01–1.04
3 1.04 1.02–1.06 1.04 1.03–1.06 1.06 1.05–1.08 1.06 1.05–1.07
4 1.05 1.03–1.07 1.06 1.04–1.07 1.10 1.09–1.12 1.09 1.08–1.11
5 Least deprived 1.06 1.04–1.08 1.07 1.05–1.08 1.12 1.11–1.13 1.11 1.10–1.13
Region North West 1.00 — 1.00 — 1.00 — 1.00 —
East England 0.88 0.86–0.90 0.92 0.90–0.94 0.93 0.91–0.94 0.95 0.94–0.96
East Midlands 0.80 0.78–0.82 0.85 0.84–0.87 0.86 0.85–0.87 0.88 0.86–0.89
London 0.81 0.79–0.83 0.82 0.80–0.84 0.87 0.86–0.89 0.89 0.87–0.90
North East 0.85 0.83–0.88 0.91 0.89–0.93 0.91 0.89–0.92 0.88 0.87–0.90
South Central 0.90 0.87–0.92 0.98 0.95–1.00 0.99 0.97–1.01 0.97 0.95–0.98
South East Coast 1.03 1.01–1.06 1.02 1.00–1.05 1.05 1.04–1.07 1.06 1.05–1.08
South West 0.94 0.92–0.97 0.92 0.90–0.94 0.93 0.92–0.95 0.98 0.97–1.00
West Midlands 0.97 0.95–0.99 0.95 0.93–0.96 0.92 0.91–0.93 0.95 0.94–0.96
Yorkshire and Humber 0.95 0.93–0.98 0.93 0.91–0.95 0.97 0.96–0.98 0.96 0.95–0.97
Discussion
This large-scale, population-based study found that hospitals remain the most common PoD for patients with cancer. Following a prolonged period of plateau, there was a steady downward trend in hospital deaths (to about 50%) from 2005 onwards. The pattern was mirrored by increasing home deaths; this was confirmed by statistical modelling. This trend coincides with the launch of a National End of Life Care (EoLC) Programme in Nov 2004 in England [15], which was based on research evidence about patient preferences and possible solutions. This trend continued steadily since 2005 [16,17,26]. The programme aimed to reduce hospital deaths and enable more people to die at a place of their choice, usually own home or a hospice, through promoting good practice in end-of-life care. Compared to people with other diseases, patients with cancer had better access to end-of-life care facilities [8,28]. One would expect that patients with cancer would be the first beneficiaries of national initiatives on end-of-life care. An earlier report on PoD using aggregated level data in England and Wales found a similar but less pronounced reversal trend for all cause home deaths [22]. Findings from this cancer focused study, together with earlier research on all-cause deaths, provide some support for the effectiveness of national initiatives in improving end-of-life care; however, this needs to be confirmed by subsequent studies.
There was a tendency for the inequality gap in PoD to become smaller; however, little improvement exists for those with certain types of cancer. For example, in 2006–2010, deaths from haematological cancer were still 50% more likely to have occurred in hospitals compared with colorectal cancer. These results were consistent with other studies [9,18,29–31]. Reasons for high hospital deaths in haematological cancer may be related to the complex care transition inherent to haematological malignancies, disease symptoms, the side effects of chemotherapy, or limited links between haematology and palliative care services [30]. However, current evidence is fragmented and derived from studies with limited generalisability. Future studies are needed to examine the risk factors for hospital death in heamatological malignancies. Lung cancer, one of the most common cancers in the UK and worldwide [1], showed little improvement in the chances of dying in home or hospice. A recent cohort study on 2,155 patients with advanced cancer suggests that this outcome might be related to late discussions of end-of-life care planning [32].
We also found that marital status is becoming increasingly important as a risk factor for hospital death. In 2006–2010, marital status became the second most important determinant for PoD. Married patients with cancer had significantly better chances of dying in home or hospice than their single, divorced, or widowed peers. Our data support findings in other countries [33–35]. Married individuals may receive more home support from their partners, enabling them more likely to die in their preferred place [31]. Individuals from more deprived areas had higher hospital deaths, perhaps suggesting that social support may play an important role in PoD. However, there is little evidence on the causes of this inequality, which might also include accessibility of out-of-hours care services, limited knowledge of available care options, or inability to bear the costs of caring at home. Policy-makers and health services planners should take into consideration the support from partners or spouses, other family members, and the local community in order to design effective end-of-life care services.
In the current era of an aging population, it is particularly important to keep standards of end-of-life care at the highest level for older people. Substandard health care generally is more
frequently reported in older rather than in younger people [36,37]. This inequity exists also in the treatment of cancer pain. Compared with those under 50 y, patients with cancer aged over 80 y are less than half as likely to be prescribed appropriate strong analgesics [38]. Inadequate symptom management may be a reason for hospital admission. We found that age was negatively associated with the likelihood of death at own home or a hospice, but the gap between young and old is getting smaller. This is an encouraging trend, if home is the preferred PoD and quality is high. A preference is influenced by prior experience, positive or negative, and patients may change preference if they have a poor experience of home or hospital care [26]. Some older people also fear to be a burden to relatives or friends [39]. Population-based studies of preferences have shown that the majority of older people do want to remain at home or (for those aged over 85 y) in a hospice [2]. Therefore, research is needed on ways to improve the quality of home care for older people, to meet preferences and ensure symptom management and quality.
A worrying trend is emerging; the gaps in PoD between those who lived in advantaged and disadvantaged areas widened in recent periods (2001–2010), in contrast to converging trends for the other factors. This may be prone to ecological fallacy, as the deprivation was measured at the area level. It needs to be further investigated, ideally, measuring deprivation at the individual level. Nevertheless, it suggests that the End of Life Care (EoLC) strategy may not yet be influencing the poorest communities in England, and action should be targeted to these areas. We also observed significant variations in PoD across regions; the south coast area has the highest chance of death occurring in home or hospice. Although the difference between the regions has become less variable over time, it persists; even taking into account all available and seemingly important confounders. In-depth comparative studies may help to reveal the crucial factors that drive these differences.
Strengths and Limitations
should be exercised when applying our findings to individual patients.
In conclusion, hospital remained the most common PoD for patients with cancer in England (48%). Home and hospice deaths increased since 2005, oppositely mirroring reducing trends in hospital deaths. People who died from haematological cancer, who were single, widowed or divorced, and aged over 75 y, were less likely to die in home or hospice. There was little improvement in patients with lung cancer of dying in home or hospice. Marital status overtook age as the second most important factor associated with PoD, after cancer type. More efforts are needed to reduce hospital deaths. Health care facilities should be improved and enhanced to support the increased home and hospice deaths. People who are single, widowed, or divorced should be a focus for end-of-life care improvement, along with known at risk groups such as haematological cancer, lung cancer, older age, and deprivation.
Supporting Information
Table S1 Proportion ratios and 95% CIs of variables associated with place of death (home/hospice versus hospital) in England 1993–2010; with the interaction term of age and cancer and showing only main effects. (DOCX)
Table S2 Proportion ratios and 95% CIs of variables associated with place of death(home/hospice versus hospital) in England 1993–2010; with the interaction term of age and marital status and showing only main effects.
(DOCX)
Table S3 Proportion ratios and 95% CIs of variables associated with place of death(home/hospice versus hospital) in England 1993–2010; with interaction term of cancer and marital status and showing only main effects.
(DOCX)
Table S4 Proportion ratios and 95% CIs of variables associated with place of death (home/hospice versus hospital) in England 1993–2010; age at death was modelled as a continuous variable.
(DOCX)
Acknowledgments
The investigators of the GUIDE_Care project: Irene J Higginson (PI), Wei Gao, Julia Verne, Myer Glickman, and Barbara Gomes thank the following members of the Project Advisory Group (PAG): Tony Bonser, Shaheen Khan, Jonathan Koffman, Katie Lindsey, Roberta Lovick, Tariq Malik, Carolyn Morris, Andy Pring, Stafford Scholes, Katherine Sleeman. We thank the ONS for supplying data; ONS staff Claudia Wells, Vanessa Fearn, and Julie Messer for their advice and support in the preparation of the data for analysis; and Emma Gordon and Julie Messer for critically commenting on data related issues.
Author Contributions
Developed analysis plan: WG IJH. Data checking, recoding, and merger of datasets: WG YKH. Critical review: WG IJH JV MG YKH. Co-guarantors: WG IJH. Conceived and designed the experiments: WG IJH JV MG. Analyzed the data: WG YKH. Wrote the first draft of the manuscript: WG. Contributed to the writing of the manuscript: WG IJH JV MG. ICMJE criteria for authorship read and met: WG IJH JV MG YKH. Agree with manuscript results and conclusions: WG IJH JV MG YKH.
References
1. WHO Media centre (2013) Cancer: Fact sheet No 297. Accessed 26 January 2013. Available: http://www.who.int/mediacentre/factsheets/fs297/en/index. html.
2. Gomes B, Higginson IJ, Calanzani N, Cohen J, Deliens L, et al. (2012) Preferences for place of death if faced with advanced cancer: a population survey in England, Flanders, Germany, Italy, the Netherlands, Portugal and Spain. Ann Oncol 23: 2006–2015.
3. Wright AA, Keating NL, Balboni TA, Matulonis UA, Block SD, et al. (2010) Place of death: correlations with quality of life of patients with cancer and predictors of bereaved caregivers’ mental health. J Clin Oncol 28: 4457–4464. 4. Mitchell AJ, Chan M, Bhatti H, Halton M, Grassi L, et al. (2011) Prevalence of depression, anxiety, and adjustment disorder in oncological, haematological, and palliative-care settings: a meta-analysis of 94 interview-based studies. Lancet Oncol 12: 160–174.
5. Lindqvist O, Tishelman C, Hagelin CL, Clark JB, Daud ML, et al. (2012) Complexity in non-pharmacological caregiving activities at the end of life: an international qualitative study. PLoS Med 9: e1001173. doi:10.1371/journal. pmed.1001173
6. Jordhoy MS, Fayers P, Saltnes T, Ahlner-Elmqvist M, Jannert M, et al. (2000) A palliative-care intervention and death at home: a cluster randomised trial. Lancet 356: 888–893.
7. Marie Curie Cancer Care (2012) Understanding the cost of end of life care in different settings. 8 p. London: Marie Curie Cancer Care.
8. Department of Health (2008) End of life care strategy - promoting high quality care for all adults at the end of life. 173 p. London: Department of Health. 9. Castillo Guzman S, Palacios-Rios D, Nava-Obregon TA, Torres-Perez JF,
Gonzalez-Santiago O (2012) Home versus hospital mortality from cancer in Mexico (1999–2009). Am J Hosp Palliat Care. In press.
10. European Association for Palliative Care (2010) EAPC task force on the development of palliative care in Europe. Accessed 26 January 2013. Available: http://www.eapcnet.eu/Themes/Organisation/DevelopmentinEurope.aspx. 11. Hunt RW, Bond MJ, Groth RK, King PM (1991) Place of death in South
Australia. Patterns from 1910 to 1987. Med J Aust 155: 549–553.
12. National Center for Health Statistics (2011) Health, United States, 2010: with special feature on death and dying. Hyattsville (Maryland): National Center for Health Statistics. 563 p.
13. Sharma M, Atri A (2010) Essentials of International Health. Sudbury (Massachusetts): Jones and Bartlett Publishers. 500 p.
14. Warren JL, Barbera L, Bremner KE, Yabroff KR, Hoch JS, et al. (2011) End-of-life care for lung cancer patients in the United States and Ontario. J Natl Cancer Inst 103: 853–862.
15. National End of Life Care Programme (2013) National end of life care programme. Accessed 26 January 2013. Available: http://www. endoflifecareforadults.nhs.uk/.
16. Higginson IJ (2005) End-of-life care: lessons from other nations. J Palliat Med 8 Suppl 1: S161–S173.
17. Higginson IJ, Astin P, Dolan S (1998) Where do cancer patients die? Ten-year trends in the place of death of cancer patients in England. Palliat Med 12: 353– 363.
18. Davies E, Linklater KM, Jack RH, Clark L, Moller H (2006) How is place of death from cancer changing and what affects it? Analysis of cancer registration and service data. Br J Cancer 95: 593–600.
19. Cohen J, Bilsen J, Miccinesi G, Lofmark R, Addington-Hall J, et al. (2007) Using death certificate data to study place of death in 9 European countries: opportunities and weaknesses. BMC Public Health 7: 283.
20. Lahti RA, Penttila A (2001) The validity of death certificates: routine validation of death certification and its effects on mortality statistics. Forensic Sci Int 115: 15–32.
21. Turner EL, Dobson JE, Pocock SJ (2010) Categorisation of continuous risk factors in epidemiological publications: a survey of current practice. Epidemiol Perspect Innov 7: 9.
22. Gomes B, Calanzani N, Higginson IJ (2012) Reversal of the British trends in place of death: time series analysis 2004–2010. Palliat Med 26: 102–107. 23. Payne RA, Abel GA (2012) UK indices of multiple deprivation-a way to make
comparisons across constituent countries. London: Health Statistics Quarterly Office for National Statistics.
24. Population Division-Population Estimates and Projections Section (2011) World population prospects, the 2010 revision. Accessed 26 January 2013. Available: http://esa.un.org/wpp/Excel-Data/mortality.htm.
25. Chu KC, Baker SG, Tarone RE (1999) A method for identifying abrupt changes in U.S. cancer mortality trends. Cancer 86: 157–169.
26. Higginson IJ, Sen-Gupta GJ (2000) Place of care in advanced cancer: a qualitative systematic literature review of patient preferences. J Palliat Med 3: 287–300.
28. Murtagh FE, Preston M, Higginson I (2004) Patterns of dying: palliative care for non-malignant disease. Clin Med 4: 39–44.
29. Bruera E, Russell N, Sweeney C, Fisch M, Palmer JL (2002) Place of death and its predictors for local patients registered at a comprehensive cancer center. J Clin Oncol 20: 2127–2133.
30. Howell DA, Roman E, Cox H, Smith AG, Patmore R, et al. (2010) Destined to die in hospital? Systematic review and meta-analysis of place of death in haematological malignancy. BMC Palliat Care 9: 9.
31. Gomes B, Higginson IJ (2006) Factors influencing death at home in terminally ill patients with cancer: systematic review. BMJ 332: 515–521.
32. Mack JW, Cronin A, Taback N, Huskamp HA, Keating NL, et al. (2012) End-of-life care discussions among patients with advanced cancer: a cohort study. Ann Intern Med 156: 204–210.
33. Costantini M, Camoirano E, Madeddu L, Bruzzi P, Verganelli E, et al. (1993) Palliative home care and place of death among cancer patients: a population-based study. Palliat Med 7: 323–331.
34. Moinpour CM, Polissar L (1989) Factors affecting place of death of hospice and non-hospice cancer patients. Am J Public Health 79: 1549–1551.
35. Bruera E, Sweeney C, Russell N, Willey JS, Palmer JL (2003) Place of death of Houston area residents with cancer over a two-year period. J Pain Symptom Manage 26: 637–643.
36. Bolmsjo IA (2008) End-of-life care for old people: a review of the literature. Am J Hosp Palliat Care 25: 328–338.
37. Grundy E, Mayer D, Young H, Sloggett A (2004) Living arrangements and place of death of older people with cancer in England and Wales: a record linkage study. Br J Cancer 91: 907–912.
38. Higginson IJ, Gao W (2012) Opioid prescribing for cancer pain during the last 3 months of life: associated factors and 9-year trends in a nationwide United kingdom cohort study. J Clin Oncol 30: 4373–4379.
Editors’ Summary
Background.Death is the only certain event in our lives.
Consequently, end-of-life care is an issue that is relevant to everyone, and everyone hopes for a ‘‘good death’’ (a death that is free from avoidable distress and suffering) for themselves and for their loved ones. Many factors contrib-ute to a good death, including the place of death. When asked, most people say they would rather die at home or in a hospice (a care facility that gives supportive care to people in the final phase of a terminal illness and that focuses on comfort and quality of life rather than on cure) than in a hospital. Importantly, patients who die at home or in a hospice often have a better quality of life than those who die in hospital, and caring for terminally ill patients in the community is less expensive than caring for them in hospital.
Why Was This Study Done? Many countries have
introduced end-of-life care policies that are designed to enable more people to die at home or in hospices. England, for example, implemented its National End of Life Care Programme in 2004. However, to improve end-of-life care services and to enable more people to die in their preferred place, we need to understand how the patterns of place of death and the factors that affect the place of death are changing over time. In this population-based study, the researchers examine the changing pattern of place of death of people with cancer and the factors associated with place of death in England between 1993 and 2010. Cancer is a leading cause of death globally and is responsible for 8 million deaths annually. Deaths from cancer still occur most commonly in hospitals, which are the least preferred place of death for people with cancer; home and hospices are the first and second preferred places of death, respectively, for such people.
What Did the Researchers Do and Find?The
research-ers used death registration data collected by the Office of National Statistics to identify all the adult cancer deaths in England between 1993 and 2010 (2.28 million deaths) and to determine where these deaths occurred, time trends in place of death, and the factors associated with place of death. Hospital was the commonest place of death throughout the study period—48% of cancer deaths occurred in hospital, 24.5% at home, and 16.4% in hospices. The proportion of home deaths increased after 2005 whereas the proportion of hospital deaths declined. The proportion of deaths in hospices also increased over the study period. The most important factor associated with place of death was cancer site. For example, patients who died from a blood (hematological) cancer were more likely to die in hospital than patients with colorectal cancer throughout the study period although the proportion dying at home or in a hospice increased over time. Being single, widowed, or divorced was associated with a higher likelihood of dying in hospital than being married. Being over 75 was associated with a higher likelihood of dying in hospital than being 25–54 although elderly people were more likely to die at home or in a hospice after 2006 than in earlier periods.
What Do These Findings Mean? These findings show
that the hospital is still the commonest place of death for patients with cancer in England. However, the increase in home and hospice deaths since 2005 suggests that the National End of Life Care Programme has enabled more people to die at their preferred place of death. These findings identify cancer site, marital status, and age as the three most important factors associated with place of death for patients with cancer. Because the study is a large-scale, population-based study, these findings are likely to be generalizable to other high-income settings. However, because the study did not include data on individual patient preferences for place of death, these findings should be applied with care to individual patients. Importantly, these findings indicate that more needs to be done to support people with cancer (and other terminal illnesses) who wish to die at home or in a hospice. Moreover, they identify groups of people—single, widowed or divorced individuals, older people, and people with specific types of cancer—who need extra help to ensure that they are able to choose where they die.
Additional Information.Please access these Web sites via
the online version of this summary at http://dx.doi.org/10. 1371/journal.pmed.1001410.
![Figure 1. Place of cancer deaths in England, 1993–2010, age- and gender-standardised against the UN mortality standard population [24]](https://thumb-eu.123doks.com/thumbv2/123dok_br/16384458.192183/5.918.101.826.91.706/figure-place-cancer-england-standardised-mortality-standard-population.webp)