External Validation of Models for Prediction
of Lymph Node Metastasis in Urothelial
Carcinoma of the Bladder
Ja Hyeon Ku1, Myong Kim1, Seok-Soo Byun2, Hyeon Jeong3, Cheol Kwak1, Hyeon Hoe Kim1*, Sang Eun Lee2
1Department of Urology, Seoul National University Hospital, Seoul, Korea,2Department of Urology, Seoul National University Bundang Hospital, Seongnam, Korea,3Department of Urology, SMG-SNU Boramae Medical Center, Seoul, Korea
Abstract
Purpose
To externally validate models to predict LN metastsis; Karakiewicz nomogram, clinical nodal staging score (cNSS), and pathologic nodal staging score (pNSS) using a different cohort
Materials and Methods
Clinicopathologic data from 500 patients who underwent radical cystectomy and pelvic lym-phadenectomy were analyzed. The overall predictive values of models were compared with the criteria of overall performance, discrimination, calibration, and clinical usefulness.
Results
Presence of pN+ stages was recorded in 117 patients (23.4%). Agreement between clinical and pathologic stage was noted in 174 (34.8%). Based on Nagelkerke’s peudo-R2and brier score, pNSS demonstrated best overall performance. Area under the receiver operating characteristics curve, showed that pNSS had the best discriminatory ability. In all models, calibration was on average correct (calibration-in-the-large coefficient = zero). On decision curve analysis, pNSS performed better than other models across a wide range of threshold probabilities.
Conclusions
When compared to pNSS, current precystectomy models such as the Karakiewicz nomo-gram and cNSS cannot predict the probability of LN metastases accurately. The findings suggest that the application of pNSS to Asian patients is feasible.
a11111
OPEN ACCESS
Citation:Ku JH, Kim M, Byun S-S, Jeong H, Kwak C, Kim HH, et al. (2015) External Validation of Models for Prediction of Lymph Node Metastasis in Urothelial Carcinoma of the Bladder. PLoS ONE 10(10): e0120552. doi:10.1371/journal.pone.0120552
Editor:Francisco X. Real, Centro Nacional de Investigaciones Oncológicas (CNIO), SPAIN
Received:August 28, 2014
Accepted:February 5, 2015
Published:October 1, 2015
Copyright:© 2015 Ku et al. This is an open access article distributed under the terms of theCreative Commons Attribution License, which permits unrestricted use, distribution, and reproduction in any medium, provided the original author and source are credited.
Data Availability Statement:Relevant data used in this study are available upon request due to ethical restrictions and privacy protections. Requests to access data should be directed to the corresponding author ([email protected]).
Funding:The authors received no specific funding for this work.
Introduction
Radical cystectomy with lymph node (LN) dissection constitutes the standard treatment for muscle invasive and refractory nonmuscle invasive bladder cancer. As nodal disease is a power-ful predictor of cancer-specific survival [1], knowledge of nodal status influences patient counseling and, more importantly, clinical decision making regarding follow-up scheduling and adjuvant chemotherapy [2,3].
Karakiewicz et al. [4] developed a multivariate nomogram with the intent of accurately pre-dicting presence of LN metastases at cystectomy. Some investigators hypothesized that true nodal status could be accurately predicted based on the number of LNs examined and clinical or pathologic features; clinical nodal staging score (cNSS) [5] and pathologic nodal staging score (pNSS) [6] were developed to predict the probability that a patient with pathologically confirmed negative LNs is free of missed LN metastasis.
The aim of the present study was to externally validate the Karakiewicz nomogram, cNSS, and pNSS using a cohort from three centers from different countries.
Materials and Methods
Study group
Studies were undertaken with the approval of the Institutional Review Board (IRB) of Seoul National University Hospital (No. H-1212-057-450), Seoul National University Bundang Hos-pital (No. B-1310-222-114), and SMG-SNU Boramae Medical Center (No. 16-2013-127). All information of patients was anonymised and de-identified prior to analysis. The need for informed consent was waived by the IRB because of the retrospective design of this study. The medical records of patients who underwent radical cystectomy and pelvic lymphadenectomy at three medical centers in Korea were reviewed. For databases, detailed information of patient characteristics and pathologic details were collected. All identified data inconsistencies and integrity problems were resolved before analysis. We excluded patients<18-years-of-age,
those presenting metastatic disease, and those with malignancies other than urothelial carci-noma. This study comprised 388 patients from Seoul National University Hospital, Seoul, Korea, between 1991 and 2011, 90 patients from Seoul National University Bundang Hospital, Seongnam, Korea between 2003 and 2011, and 22 patients from SMG-SNU Boramae Medical Center, Seoul, Korea between 2008 and 2011.
Clinical stage was assigned based on the pathologic evaluation of the transurethral resection (TUR) specimen, bimanual examination, and imaging results. Pathologic specimens were pro-cessed and evaluated according to standard pathologic procedures by staff surgical pathologists at each institution. Pathologic stage was assigned according to the 2002 American Joint Cancer Committee TNM classification [7]. Tumor grade was assessed according to the 1973 World Health Organization classification [8]. Lymphovascular invasion (LVI) was defined as the unequivocal presence of tumor cells in an endothelium lined space without underlying muscu-lar walls. Positive surgical margins were defined as the microscopic presence of malignant cells at the resection margins.
Predictive models
cystectomy. cNSS is a look-up table requiring clinical T stage and number of LN retrieved [5]. pNSS is also a look-up table, which requires pathologic T stage, number of LNs retrieved, and the status of LVI [6].
Statistical analyses
The overall predictive values of models were compared with several criteria. The overall perfor-mances of models (number of LNs removed, Karakiewicz nomogram, cNSS, and pNSS) were assessed separately by using R2statistic (Nagelkerke’s pseudo-R2) [9] and Brier score (mean squared prediction error) [10]. Nagelkerke’s peudo-R2can vary from 0 to 1, with a larger R2 indicating better predictive performance. Brier score was calculated for each patient and then averaged. A score of 0 indicates that the model can perfectly forecast patient-level outcomes, while the worst score achievable is 1.
Discrimination means the ability of the risk prediction models to distinguish those with event from those without event. Discriminative ability was determined by the area under the ROC curve. A score of 1 suggests that the model can perfectly discriminate between patients who will have LN metastases. A score of 0.5 indicates that the model has no discriminative abil-ity. All area under the ROC curve estimates were internally validated using 500 bootstrap sam-ples. Statistical differences in area under the ROC curves were evaluated by the nonparametric method [11].
Calibration means how closely the predicted probabilities reflect actual risk. We assessed general calibration by using a calibration plot. The relationship between the model-derived and actuarial outcome was graphically explored within calibration plots to explore model perfor-mance. The validation was done using 200 bootstrap resamples to decrease overfit bias. The calibration plot was characterized by an intercept, which indicates the extent that predictions are systemically too or too high, and calibration slope, which should be 1 [12,13]. A value of calibration slope may be interpreted as reflecting a need for shrinkage of regression coefficients in a prediction model [14].
Decision curve analysis (DCA) was used to explore the clinical value of each model [15]. DCA is a method for evaluating the clinical net benefit of prediction models; one sums the ben-efits (true positives) and subtracts the harms (false positives).
For all statistical analyses, two-sided p<0.05 was regarded as significant. Models, statistics,
and Figs were prepared using SPSS software (SPSS, Chicago, IL) and R 2.13.2 (http://www. cran.r-project.org).
Results
Patient population
The demographic data for model development cohorts in comparison to external validation cohort is shown inTable 1. In model development cohorts, more than 40% of patients had locally advanced disease (pT3 or pT4) and about 25% exhibited LN-positive cancer (pN+). While no patients received neoadjuvant chemotherapy in cNSS and pNSS development cohort, neoadjuvant chemotherapy was administered in 4% of the nomogram development cohort and 9% of the external validation cohort.
Table 1. Clinical and pathologic characteristics of patients treated with radical cystectomy for urothelial carcinomas of the urinary bladder.
Variables Nomogram development cohort cNSS and pNSS development cohort External validation cohort
No. of patients 726 4,335 500
Period 1984–2003 1980–2008 1991–2011
Age (years)
Mean (median) 64.6 (66.0) NA (67.0) 62.8 (64.0)
Range 33.8–89.2 23.0–93.0 25.0–85.6
Gender
Male 593 (81.7%) 3,464 (80.0%) 455 (91.0%)
Female 133 (18.3%) 871 (20.0%) 45 (9.0%)
TUR T stage
Tis 80 (11.0%) NA 23 (4.6%)
Ta 16 (2.2%) NA 37 (7.4%)
T1 173 (23.8%) NA 149 (29.8%)
T2 375 (51.7%) NA 277 (55.4%)
T3 45 (6.2%) NA 0 (0.0%)
T4 37 (5.1%) NA 14 (2.8%)
TUR grade
1 7 (1.0%) NA 4 (0.8%)
2 61 (8.4%) NA 135 (27.0%)
3 658 (90.6%) NA 361 (72.2%)
Concomitant CIS at TUR 294 (40.5%) NA 53 (10.6%)
Clinical T stage*
Tis NA 316 (7.3%) 16 (3.2%)
Ta NA 138 (3.2%) 18 (3.6%)
T1 NA 1,114 (25.7%) 102 (20.4%)
T2 NA 2,450 (56.5%) 249 (49.8%)
T3/4 NA 317 (7.3%) 115 (23.0%)
Pathologic T stage
pT0/is/a 165 (19.7%) 774 (17.9%) 99 (19.8%)
pT1 91 (12.5%) 585 (13.5%) 73 (14.6%)
pT2 166 (22.9%) 1,042 (24.0%) 123 (24.6%)
pT3/4 304 (41.9%) 1,934 (44.6%) 205 (41.0%)
Pathologic N stage
Negative 533 (76.2%) 3,216 (74.2%) 393 (76.6%)
Positive 173 (23.8%) 1,119 (25.8%) 117 (23.4%)
Presence of LVI at cystectomy NA 1,475 (34.0%) 183 (36.6%)
Positive soft tissue surgical margin NA 262 (6.1%) 35 (7.0%)
No. of examined LNs
Mean (median) NA NA (18.0) 14.4 (13.0)
Range NA 1–136 2–57
Neoadjuvant chemotherapy 38 (5.2%) 0 (0.0%) 45 (9.0%)
Neoadjuvant radiotherapy NA 0 (0.0%) 0 (0.0%)
cNSS: clinical nodal staging score, pNSS: pathologic nodal staging score, NA: not available, TUR: transurethral resection, CIS: carcinoma in situ, LVI: lymphovascular invasion, LN: lymph node
*based on TUR T stage, bimanual examination and imaging study results.
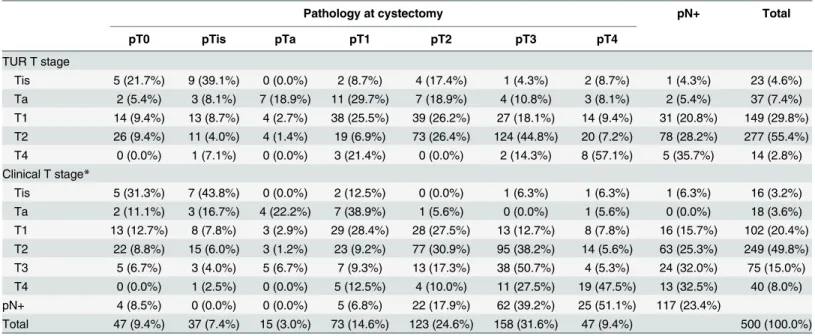
clinical stage, was noted in 107 (21.4%) and 151 (30.2%), respectively. Of 117 patients with LN metastases at cystectomy, T1 or lower disease at TUR was found in 34 (30.5%), T2 disease in 78 (28.2%), and T4 stages in5 (35.7%), whereas clinical T1 or lower disease was noted in 17 (22.0%), clinical T2 disease in 63 (25.3%), clinical T3 disease in 24 (32.0%), and clinical T4 dis-ease in 13 (32.5%).
Model performance
Data of model performances are presented inTable 3. pNSS demonstrated good predictive effi-cacy. Estimates of Nagelkerke’s peudo-R2of pNSS were higher than those of others. The brier score of pNSS was 0.1482, which was lower than that of other models.
Table 2. Cross-tabulation between T stage at transurethral resection and clinical T stage and pathologic stage at cystectomy.
Pathology at cystectomy pN+ Total
pT0 pTis pTa pT1 pT2 pT3 pT4
TUR T stage
Tis 5 (21.7%) 9 (39.1%) 0 (0.0%) 2 (8.7%) 4 (17.4%) 1 (4.3%) 2 (8.7%) 1 (4.3%) 23 (4.6%) Ta 2 (5.4%) 3 (8.1%) 7 (18.9%) 11 (29.7%) 7 (18.9%) 4 (10.8%) 3 (8.1%) 2 (5.4%) 37 (7.4%) T1 14 (9.4%) 13 (8.7%) 4 (2.7%) 38 (25.5%) 39 (26.2%) 27 (18.1%) 14 (9.4%) 31 (20.8%) 149 (29.8%) T2 26 (9.4%) 11 (4.0%) 4 (1.4%) 19 (6.9%) 73 (26.4%) 124 (44.8%) 20 (7.2%) 78 (28.2%) 277 (55.4%) T4 0 (0.0%) 1 (7.1%) 0 (0.0%) 3 (21.4%) 0 (0.0%) 2 (14.3%) 8 (57.1%) 5 (35.7%) 14 (2.8%) Clinical T stage*
Tis 5 (31.3%) 7 (43.8%) 0 (0.0%) 2 (12.5%) 0 (0.0%) 1 (6.3%) 1 (6.3%) 1 (6.3%) 16 (3.2%) Ta 2 (11.1%) 3 (16.7%) 4 (22.2%) 7 (38.9%) 1 (5.6%) 0 (0.0%) 1 (5.6%) 0 (0.0%) 18 (3.6%) T1 13 (12.7%) 8 (7.8%) 3 (2.9%) 29 (28.4%) 28 (27.5%) 13 (12.7%) 8 (7.8%) 16 (15.7%) 102 (20.4%) T2 22 (8.8%) 15 (6.0%) 3 (1.2%) 23 (9.2%) 77 (30.9%) 95 (38.2%) 14 (5.6%) 63 (25.3%) 249 (49.8%) T3 5 (6.7%) 3 (4.0%) 5 (6.7%) 7 (9.3%) 13 (17.3%) 38 (50.7%) 4 (5.3%) 24 (32.0%) 75 (15.0%) T4 0 (0.0%) 1 (2.5%) 0 (0.0%) 5 (12.5%) 4 (10.0%) 11 (27.5%) 19 (47.5%) 13 (32.5%) 40 (8.0%) pN+ 4 (8.5%) 0 (0.0%) 0 (0.0%) 5 (6.8%) 22 (17.9%) 62 (39.2%) 25 (51.1%) 117 (23.4%)
Total 47 (9.4%) 37 (7.4%) 15 (3.0%) 73 (14.6%) 123 (24.6%) 158 (31.6%) 47 (9.4%) 500 (100.0%)
TUR: transurethral resection
*based on TUR T stage, bimanual examination and imaging study results.
doi:10.1371/journal.pone.0120552.t002
Table 3. Performance of models.
No. of lymph nodes removed
Karakiewicz nomogram
Clinical nodal staging score
Pathologic nodal staging score
Overall
Nagelkerke’s peudo-R2 0.7% 2.6% 2.1% 23.8%
Brier score 0.1782 0.1761 0.1768 0.1482
Discrimination
Area under the curve (95% CI)*
0.514 (0.452–0.577) 0.588 (0.534–0.642) 0.589 (0.531–0.647) 0.776 (0.729–0.824)
Calibration
Calibration-in-the-large 0 0 0 0
Calibration slope 1 1 1 1
CI: confidence interval
*p<0.001 for pathologic nodal staging score versus other models.
Discrimination
Of models, pNSS had the highest bootstrap-corrected predictive accuracy (area under the ROC curve, 0.776; 95% confidence interval, 0.729–0.824). The bootstrap-corrected accuracies of other models were<60% (Table 3). The area under the ROC curve between pNSS and other
models were statistically significant different (p<0.001).
Calibration
In all models, calibration was on average correct (calibration-in-the-large coefficient = zero), and the effects of predictors were also on average correct in the new setting (calibration slope = 1) (Table 3). However, the calibration plots inFig 1demonstrated an underestimation of LN metastases. Even the calibration curve of pNSS did not perfectly match the line of iden-tity (the line at a 45° angle) although the deviation was pictorially minimal.
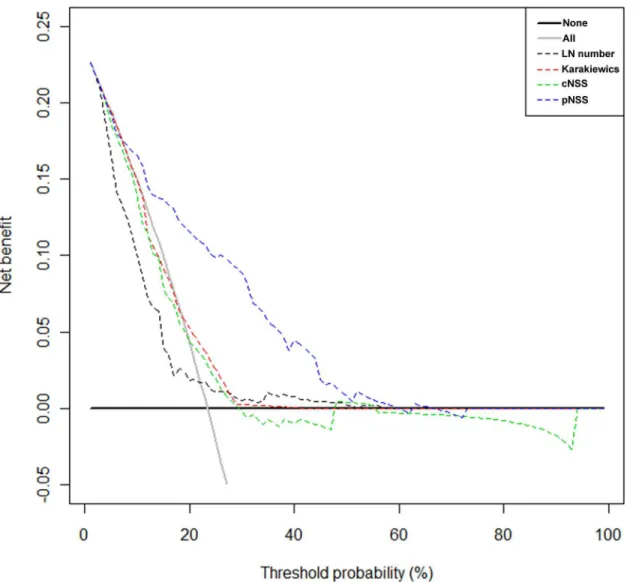
Clinical usefulness
Fig 2presents the results of the DCA. pNSS performed better than other models across a wide range of threshold probabilities.
Discussion
Nodal status is a powerful predictor of bladder cancer recurrence and survival after radical cystectomy [16,17]. The rate of LN metastasis increases from a low of 5–10% in non-muscle
Fig 1. Calibration plots.(A) Number of lymph nodes removed. (B) Karakiewicz nomogram. (C) Clinical nodal staging score. (D) Pathologic nodal staging score.
invasive bladder tumors (pT1) to 15–20% in superficial muscle invasive tumors (pT2a), to 25–30% in deep muscle invasive tumors (pT2b), and to>40% in extravesical tumors (pT3-4)
[4,16,18,19]. The probability of missing a positive LN may decrease with increasing number of LNs retrieved. Conversely, if a patient is LN-negative after only a few nodes have been exam-ined, the likelihood of understanding is nontrivial. However, generally, the extent of lymphade-nectomy is performed based on the surgeon’s intuitive experience integrating his beliefs and patient factors such as health status and tumor features [5]. Furthermore, although researchers have tried to identify the minimum necessary number of LNs needed to be removed at radical cystectomy, no minimum number of LNs can be determined [20].
In an effort to reduce staging errors, many experts have developed the models predicting true nodal status (no false-negative LN status) in bladder cancer [4–6]. The Karakiewicz nomo-gram represents the first attempt at defining objective, systematic, standardized, multivariate models capable of providing individual pN stage predictions [4]. cNSS is a simple probabilistic model to predict the number of LNs needed to be removed as a function of clinical stage [5]. Fig 2. Decision curve analysis.Decision curve analysis. LN number = number of lymph nodes removed. Karkiewics = Karakiewicz nomogram. cNSS = clinical nodal staging score. pNSS = pathologic nodal staging score.
pNSS is a simple probabilistic model that calculates the probability of freedom from missed LN metastasis as a function of pathologic tumor stage and LVI [6].
To introduce these predictive tools into the daily patient care in different continents, they must be externally validated in a variety of data sets, since external validation represents the gold standard for assessing the ability of staging tools to discriminate between those with and without the end point of interest. Karakiewicz nomograms failed to retain favorable discrimi-nation ability in a European series because LN involvement was underestimated in an external dataset [21]. May et al. [21] applied the Karakiewicz nomogram in 2,477 German patients. The authors found that the Karakiewicz nomogram for LN metastasis underestimated the incidence of LN metastasis (54.5% accuracy). Even in the original paper, the maximum accuracy of the Karakiewicz nomogram for pN+ predictions was 63.3%, which implies that 36.7% of patients would still be misclassified [4].
Gierth et al. [22] assessed 2,483 patients in eight German tertiary centers to validate cNSS and pNSS. The validation of cNSS and pNSS was performed using a beta-binomial model in the same manner as described previously [5,6]. The authors found that the external validation of both scores yielded LN number closely reflecting other results [5,6]. Our previous study results also support the view that cNSS is superior to the number of LNs removed in terms of its prognostic value in patients without LN metastasis [23]. When probability of missing posi-tive LN of<10% (cNSS 90%) was set, the accuracy of multivariate Cox regression model was
0.761 at 5 years. However, it remains unknown whether a correlation between a model and sur-vival reflects improved LN staging accuracy.
The aim of the present study was to externally validate predictive models for LN metastasis in a different cohort of patients who had undergone radical cystectomy. The applicability of models derived from cohorts in North America and Europe may be affected when transferred to Asian cohorts. Only pNSS performed adequately within this external cohort of patients, and this finding was consistent using different statistical means (i.e., overall performance, discrimi-nation, calibration, and clinical usefulness). In our study, discrepancy between clinical and pathologic stage was common in patients who undergo radical cystectomy; our findings indi-cate an agreement between the clinical and pathologic stage in 34.8% of patients. This discrep-ancy is also shown in other previous study [24] and may be the result of the retrospective collection of patient data. Studer and Sylvester [25] criticized the number of LNs defined suffi-cient by cNSS, since an important confounding and unquantifiable factor is the clinical staging error.
The limitations of the present study are inherent to any retrospective series. Lymphadenect-omy templates were not standardized. Although LN count is probably closely correlates with extent of dissection, it is not the ideal proxy for the extent of lymphadenectomy. In addition, the number of LNs may be different in any given individuals and dependent on pathologic evaluation. Moreover, in the present study, central pathology review was not performed. Therefore, there may be potential risks for inter-observer differences in final pathologic results. Conversely, our data reflects a real-world multicenter experience and pathologic examination was performed by genitourinary pathologists in major academic centers [5,6]. Performing an adequate lymphadenectomy with adherence to meticulous dissection of LNs may be more important than achieving a minimal LN count.
look-up table. Although a simple model like look-up table is easier to understand, it might have an inferior predictive accuracy compared with nomograms.
Conclusions
As there is a significant discrepancy between clinical and pathologic stage, current precystect-omy models based on clinical stage might not be applicable for prediction of LN metastasis. Our findings suggest that current precystectomy models for prediction of LN metastasis should be improved further. Conversely, our findings encourage the use of pNSS for prediction of LN metastasis of Asian patients.
Author Contributions
Conceived and designed the experiments: JHK HHK. Analyzed the data: MK SSB. Contributed reagents/materials/analysis tools: JHK SSB HJ CK HHK SEL. Wrote the paper: JHK MK HHK. Critical review: SSB HJ CK HHK SEL.
References
1. Kassouf W, Svatek RS, Shariat SF, Novara G, Lerner SP, Fradet Y, et al. (2013) Critical analysis and validation of lymph node density as prognostic variable in urothelial carcinoma of bladder. Urol Oncol 31:480–486. doi:10.1016/j.urolonc.2011.02.011PMID:21478035
2. Karl A, Carroll PR, Gschwend JE, Knüchel R, Montorsi F, Stief CG, et al. (2009) The impact of lympha-denectomy and lymph node metastasis on the outcomes of radical cystectomy for bladder cancer. Eur Urol 55:826–835. doi:10.1016/j.eururo.2009.01.004PMID:19150582
3. Feifer AH, Taylor JM, Tarin TV, Herr HW. (2011) Maximizing cure for muscle-invasive bladder cancer: integration of surgery and chemotherapy. Eur Urol 59:978–984. doi:10.1016/j.eururo.2011.01.014 PMID:21257257
4. Karakiewicz PI, Shariat SF, Palapattu GS, Perrotte P, Lotan Y, Rogers CG, et al. (2006) Precystectomy nomogram for prediction of advanced bladder cancer stage. Eur Urol 50:1254–1260. PMID:16831511
5. Shariat SF, Ehdaie B, Rink M, Cha EK, Svatek RS, Chromecki TF, et al. (2012) Clinical nodal staging scores for bladder cancer: a proposal for preoperative risk assessment. Eur Urol 61:237–242. doi:10. 1016/j.eururo.2011.10.011PMID:22033174
6. Shariat SF, Rink M, Ehdaie B, Xylinas E, Babjuk M, Merseburger AS, et al. (2013) Pathologic nodal staging score for bladder cancer: a decision tool for adjuvant therapy after radical cystectomy. Eur Urol 63:371–378. doi:10.1016/j.eururo.2012.06.008PMID:22727174
7. Sobin LH, Wittekind C. (2002) TNM Classification of Malignant Tumours. York: Wiley-Liss.
8. Mostofi FK. (1973) Histological typing of urinay bladder tumors. Geneva, Switzerland: World Health Organization
9. Nagelkerke N. (1991) A note on a general definition of the coefficient of determination. Biometrika 78:691–692.
10. Brier GW. (1950) Verification of forecasts expressed in terms of probability. Mon Wea Rev 78:1–3.
11. DeLong ER, DeLong DM, Clarke-Pearson DL. (1988) Comparing the areas under two or more corre-lated receiver operating characteristic curves: a nonparametric approach. Biometrics 44:837–845. PMID:3203132
12. Miller ME, Langefeld CD, Tierney WM, Hui SL, McDonald CJ. (1993) Validation of probabilistic predic-tions. Med Decis Making 13:49–58. PMID:8433637
13. Cox DR. (1958) Two further applications of a model for binary regression. Biometrika. 45:562–565.
14. Van Houwelingen JC, Le Cessie S. (1990) Predictive value of statistical models. Stat Med 9:1303– 1325. PMID:2277880
15. Vickers AJ, Elkin EB. (2006) Decision curve analysis: a novel method for evaluating prediction models. Med Decis Making 26:565–574. PMID:17099194
17. International Bladder Cancer Nomogram Consortium, Bochner BH, Kattan MW, Vora KC. (2006) Post-operative nomogram predicting risk of recurrence after radical cystectomy for bladder cancer. J Clin Oncol 24:3967–3972. PMID:16864855
18. Shariat SF, Karakiewicz PI, Palapattu GS, Amiel GE, Lotan Y, Rogers CG, et al. (2006) Nomograms provide improved accuracy for predicting survival after radical cystectomy. Clin Cancer Res 12:6663– 6676. PMID:17121885
19. Kassouf W, Agarwal PK, Herr HW, Munsell MF, Spiess PE, Brown GA, et al. (2008) Lymph node den-sity is superior to TNM nodal status in predicting disease-specific survival after radical cystectomy for bladder cancer: analysis of pooled data from MDACC and MSKCC. J Clin Oncol 26:121–126. doi:10. 1200/JCO.2007.12.9247PMID:18165646
20. Koppie TM, Vickers AJ, Vora K, Dalbagni G, Bochner BH. (2006) Standardization of pelvic lymphade-nectomy performed at radical cystectomy: can we establish a minimum number of lymph nodes that should be removed? Cancer 107:2368–2374. PMID:17041887
21. May M, Burger M, Brookman-May S, Otto W, Peter J, Rud O, et al. (2011) Validation of pre-cystectomy nomograms for the prediction of locally advanced urothelial bladder cancer in a multicentre study: are we able to adequately predict locally advanced tumour stages before surgery? Urologe A 50:706–713. PMID:21340594
22. Gierth M, Fritsche HM, Buchner H, May M, Aziz A, Otto W, et al. (2013) Clinical and pathological nodal staging score for urothelial carcinoma of the bladder: an external validation. World J Urol doi:10.1007/ s00345-013-1105-4
23. Ku JH, Kim HH, Kwak C. (2012) Nodal staging score: A tool for survival prediction of node-negative bladder cancer. Urol Oncol doi:10.1016/j.urolonc.2012.06.012
24. Ficarra V, Dalpiaz O, Alrabi N, Novara G, Galfano A, Artibani W. (2005) Correlation between clinical and pathological staging in a series of radical cystectomies for bladder carcinoma. BJU Int 95:786– 790. PMID:15794783