Volume VIII Number 4, 2016
Influence of Qualitative Factors on Quantitative Determinants
in the Czech Meat Industry Economy
Z. Náglová1, T. Horáková2
1 Department of Economics, Faculty of Economics and Management, Czech University of Life Sciences
Prague, Prague, Czech Republic
2 Department of Systems Engineering, Faculty of Economics and Management, Czech University of Life
Sciences Prague, Prague, Czech Republic
Abstract
The meat industry is one of the key sectors within the food industry in the Czech Republic. Development,
especially in the pork production, is unfavourable. Negative foreign trade balance and low self-suficiency
is reported. Czech market products compete with foreign imports of meat and economic performance
of enterprises plays an important role in this ield. Article aims to identify qualitative factors limiting
the competitiveness of the meat industry and to identify groups of enterprises with key position. The size
of a company was conirmed as an only factor limiting the competitiveness. Statistically signiicant
differences among the three performance indicators (out of the four analysed) were demonstrated. The larger the enterprise, the greater values of indicators are. Form of company ownership, drawing subsidies and region
of the company cannot be conirmed as factors inluencing the economic performance and competitiveness.
Keywords
Meat industry, competitiveness, economic performance, cluster analysis, food processing industry, economy of enterprises.
Náglová, Z. and Horáková, T. (2016) “Inluence of Qualitative Factors on Quantitative Determinants
in the Czech Meat Industry Economy ", AGRIS on-line Papers in Economics and Informatics, Vol. 8, No. 4, pp. 111 - 123. ISSN 1804-1930. DOI 10.7160/aol.2016.080410.
Introduction
The meat industry belongs to food processing industry, which is one of the most important sectors in the whole EU as well as in Member States with high importance for economic and environmental development but also for social welfare (Bigliardi and Galati, 2013). Food processing industry plays an important role as an employer, but it is also important for its economic outcomes. It is the base for the competitiveness of the agricultural market in each EU country. Its important role arises from the processing of agricultural raw materials and the food supply for population (Menrad, 2004).
Economic research focuses more on the area of the Czech food industry as a complex
rather than on its individual processing ields. For example, Putićová and Mezera (2008) dealt
with this issue. They analysed the development of the food processing industry and the trends in economic indicators in comparison with the entire manufacturing industry. The authors stated that
the entire manufacturing industry is developing dynamically. However, the importance of the food industry decreases over the time. Differentiated and
luctuating trends are seen in individual production ields (in number of employees, sales, value added),
on the other hand the labour productivity grew
for the period 2000-2006. According to Mejstříková
et al. (2011), the food industry is a major area
of the agrarian sector and its inancial-economic
results affect the development of agriculture and other related subjects. The authors analyzed the positives and negatives of economic performance in food processing business. The results show
an intersectoral heterogeneity of proitability. Čechura and Hockmann (2010) also analysed the Czech market. They identiied the uneven
development of the food processing industry. Results indicate serious problems including problems in the capital market. According to research of Hockmann et al. (2013) the key determinants of competitiveness in the food industry are: changing consumer preferences
foods and the changing purchasing power of the population on one hand; progressive trade liberalization creating new competitive environment accompanied by structural changes in the food industry on the other hand. The meat industry is among the key sectors of the food industry both in the EU and the Czech Republic.
The study Food Drink Europe (2015) summarizes the basic economic performance of the food industry in the EU. The meat industry represents 14% of the food and drink industries of the EU which makes it the second highest number of enterprises after the bakery industry (54% of enterprises). The sector employs 21% of employees in the food industry (the second highest number of people). It contributes by 15% (which is the fourth highest part) to the value added of food industry and has a turnover of 20% (the highest portion). However, labour productivity is very low, it is below average of food and beverage industry, ie. 33 000 EUR/ person (the second lowest labour productivity).
A publication Panorama of Food Industry (MoA, 2015) is dedicated to the problems of the food processing industry in the Czech Republic. According to this publication, the meat industry reached 22.9% of total revenues from the sales of own products and services
of food industry in 2014. In this ield there
is the fourth highest number of companies (i.e. 23.8%), which employ 24.4% of the entire food industry. The food industry contributed with 17.4% to the value added of food processing industry in 2014, ie. the third highest part. Problematic area of the meat industry is a long-term decline
in the number of employees in this ield (in 2014
the company employed 21 051 persons); as well as low labour productivity (484 000 CZK) and a low average wage per month of employees. In the long term the lack of competitiveness in the pork production is reported, especially the negative foreign trade balance. Decrease in the number of pigs and sows as well as low
self-suficiency, especially in pig and poultry meat
are among the greatest challenges of livestock production in the Czech Republic. The declining
self-suficiency is involved in increasing pork
imports that compete with domestic supply
and thus inluence the proitability of the sector.
According to the above stated data the situation of meat processors does not develop very favourably. For this reason, the economic performance of enterprises plays an increasingly important role
in this ield, and identiies competitive position
of those companies on the Czech market.
This article aims to identify qualitative factors
limiting the competitiveness of the meat industry enterprises measured by their economic
performance. Partial goals are to ind statistically signiicant differences in the selected indicators and in qualitative factors; to perform cluster
analysis and to identify groups of companies with
similar characteristics on the market. To ind a group
of companies that can be considered as endangered or their position is crucial and to identify factors affecting their market position will be found as a synthesis of partial goals in this article.
Materials and methods
Data and variables
The primary source for a database of enterprises of the meat industry was a database of companies and institutions Albertina, managed by Bisnode company. This database provides individual data
from inancial statements (balance sheet and proit
and loss statement) of businesses. The selection of companies was carried out according
to the CZ-NACE businesses (ie. the classiication
of economic activities). This means that companies
engaged in the production ield 10.1 Processing
and preserving of meat and meat products (just as the predominant activity) were selected. A total of 233 enterprises were subject to evaluation in 2014.
Accounting data as added value, production consumption, revenues from sales of own products and services, assets, EBIT and additional indicator of the number of employees (all data for 2014) from the Database Albertina were used
for a purpose of this article. Four inancial evaluation
indicators, respectively economic analysis were
set based on this data. The indicators relect
internal and external business environment and can be considered to be the basic representatives of company competitiveness measured by their performance. Evaluation of competitiveness based
on inancial indicators was done, for example
by authors Liargovas and Skandalis (2010), Habib (2006), Meric et al. (2011). This includes
the following quantitative indicators:
- Labour Productivity: a representative
of business performance that relects the economic level of enterprise and eficiency
of employee utilization (Kislingerová et al., 2008). Labour productivity was determined as the converted value added per employee. - Revenues: It is an item of proit
of own products. The indicator was ranked as a representative of a production created by a company.
- Production Consumption: an indicator representing the key cost item of the operating area of the company. It is
a unit proit and loss statement- Production
consumption, which includes the cost of materials, services and energy.
- Return on assets (ROA) is calculated
as the ratio of proit before interest
and taxes, and the total amount of assets. As an indicator for measuring competitiveness was ROA used for example by Tangen (2003) and Berman et al. (1999).
Qualitative factors limiting companies' performance
Latruffe (2010) speciies determinants
of competitiveness of the agricultural and agri- food sector and divides them into two groups.
The irst are the determinants controllable
by the company, ie. size and other structural characteristics (legal form, intensity of factor use; indebtedness; specialization of business), social capital (age of the entrepreneurs, education, gender, etc.). Determinants, that are not controllable
by the company, ie. equipped by factors (sources
of labour, land and capital) and conditions of demand; government restrictions in the agricultural sector; public expenses for research and infrastructure; location of activities.
Determinants forming the competitiveness of the agri-food sector have been set with respect to the data availability. Meat industry businesses were divided and analysed according to selected
qualitative characteristics, ie. according to their
size, form of ownership, using grants and regions.
These are the factors that have been identiied
as factors limiting the competitiveness of meat
companies measured by inancial and economic
indicators.
Businesses were classiied into four groups
according to the size, ie. the micro, small, medium and large businesses. The primary criterion
for classiication was the number of employees.
Micro-enterprise is an enterprise which employs 0-9 employees; small enterprise employs 10-49 employees, medium companies are with 50-249 employees, and large enterprise has more than 250 employees. Czech Statistical
Ofice commonly use this criterion. Widely used
is also criterion based on the Recommendation 2003/361/ES) which use also turnover and annual
balance sheet. The authors are aware of possible different results when choosing this indicator
in point of view to the deinition of size of company.
Information about the number of employees was obtained from the database of companies and institutions Albertina. In case of missing data for some enterprises, the information was searched at justice.cz in a section of annual reports. Overall 102 micro enterprises, 82 small companies, 34 medium and 15 large enterprises were analysed.
According to the forms of companies' ownership, the meat industry is divided into the following categories: individual ownership (in this category
there are irms owned by one person); family
ownership (incorporated businesses with owners of the same name); other ownership (company owned by various people) and foreign ownership (enterprises with owners of foreign origin with an ownership greater than 50%). Information
about the ownership of individual irms was
obtained from the Arachné database, managed by the company Bisnode, which focuses
on ownership in companies. Their own classiication
of property into the above groups was carried out based on the data. A total of 67 individually owned companies, 69 family owned enterprises, 91 enterprises of other ownership and 6 foreign companies were analyzed.
The penultimate qualitative criterion was subsidy
drawing. Meat industry businesses are part of the processing industry and therefore they
have the opportunity to beneit from the Rural
Development Programme support. i.e. 1. 3. 1 Adding value to agricultural and food products (valid for RDP 2007-2013). Based on this factor, the enterprises have been divided into three groups,
i.e. companies which beneited from a subsidy
(enterprises that applied for a grant in 2012-2014, were supported and their applications for aid have been paid); businesses that did not draw subsidies (businesses did not apply for the support within that time period) and businesses that applied for a grant, but did not receive it, thus were not supported. Information on drawn subsidies of the meat industry enterprises was obtained from the Registry of grant recipients, managed by the Ministry of Agriculture. In the evaluation there were 40 supported companies, 167 businesses that did not receive subsidies and 26 companies that have failed in obtaining a grant and were not supported.
Frequencies of enterprises in individual regions
will be shown in the tables of basic descriptive characteristics.
Qualitative variables with greater than 75% statistically signiicant effect on quantitative
indicators were evaluated as a factor affecting competitiveness.
Database Albertina provides accounting data for 316 companies in manufacturing sector 10.1 Processing and preserving of meat and meat products in a time period from 2010 to 2015. Data for 2015 are not complete; it is only listed for minimum companies therefore the year 2014 was evaluated. Data was gathered from 233 companies that year. Thus the article analyses 73.7% of companies with available accounting data.
Statistical analysis
At irst, the basic descriptive characteristics - some
measures of location and variability, such as mean,
95% lower and upper conidence interval of mean,
median and standard deviation - were calculated for individual enterprises of Processing and preserving of meat and meat products (CZ-NACE 10.1) industry. Furthermore,
the relative and absolute frequencies were evaluated, i.e. frequency tables for various economic indicators based on qualitative factors
were made (Brase and Brase, 2016).
Then, statistical differences of the impact of factor
(the individual categories of mentioned qualitative
variables) per average levels of monitored economic indicators were observed using one-way analysis of variance (one-way ANOVA). The ANOVA is a standard used tool (Rossi and Mirtchev, 2016). The null hypothesis is that the average values of the given economic indicator are the same
for all observed groups classiied by the given
factor. An alternative hypothesis is that at least one of the monitored groups differs with its average from other average values. Analysis of variance is based on the F test. Output of F test is p-value,
which is compared with the signiicance level α = 0.05. If p < α, then we reject the null hypothesis (Baguley, 2012). Within ANOVA
there is sometimes performed so-called multiple comparison using a post-hoc tests (Cardinal and Aitken, 2013) however, it is not covered in the paper.
Furthermore, cluster analysis was used,
speciically Hierarchical Cluster Analysis, tracking
the similarity of enterprises' behaviour on the basis of monitored economic indicators as authors
(Santis et al., 2016) use it. The paper uses Ward's
method as a Cluster Method with chosen measure
Squared Euclidean Distance (Rasmussen, 1992).
The output of cluster analysis is a graphical representation of clusters using dendrogram (Bennani and Benabdeslem, 2006).
Results and discussion
The results are organized according the examined
qualitative factors that have been identiied
as possible factors affecting competitiveness
(deined by selected quantitative indicators)
of the meat industry enterprises. Basic descriptive statistics are always listed (mean, 95% lower
and upper conidence interval of mean, median,
standard deviation), including statistical
signiicance of inluence of qualitative variables on inancial-economic indicator (p-value).
Size of business
Size of the company was the irst examined factor,
respectively its impact on the performance indicators shown in Table 1. Average labour productivity is the lowest in micro enterprises, highest in large enterprises. The larger the enterprise, the greater is its average labour productivity. However, the productivity grows more slowly with increasing size (in the case of medium and large enterprises it
is very similar). Wide range of values (minimum
and maximum) is evident for micro and small enterprises, which is primarily due to the nature
of enterprises, i.e. family irms with a small
number of employees, which increase the value
of this indicator. Testing statistically signiicant
differences in this indicator by size category proved
to be signiicant (p-value).
Average revenues of micro and small enterprises are at closely comparable level. In the case of micro enterprises they are even slightly higher. On the other hand, the difference between revenues of medium
and large enterprises is signiicant (large companies
have in average higher revenues by more than
1 mil. CZK). Values of indicators differ signiicantly
across the size categories. In connection with this indicator, a linear development of pivotal cost indicator was proved, ie. production consumption
has shown where its value differ signiicantly
among other companies. However, there is no reduction in the consumption of materials, energy and services as the business grows.
Micro and small enterprises reported a negative
ROA in 2014 due to the negative proit. Proitability
of medium and large enterprises is low, while
the values of this indicator do not differ signiicantly
in individual size categories of meat enterprises.
The size of the business can be considered as a factor limiting the competitiveness of enterprises
of the meat industry. Statistically signiicant
differences among the three performance indicators (out of the four analyzed) were demonstrated.
Whereby it was conirmed that larger businesses
show a better performance characteristics
as conirmed for example by Carroll et al.
(2009), Zhu et al. (2008), Latruffe et al. (2004). Therefore it can be agreed with the statement that
large irms achieve economies of scale and can beneit from preferential access to the market
of inputs and outputs (Hall and LeVeen, 1978). On the contrary, an inverse relationship between the size of the business and its productivity was proved by Munroe (2001) or O'Neill and Matthews (2001). According to Buckwell and Davidova (1993) the explanation for this relationship is that small businesses are not affected by the need to control labour or organizational problems and the family workforce is highly motivated
to beneit from their own business.
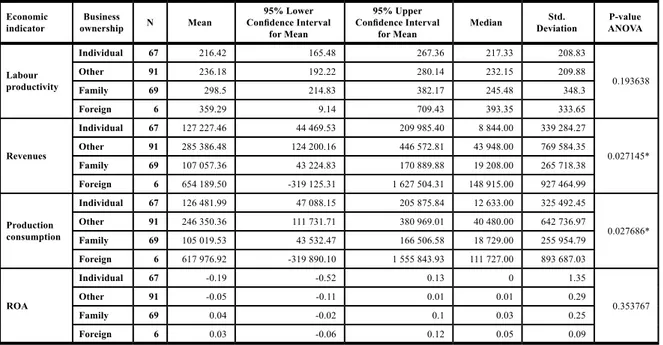
Business ownership
Effect of ownership on the economic results of meat enterprises is documented in Table 2. Individual
business or small family irms may be associated
with certain traditions and craft activities, so there is an obvious lower labour productivity than in foreign-owned enterprises of the meat industry.
On the other hand, the age of the owner may be the reason for the low productivity. Older owners may not be willing or able to accept the possibility of technological innovation (Lambarraa, 2009). On the other hand, older owners can use their
experience and knowledge for more eficient use
of inputs (Munroe, 2001; Mathijs et al., 2001). This indicator is not statistically different among the categories of enterprise.
Statistically signiicant differences were conirmed
for the indicators of revenues and production consumption. Family businesses report the lowest revenues; foreign-owned businesses report the highest. The average return on assets was negative for individually owned and other enterprises in 2014. The highest ROA was in family
businesses, which is conirmed by the results
of Buckwell and Davidova (1993) who claim that family businesses are very motivated to prosper.
Indicator is not statistically signiicantly different
according to business ownership. Similar results ie. no effect on the return on assets, respectively
return on sales, in the food business are conirmed
by Schiefer and Hartmann (2008).
According to the results foreign-owned enterprises may be the best performing group, because they have the highest values of the evaluated indicators. The position of other categories of enterprises
is not clear, which was conirmed by the authors
Davidova and Gorton (2004), whose results indicate no clear superiority of performance either in family
Economic indicator
Size
of business N Mean
95% Lower Conidence Interval
for Mean
95% Upper Conidence Interval
for Mean
Median Std. Deviation
P-value ANOVA
Labour productivity
Micro 102 165.62 104.66 226.59 0 308.84
0.000029*
Small 82 286.83 241.46 332.21 247.54 206.51
Medium 34 370.03 312.89 427.17 337.75 163.75
Large 15 378.62 275.48 481.76 317.02 186.24
Revenues
Micro 102 65 853.35 -29 368.73 161 075.42 787.00 482 350.69
<0.000001* Small 82 62 978.88 43 601.12 82 356.64 30 099.75 88 191.32
Medium 34 355 068.12 265 299.36 444 836.88 273 751.00 257 278.64
Large 15 1 442 223.07 799 576.48 2 084 869.66 1 495 991.00 1 160 469.50
Production consumption
Micro 102 56 041.90 -21 547.74 133 631.53 1 635.00 393 032.95
<0.000001* Small 82 59 813.47 41 977.43 77 649.51 33 727.75 81 174.71
Medium 34 313 091.75 229 436.49 396 747.01 219 945.50 239 757.26
Large 15 1 359 331.97 841 204.89 1 877 459.05 1 383 939.00 935 616.38
ROA
Micro 102 -0.14 -0.36 0.08 0 1.11
0.620629
Small 82 -0.02 -0.09 0.05 0.02 0.32
Medium 34 0.01 -0.03 0.05 0.04 0.12
Large 15 0.02 -0.01 0.06 0.03 0.06
Note: * Statistically signiicance of inluence of company size on economic indicators (testing on level of signiicance α=0.05). All
indicators are in thousands CZK, ROA in CZK. Source: own processing
businesses or other types of businesses.
Form of company ownership according to testing
the signiicance of differences cannot be
considered as a factor limiting the competitiveness of enterprises of the meat industry.
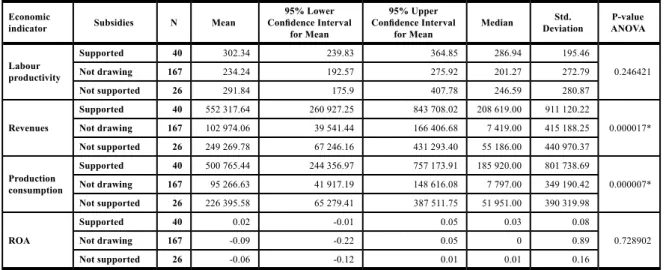
Subsidies
In Table 3 there is a difference in performance indicators when dividing enterprises according to the use of grant resources. The lowest labour
productivity is reported by irms that did not
apply for support. Average labour productivity of businesses that have been supported is higher
than labour productivity of irms that did not receive support (ie. eventually they had to inance
the investment by themselves). However, the labour
productivity does not differ signiicantly which was conirmed by testing statistically signiicant
difference by p-value. The impact of subsidies can be assessed as positive since supported businesses have higher labour productivity. Similarly, it
is conirmed in the Czech agri-food by Špička
and Krause (2013), Medonos et al. (2012).
Supported businesses also have the highest revenues. However, in case of production consumption they do not achieve economies of scale and value of this indicator is also the highest. Both revenues
and the production consumption differ signiicantly
among categories. The positive impact
of the subsidy was conirmed for example
by Bernini and Pellegrini (2011), Del Monte
and Papagni (2003) or Skuras et al. (2006), the negative impact by Criscuolo et al. (2009) and Harris and Trainor (2005). Supported enterprises showed a positive return on assets in 2014. Enterprises that drawn subsidy or were not
supported had a negative ROA. It was not conirmed that this is a statistically signiicant difference. According to the results it cannot be conirmed that subsidies are among factors that would signiicantly
contribute to increasing the competitiveness
of irms on the market (as measured by performance
indicators).
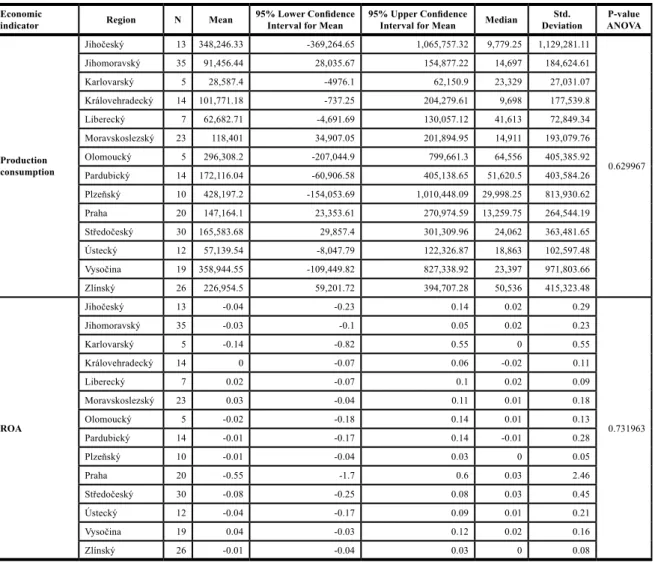
Region
Another possible factor determining the competitiveness of companies can be explained by their locational characteristics. Therefore the last tested factor was a region, respectively location of meat enterprise and its effect on performance. Thus it is a factor over which the companies have no control. Location of enterprises may be associated with a different climate and soil
quality in the case of primary production enterprises.
In the case of processing enterprises, it may be more of a market infrastructure. Basic descriptive characteristics are apparent in Table 4. Statistically
signiicant effect of the region on individual
performance indicators was not a single case. Location of the enterprise cannot be considered as a factor that would affect the competitiveness of the meat industry.
Economic indicator
Business
ownership N Mean
95% Lower Conidence Interval
for Mean
95% Upper Conidence Interval
for Mean
Median Std. Deviation
P-value ANOVA
Labour productivity
Individual 67 216.42 165.48 267.36 217.33 208.83
0.193638
Other 91 236.18 192.22 280.14 232.15 209.88
Family 69 298.5 214.83 382.17 245.48 348.3
Foreign 6 359.29 9.14 709.43 393.35 333.65
Revenues
Individual 67 127 227.46 44 469.53 209 985.40 8 844.00 339 284.27
0.027145*
Other 91 285 386.48 124 200.16 446 572.81 43 948.00 769 584.35
Family 69 107 057.36 43 224.83 170 889.88 19 208.00 265 718.38
Foreign 6 654 189.50 -319 125.31 1 627 504.31 148 915.00 927 464.99
Production consumption
Individual 67 126 481.99 47 088.15 205 875.84 12 633.00 325 492.45
0.027686*
Other 91 246 350.36 111 731.71 380 969.01 40 480.00 642 736.97
Family 69 105 019.53 43 532.47 166 506.58 18 729.00 255 954.79
Foreign 6 617 976.92 -319 890.10 1 555 843.93 111 727.00 893 687.03
ROA
Individual 67 -0.19 -0.52 0.13 0 1.35
0.353767
Other 91 -0.05 -0.11 0.01 0.01 0.29
Family 69 0.04 -0.02 0.1 0.03 0.25
Foreign 6 0.03 -0.06 0.12 0.05 0.09
Note: * Statistically signiicance of inluence of company size on economic indicators (testing on level of signiicance α=0.05). All
indicators are in thousands CZK, ROA in CZK. Source: own processing
Economic
indicator Subsidies N Mean
95% Lower Conidence Interval
for Mean
95% Upper Conidence Interval
for Mean
Median Std. Deviation
P-value ANOVA
Labour productivity
Supported 40 302.34 239.83 364.85 286.94 195.46
0.246421
Not drawing 167 234.24 192.57 275.92 201.27 272.79
Not supported 26 291.84 175.9 407.78 246.59 280.87
Revenues
Supported 40 552 317.64 260 927.25 843 708.02 208 619.00 911 120.22
0.000017*
Not drawing 167 102 974.06 39 541.44 166 406.68 7 419.00 415 188.25
Not supported 26 249 269.78 67 246.16 431 293.40 55 186.00 440 970.37
Production consumption
Supported 40 500 765.44 244 356.97 757 173.91 185 920.00 801 738.69
0.000007*
Not drawing 167 95 266.63 41 917.19 148 616.08 7 797.00 349 190.42
Not supported 26 226 395.58 65 279.41 387 511.75 51 951.00 390 319.98
ROA
Supported 40 0.02 -0.01 0.05 0.03 0.08
0.728902
Not drawing 167 -0.09 -0.22 0.05 0 0.89
Not supported 26 -0.06 -0.12 0.01 0.01 0.16
Note: * Statistically signiicance of inluence of company size on economic indicators (testing on level of signiicance α=0.05). All
indicators are in thousands CZK, ROA in CZK. Source: own processing
Table 3: Descriptive statistics and one-way ANOVA for factor „Subsidies“, year 2014.
Economic
indicator Region N Mean
95% Lower Conidence Interval for Mean
95% Upper Conidence Interval for Mean Median
Std. Deviation
P-value ANOVA
Labour productivity
Jihočeský 13 174.17 69.48 278.87 187.27 164.78
0.410302
Jihomoravský 35 231.98 140.31 323.65 210.71 266.85
Karlovarský 5 61.28 -46.57 169.13 0 86.86
Královehradecký 14 186.24 86.09 286.39 189.51 173.45
Liberecký 7 205.93 0.43 411.42 193.33 222.19
Moravskoslezský 23 271.78 135.83 407.74 232.7 314.4
Olomoucký 5 196 -38 430.01 191.74 188.46
Pardubický 14 296.07 182.57 409.56 255.76 196.57
Plzeňský 10 309.62 122.24 496.99 332.47 261.93
Praha 20 386.03 151.99 620.07 222.9 500.07
Středočeský 30 241.02 160.87 321.18 245.35 214.66
Ústecký 12 169.08 66.98 271.18 181.82 160.69
Vysočina 19 307.69 208.9 406.49 291 204.98
Zlínský 26 255.59 175.02 336.17 237.84 199.48
Revenues
Jihočeský 13 424,958.17 -457,665.92 1,307,582.26 7134.5 1,389,150.45
0.61708
Jihomoravský 35 97,295.61 29,680.49 164,910.74 6,640 196,834.81
Karlovarský 5 31,333.4 -5,609.32 68,276.12 26,103 29,752.59
Královehradecký 14 108,493.25 119.24 216,867.26 13,252.5 187,698.71
Liberecký 7 70,592.29 -12,030.85 153,215.43 48,215 89,337.21
Moravskoslezský 23 106,896.13 34,120.74 179,671.52 16,741 168,293.09
Olomoucký 5 205,299.8 -103,781.62 514,381.22 78,141 248,925.17
Pardubický 14 184,567.21 -60,314.4 429,448.83 64,467 424,123.49
Plzeňský 10 455,324.45 -150,988.67 1,061,637.57 34,106.75 847,567.3 Praha 20 171,577.05 30,405.2 312,748.9 22,134.25 301,639.96
Středočeský 30 191,129.7 33,106.79 349,152.61 28,542.25 423,193.13
Ústecký 12 56,677.5 -13,239.88 126,594.88 20,384.5 110,042.04
Vysočina 19 420,495.63 -133,735.25 974,726.52 26,917 1,149,893.41
Zlínský 26 245,741.56 61,181.49 430,301.62 50,240.5 456,935.06
Note: * Statistically signiicance of inluence of company size on economic indicators (testing on level of signiicance α=0.05). All
indicators are in thousands CZK, ROA in CZK. Source: own processing
Cluster analysis
Another objective was to ind a group of meat
industry companies that perform similar market behaviour and thus to identify groups of companies that can be considered endangered, or they have a key position on the market. Enterprises have
been classiied into four clusters. Because
of the extent there is no dendrogram in the article but only a verbal description. More detailed results of the cluster analysis are therefore available
on request from the authors of the article.
There were 7 companies grouped in the irst cluster.
There were only large enterprises. Five of them have drawn subsidies and those were mainly from the group with other ownership (company owned by various people). According to previous analysis we can suggests a strong position of this group on a market, which also pose a potential threat for other groups with regard to the fact that
large companies have shown the best performance characteristics. It was also shown that companies which have drawn subsidy achieve higher sales than unsupported businesses.
The second cluster includes only two large companies whose economical results have surpassed other businesses. Companies have a corporate owner and because of their economical results they are key players on the market.
The third cluster includes 25 companies. These are mainly enterprises with other ownership (56%), which are medium size (60% of enterprises) and 44% of them did not draw subsidies. Medium-sized businesses get closer to large enterprises with their results. Size is a factor limiting the competitiveness on the Czech market and that is why this group has the potential to develop its opportunity to compete with the previous two clusters.
Economic
indicator Region N Mean
95% Lower Conidence Interval for Mean
95% Upper Conidence Interval for Mean Median
Std. Deviation
P-value ANOVA
Production consumption
Jihočeský 13 348,246.33 -369,264.65 1,065,757.32 9,779.25 1,129,281.11
0.629967
Jihomoravský 35 91,456.44 28,035.67 154,877.22 14,697 184,624.61
Karlovarský 5 28,587.4 -4976.1 62,150.9 23,329 27,031.07
Královehradecký 14 101,771.18 -737.25 204,279.61 9,698 177,539.8
Liberecký 7 62,682.71 -4,691.69 130,057.12 41,613 72,849.34
Moravskoslezský 23 118,401 34,907.05 201,894.95 14,911 193,079.76
Olomoucký 5 296,308.2 -207,044.9 799,661.3 64,556 405,385.92
Pardubický 14 172,116.04 -60,906.58 405,138.65 51,620.5 403,584.26
Plzeňský 10 428,197.2 -154,053.69 1,010,448.09 29,998.25 813,930.62 Praha 20 147,164.1 23,353.61 270,974.59 13,259.75 264,544.19
Středočeský 30 165,583.68 29,857.4 301,309.96 24,062 363,481.65
Ústecký 12 57,139.54 -8,047.79 122,326.87 18,863 102,597.48
Vysočina 19 358,944.55 -109,449.82 827,338.92 23,397 971,803.66
Zlínský 26 226,954.5 59,201.72 394,707.28 50,536 415,323.48
ROA
Jihočeský 13 -0.04 -0.23 0.14 0.02 0.29
0.731963
Jihomoravský 35 -0.03 -0.1 0.05 0.02 0.23
Karlovarský 5 -0.14 -0.82 0.55 0 0.55
Královehradecký 14 0 -0.07 0.06 -0.02 0.11
Liberecký 7 0.02 -0.07 0.1 0.02 0.09
Moravskoslezský 23 0.03 -0.04 0.11 0.01 0.18
Olomoucký 5 -0.02 -0.18 0.14 0.01 0.13
Pardubický 14 -0.01 -0.17 0.14 -0.01 0.28
Plzeňský 10 -0.01 -0.04 0.03 0 0.05
Praha 20 -0.55 -1.7 0.6 0.03 2.46
Středočeský 30 -0.08 -0.25 0.08 0.03 0.45
Ústecký 12 -0.04 -0.17 0.09 0.01 0.21
Vysočina 19 0.04 -0.03 0.12 0.02 0.16
Zlínský 26 -0.01 -0.04 0.03 0 0.08
Note: * Statistically signiicance of inluence of company size on economic indicators (testing on level of signiicance α=0.05). All
indicators are in thousands CZK, ROA in CZK. Source: own processing
The last largest cluster is a group of 199 enterprises made up by 36% of businesses owned by various persons, and 32% of family businesses. These are mainly small and micro enterprises (total 89% of enterprises), which did not apply for support (77% of enterprises). Micro and small enterprises performed the lowest values of indicators as well as the unsupported businesses. The position of these enterprises on the Czech market may be endangered to a certain level. Since these are small sized businesses, we can assume that their philosophy (ideas about visions and goals) is totally different than in the case of large enterprises. Small businesses can face their production to local customers and compete with other local processors. Especially because of the form of sales
and the access to speciic markets they have
the advantage that large companies are missing and might not even be interested in these markets (preference of sold amount).
Conclusion
The main aim of the article was to identify
qualitative factors that limit the competitiveness
of enterprises of the meat industry on the Czech market. Size of the company, ownership, use of support and region were considered. It was
conirmed that better performance characteristics
are shown by large enterprises. Differences
among the companies were signiicantly different
so the size of a company can be stated as a factor limiting competitiveness. Foreign -owned enterprises can be evaluated as the most powerful according to the business ownership.
These differences were statistically signiicantly
different only in indicators of revenues and production consumption. Therefore competitiveness is not determined by the form
of ownership. It was conirmed that the enterprises
which were supported by grants tend to have improved performance indicators. Statistically
signiicant differences were conirmed only
for revenues and production consumption.
Therefore it cannot be conirmed that subsidies are
among factors that would contribute to increase the competitiveness of enterprises, as well
as a location of company (statistically signiicant
differences in indicators did not show in any single case).
Four groups of companies that exhibit similar characteristics operating on the Czech market were
identiied according to cluster analysis. Two key groups of players on the market were identiied
from these clusters. This is a group of large
companies that exhibit superior performance characteristics and are a potential threat for other groups on the market. The potential for the development or being a competition to these groups have businesses of the third cluster (consisting primarily of medium-sized companies that exhibit values very close to large enterprises). The largest group is the cluster formed by micro and small enterprises which did not apply for support. Their position on the market can
be inluenced by other clusters to some degree.
However, these companies might have different goals than large businesses and focus more on local consumers.
Where were used various approaches to analyse
economic situation in meat industry. It is hard to compare the same problematic as in this paper.
Mijic et al. (2014) used wide portfolio of inancial
analysis indicators to evaluate meat industry. They
indicated the low return on investment, proitability, liquidity, and high debt of the companies
in the meat industry in Serbia. The companies in the meat-processing industry had better performance than livestock producers and this
difference is statistically signiicant. With these
authors we can compare ROA, which was 11.08% in 2012, in our sample of processing companies was much lower (depends on company´s type). Martin et al. (2015) used to evaluate the economic
and inancial health of the meat industry companies, by inancial ratios Price to earnings ratio, proit margin, debt to equity, and return on equity.
The ratios were compared to the ratios of the top 15
industries. For three of the four key inancial ratios that were tested, meat industry irms on average performed signiicantly weaker than the top 15 industries. Debt to equity ratio showed the meat irms to be about the same as the top 15 industries. Financially and economically, the meat irms were not as strong as the average irm in the top 15
industries.
Wijnands et al. (2007) dealt with competitiveness
for consolidation will be a key issue in the meat industry mergers to achieve economies of scale.
Only bigger companies with an adequate scale
can exploit the opportunity to cater for the various preferences for meat cuts between countries.
Banterle and Carraresi (2006) applied cluster analysis to highlight groups of countries with similar features in meat industry. The competitiveness was presented by RCA and NEI indexes. Good competitive performance in the meat sector was observed in Italy, Spain, Ireland and Austria, all were found to be specialised in the sector and export oriented. Germany and France showed positive competitive performance, but a high level of intra - industry trade and low specialisation. Denmark was characterized by negative dynamics of competitiveness even though there were high exports in the sector; a similar trend is observed in Belgium and the Netherlands. The rest of the countries show weak
competitiveness for the analysed sector. The type of exported product varies greatly also. Italy and Spain export dried or smoked swine meat, whereas Germany and Denmark export mainly sausages and preserved meat. Krystallis and Arvanitoyannis (2006) used also cluster analysis to analyse meat industry in Greece,
but to deine consumer types in relation to meat quality perceptions.
Acknowledgements
This article was created with the support of the Internal Grant Agency of the Faculty of Economics and Management of the Czech University of Life Sciences Prague. Grant title: The competitiveness of enterprises of the food industry on the Czech market. Registration number: 20161006.
Corresponding author: Ing. Zdeňka Náglová, Ph.D.
Department of Economics, Faculty of Economics and Management,
Czech University of Life Sciences in Prague, Kamýcká 129, Prague 6 – Suchdol, Czech Republic E-mail: [email protected]
References
[1] Bakucs, L., Latruffe, L., Fertö, I. and Fogarasi, J. (2010) „Impact of EU accession on farms
technical eficiency in Hungary“, Post-Communist Economies, Vol. 22, No. 2, pp. 165-175. ISSN 1465-3958. DOI 10.1080/14631371003740639.
[2] Baguley, T. (2012) „Calculating and graphing within-subject conidence intervals for ANOVA“,
Behavior Research Methods, Vol. 44, No. 1, pp. 158-175. ISSN 1554-3528.
DOI 10.3758/s13428-011-0123-7.
[3] Banterle, A. and Carraresi, L. (2006) “International Trade and Competitivene s s Analysis in the European Union: the Case of Prepared Meat Sector“, In: 98th EAAE Seminar Marketing
Dynamics within the Global Trading System: New Perspectives, Chania, Crete, Greece as in: 29 June – 2 July, 2006.
[4] Bennani, Y. and Benabdeslem, K. (2006) „Dendogram-based SVM for multi-class classiication. CIT“, Journal of Computing and Information Technology, Vol. 14, No. 4, pp. 283-289. ISSN 1846-3908.
[5] Berman, S. L., Wicks, A. C., Kotha, S. and Jones, T. M. (1999) „Does stakeholders orientation
matter? The relationship between stakeholder management models and irm inancial performance“,
Academy of Management Journal. Vol. 42, No. 5, pp. 488-506. ISSN 1948-0989. DOI 10.2307/256972.
[6] Bernini, C. and Pellegrini, G. (2011) „How are growth and productivity in private irms affected by public subsidy? Evidence from a regional policy“, Regional Science and Urban Economics, Vol. 41, No. 3, pp. 253-265. ISSN 0166-0462. DOI 10.1016/j.regsciurbeco.2011.01.005.
[8] Brase, Ch. H. and Brase, C. P. (2016) „Understanding Basic Statistics“, Cengage Learning, Boston, USA. ISBN 978-1-305-87349-0.
[9] Buckwell, A. and Davidova, S. (1993) „Potential implications for productivity of land reform in Bulgaria“, Food Policy, Vol. 18, No. 6, pp. 493-506. ISSN 0306-9192.
DOI 10.1016/0306-9192(93)90006-W.
[10] Cardinal, N. and Aitken, M. R. F. (2006) „ANOVA for the behavioral sciences researcher“, Lawrence Erlaum Associates, New Jersey, USA. ISBN 0-8058-5586-6.
[11] Carroll, J., Greene, S., O´Donoghue, C., Newman, C. and Thorne, F. (2009) „Productivity
and the Determinants of Eficiency in Irish Agriculture (1996-2006), In: The 83rd Annual Conference of the Agricultural Economics Society, Dublin, Ireland, 30 March-1 April.
[12] Criscuolo, C., Martin, R., Overman, H. and Van Reenen, J. (2009) „The Causal Effects
of an Industrial Policy“, NBER Working Paper, No. 17842, National Bureau of Economic Research,
Cambridge.
[13] Čechura, L. and Hockmann, H. (2010) „Sources of economic growth in the Czech food processing“,
Prague Economic Papers, Vol. 2, pp. 169-182. ISSN 2336-730X.
[14] Del Monte, A. and Papagni, E. (2003) „R&D and the growth of irms: empirical analysis
of a panel of Italian irms“, Research Policy, Vol. 32, No. 6, pp. 1003–1014. ISSN 0048-7333. DOI 10.1016/S0048-7333(02)00107-5.
[15] Food Drink Europe (2015) „European Food and Drink Industry 2014-2015“. [Online]. Available: http://www.fooddrinkeurope.eu/uploads/publications_documents/Data_and_Trends_2014-20151. pdf/ [Accessed: 20 Sep 2016].
[16] Gorton, M. and Davidova, S. (2004) „Farm productivity and eficiency in the CEE applicant countries: A synthesis of results“, Agricultural Economics, Vol. 30, No. 1, pp. 1-16. ISSN 1574-0862. DOI 10.1111/j.1574-0862.2004.tb00172.x.
[17] Habib, A. (2006) „Disaggregated earnings and prediction of future proitability: evidence from industrial groups in Japan“, Review of Accounting and Finance, Vol. 5, No. 4, pp. 355-369. ISSN 1475-7702. DOI 10.1108/14757700610712435.
[18] Hall, B. and LeVeen, P. (1978) „Farm size and economic eficiency: The case of California“,
American Journal of Agricultural Economics, Vol. 60, No. 4, pp. 589-600. ISSN 1467-8276.
DOI 10.2307/1240243.
[19] Harris, R. and Trainor, M. (2005) „Capital Subsidies and Their Impact on Total Factor Productivity: Firm-level Evidence from Northern Ireland“, Journal of Regional Science, Vol. 45, No. 1, pp. 49–74. ISSN 1467-9787. DOI 10.1111/j.0022-4146.2005.00364.x.
[20] Hockmann, H., Levkovych, I. and Grau, A. (2013) „Review of recent developments in the agri-food
sector“. COMPETE Working Papers. [online]. Available: http://www.competeproject.eu/ ileadmin/compete/iles/working_paper/COMPETE_Working_Paper_1_Recent_developments.pdf
[Accessed: 10 Sep 2016].
[21] Kislingerová, E. (2008) „Inovace nástrojů ekonomiky a managementu organizací“ (Innovation of tools of economic and management organizations - in Czech), C. H. Beck, Prague. ISBN 978-80-7179-882-8.
[22] Krystallis, A. and Arvanitoyannis, I. S. (2006) „Investigating the concept of meat quality from the consumers´perspective: The case of Greece“, Meat Science, Vol. 72, No. 1, pp. 164-176. ISSN 0309-1740. DOI 10.1016/j.meatsci.2005.06.013.
[23] Lambarraa, F., Stefanou, S., Sarra, T. and Gil, J. (2009) „The impact of the 1999 CAP reforms
[24] Latruffe, L. (2010) “Competitiveness, Productivity and Eficiency in the Agricultural and Agri-Food Sectors”, OECD Food, Agriculture and Fisheries Papers, No. 30, OECD Publishing. ISSN 1815-6797.
[25] Latruffe, L., Balcombe, K., Davidova, S. and Zawalinska, K. (2004) „Determinants of technical
eficiency of crop and livestock farms in Poland“, Applied Economics, Vol. 36, No. 12, pp. 1255-1263. ISSN 1466-4283. DOI 10.1080/0003684042000176793.
[26] Liargovas, P. and Skandalis. K. (2010) „Factors Affecting Firm Competitiveness: The Case of Greek Industry“, Global Business and Management Research - An International Journal, Vol. 2, No. 2, pp. 184-197. ISSN 1947-5667.
[27] Martin, H. M., Smith, K. T. and Smith, M. (2015) „A Financial and Public Policy Analysis
of the Meat Industry“. [Online]. Available: https://ssrn.com/abstract=2618753. [Accessed: 15 Sep
2016]. DOI 10.2139/ssrn.2618753.
[28] Mathijs, E., Dries, L., Doucha, T. and Swinnen, J. (1999) „Production eficiency and organization of Czech agriculture“, Bulgarian Journal of Agricultural Science, Vol. 5, No. 2, pp. 312-324. ISSN 1310-0351.
[29] Mijić, K., Zekić, S., Jakšić, D. and Vuković, B. (2014) „Meat industry in Serbia: performance analysis of meat-processing and livestock companies“, Custos e @gronegócio on line, Vol. 10, No. 3, pp. 124-144. ISSN 1808-2882.
[30] Ministry of Agriculture (2014) „Panorama of Food Industry 2013“ [Online]. Available: http://eagri.cz/public/web/mze/ministerstvo-zemedelstvi/vyrocni-a-hodnotici-zpravy/panorama-potravinarskeho-prumyslu/panorama-potravinarskeho-prumyslu-2013.html [Accessed 10 Sep 2016].
[31] Medonos, T., Ratinger, T., Hruška, M. and Špička, J. (2012) „The Assessment of the Effects of Investment Support Measures of the Rural Development Programmes: the Case of the Czech Republic“, Agris on-line Papers in Economics and Informatics, Vol. 4, No. 4, pp. 35-47. ISSN 1804-1930.
[32] Mejstříková, L., Mezera, J. and Plášil, M. (2011) „Positive and Negative Aspects of Financial Economic Development in Selected Branches of the Food Industry of the CR in 2007-2009 as Revealed by Spider Analysis“, Agris on-line Papers in Economics and Informatics, Vol. 3, No. 2, pp. 39-54. ISSN 1804-1930.
[33] Menrad K. (2004) „Innovations in the food industry in Germany“, Research Policy, Vol. 33, No. 6, pp. 845–878. ISSN 0048-7333. DOI 10.1016/j.respol.2004.01.012.
[34] Meric, G., Welsh, C., Weidman, S. and Marmon, R. (2011) „The Effects of the 2008 Stock Market Crash on the Managerial Behavior, Financial Characteristics and Competitiveness of Large U. S. Corporations“, Journal of Global Business Issues, Vol. 5, No. 1, pp. 11-20. ISSN 1931-311X.
[35] Munroe, D. (2001) „Economic eficiency in Polish peasant farming: An international perspective“,
Regional Studies, Vol. 35, No. 2, pp. 461-471. ISSN 1360-0591. DOI 10.1080/00343400123499.
[36] O´Neill, S. and Matthews, A. (2001) „Technical eficiency in Irish agriculture“, The Economic
and Social Review, Vol. 32, No. 3, pp. 263-284. ISSN 12-9984.
[37] Putićová, M. and Mezera, J. (2008) „Food industry in the Czech Republic – with regard to labour force development“, Agricultural Economics, Vol. 54, No. 6, pp. 285-292. ISSN 1805-9295.
[38] Rasmussen, E. M. (1992) „Clustering Algorithms. Information retrieval: data structures
and algorithms“, Prentice-Hall, Inc., New Jersey, USA. ISBN 0-13-463837-9.
[39] Rossi, F. andMirtchev, V. (2016) „Statistics for Food Scientists“, Academic Press, San Diego, USA. ISBN 9780124171794.
[41] Schiefer, J. and Hartman, M. (2008) „Determinants of competitive advantage for German food processors“, Agribusiness, Vol. 24, No. 3, pp. 306-319. ISSN 1520-6297. DOI 10.1002/agr.20168.
[42] Skuras, D., K. Tsekouras, Dimara. E. and Tzelepis. D. (2006) „The Effects of Regional Capital Subsidies on Productivity Growth: A Case Study of the Greek Food and Beverage Manufacturing Industry“, Journal of Regional Science, Vol. 46, No. 355-381. ISSN 1467-9787. DOI 10.1111/j.0022-4146.2006.00445.x.
[43] Špička, J. and Krause, J. (2013) „Selected socioeconomic impact of public support for agricultural biogas plants: the case of the Czech republic“, Bulgarian Journal of Agricultural Science, Vol. 19, no. 5, pp. 929-938. ISSN 1310-0351.
[44] Tangen, S. (2003) „An overview of frequently used performance measures“, Work Study, Vol. 52, No. 7, pp. 347-354. ISSN 0043-8022. DOI 10.1108/00438020310502651.
[45] Wijnands J. H. M., Van der Meulen B. M. J. and Poppe K. J. (2007) „Competitiveness
of the European Food Industry, An economic and legal assessment“. Luxembourg: European
Commission. ISBN 978-92-79-06033-5.
[46] Zhu, X., Demeter, R. and Oude Lansink, A. (2008) „Competitiveness of Dairy Farms in Three Countries: The Role of CAP Subsidies“, In: 12th Congress of the European Association of Agricultural