Consumption
gabriel lagunes martínez University of Primorska, Slovenia [email protected]
štefan bojnec
University of Primorska, Slovenia [email protected]
This paper aims to analyze factors of novel food consumption. The study was conducted in Maribor, Slovenia. Two hundred re-spondents from two age groups are included in the sample: be-tween 18 and 35 years and bebe-tween 36 and 55 years. The anal-ysis focuses on quantitative and qualitative factors. The respon-dent age is the predominant variable to test hypothesis. The Pear-son correlation and analysis of variance are used in the empiri-cal analysis. The results show that qualitative factors explained greater statistical differences than quantitative.
Key words:novel food, consumption, socio-economic factors, quantitative, qualitative
Introduction
Backgrounds
According to Krugman (2005), globalisation has made the world more vulnerable. Movements of short-term capital can be a source of instabilities and these have increased with relaxation in the control of financial flows. Financial and economic crises might be a price to be paid for greater openness and integration. On the contrary, Sachs (2005) argued that the global economy is handled in a reasonable manner when facing crises.
This paper focuses on specific types of novel food and its accep-tance by local consumers. It is possible that different factors deter-mine a consumer’s behaviour such as age, gender and education. The consumers might not accept any changes in their food consump-tion habits. Many people do not change their habits because they do not know how to change. Therefore, getting consumers to alter their customs can be a process that cannot happen overnight (Ulene and Prochaska 2011).
Consumers might consider combinations of attribute levels when they develop preferences and select food products according to the perception of the value they provide. Therefore, consumers’ prefer-ences when making the purchase decision are concerned in deter-mining the contribution of each of the product attributes and their levels (Vázquez 1990). Consumers have a limited capacity to pro-cess the information, and because of that, the learning propro-cess is important. This process requires a consumer’s attention, selection of information and interpretation of perceptions (Bettman, Luce and Payne 1998). Initial experience and expectations predispose learn-ing. Thereby, to have previous knowledge of the characteristics of the product is useful in the buying process. On one hand, it allows the consumer to easily recognize the product they are looking for. On the other hand, it helps to incorporate more information about a new brand (Baker et al. 1986).
Defining the context is important for supply-side and demand-side decisions. The supply-demand-side decision is to define the design for the product/service supply in the market. The demand-side con-sumer’s decision is a selection among several alternatives, subject to checking the availability of budget, time, brand, flavour, regarding the product service that best meets their desires and needs (Ramos 1999).
research regarding the categorisation that makes the consumers’ perceptions has focused on how the new products of the category are influenced by pre-existing beliefs and emotions (Loken 2006). A consumer’s existing relationship with a brand plays an important role in the brand extension’s success. There is ample empirical ev-idence that well-known brands could benefit from extensions more than brands, which exhibit less success. For example, Smith and Park (1992) argued that stronger brands might have a better ability to re-duce perceived risk than weaker ones and showed a positive and significant relationship between brand strength and the brand ex-tension’s market share.
Literature focused on marketing and consumer behaviour has proved that geographical origin can contend with price effects, the value of the brand, perceived quality and it supposedly transfers the image of an attitude towards the region where the brand of the pro-moted products is from (Han 1989; Maheswaran 1994; Gürhan-Canli and Maheswaran 2000). Roth and Romeo (1992) showed that the perceived match between geographical origin and the product could be crucial in consumers’ purchasing behaviour.
Following from the exposed literature, the following two hypothe-ses are proposed:
h1 The perceptions towards novel food product consumption are in-fluenced by food consumption experiences and economic factors (quantitative).
h2 The perceptions towards novel food product consumption (be-tween female, male, younger and older consumers) are influenced by information on novel food and marketing-promotional activi-ties (qualitative).
It is important to mention thatageis the primary variable in the correlation analysis, which helped us to take a decision regarding the tested hypothesis. The gender variable is also studied to show the differences of perception-opinion. The hypotheses are tested in the case of novel food consumption in the town of Maribor, Slovenia.
Methodology
survey design
is located in the Northeast of the country, in the Podravska statisti-cal region, 23 km from the Austrian border. Maribor is divided into 33 residential areas. A total of 200 surveys were successfully con-ducted to make the analyses. The survey’s structure considered the age and gender of the respondents. Two age groups of the respon-dents were considered. The first age group was between 18 and 35 years. This group was composed of 100 people: 50 female and 50 male. The second age group was between 36 and 55 years, and was also composed of 100 people: 50 female and 50 male. The survey’s research on novel food was carried out between February and May 2013. It was explained to the respondents that novel foods are con-sidered as functional, genetically modified, ethnic, and organic and convenience food. The respondents were asked to respond to four questions: two questions contained quantitative perceptions and the other two qualitative perceptions. The quantitative perceptions were evaluated by the following two questions: First, please indicate from the following aspects which ones are more important for you when buying food: price, nutritional facts, product quality, and freshness (expiration date).Second, please indicate from the information that appears on the food label which one you read:nutrients, vitamins and minerals, and calories.
The qualitative perceptions were evaluated by the following two questions: First, please indicate from the following aspects which ones are more important for you when buying food:the package (how the product looks), geographical origin, taste, already know the prod-uct, and the brand.Second, please indicate from the information that appears on the food label which one you read:list of ingredients and geographical origin.
The division into quantitative and qualitative factors of percep-tions was made in order to determine which ones are the most im-portant for the consumers when they purchase a particular product. For example, it can be seen as a hierarchical comparison between price (quantitative value) and taste (qualitative value).
We want to test if the set hypothesis is likely to be true with two possible outcomes: to reject the set hypothesis because of insuffi-cient statistical evidence to support the set hypothesis, and cannot reject the set hypothesis because of sufficient statistical evidence in the sample in favour of the set hypothesis.
correlation analysis
The Pearson correlation coefficient between the two variables is used as a measure of linear association between two normally dis-tributed interval variables (Rodgers and Nicewander 1988). It tests whether there are significant differences between two variables us-ing a correlation matrix, where any value less than or equal to 0.05 [(Sig.)≤0.05] would be considered as significant.
analysis of variance
The analysis of variance (anova) is a statistical method, which finds if there are statistically significant differences between mean val-ues. This technique allows for the analysing of differences between more than two means. Typical values forαare between 0.05 and 0.01.
These values correspond to the probability of observing such an
ex-treme value by chance (Tangren 2002). Theanovais used for two
subsamples by two age groups to test whether the groups are statis-tically different.
Empirical Results
To clarify theh1, a comparison of the attitude effects towards the
quantitative variables –price, nutritional facts, quality, and freshness
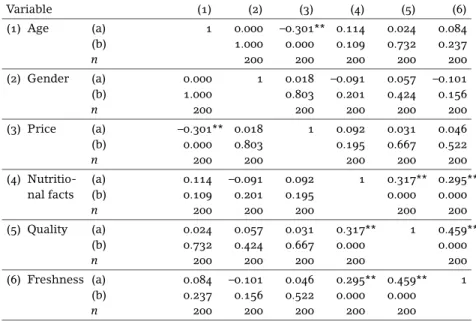
with the corresponding age – is tested. Table 1 presents the correla-tion results betweenageand the quantitative peers. As can be seen, only in one pair is there a statistically significant difference, between the exposed correlations.
For the first one it can be seen that the correlation coefficient be-tween variables age and good price of the product is negative and weakr= −0.301. A p-value is equal to 0.000, which signifies that is
highly statistically significant (p≤0.01). This significant effect
table 1 Correlation Matrix between Quantitative Variables Price, Nutritional Facts, Quality, and Freshness, and Variables Age and Gender
Variable (1) (2) (3) (4) (5) (6)
(1) Age (a) (b) n 1 0.000 1.000 200 –0.301** 0.000 200 0.114 0.109 200 0.024 0.732 200 0.084 0.237 200
(2) Gender (a) (b) n 0.000 1.000 200 1 0.018 0.803 200 –0.091 0.201 200 0.057 0.424 200 –0.101 0.156 200
(3) Price (a) (b) n –0.301** 0.000 200 0.018 0.803 200 1 0.092 0.195 200 0.031 0.667 200 0.046 0.522 200 (4) Nutritio-nal facts (a) (b) n 0.114 0.109 200 –0.091 0.201 200 0.092 0.195 200 1 0.317** 0.000 200 0.295** 0.000 200
(5) Quality (a) (b) n 0.024 0.732 200 0.057 0.424 200 0.031 0.667 200 0.317** 0.000 200 1 0.459** 0.000 200
(6) Freshness (a) (b) n 0.084 0.237 200 –0.101 0.156 200 0.046 0.522 200 0.295** 0.000 200 0.459** 0.000 200 1
notes (a) Pearson correlation, (b) sig. (2-tailed). ** Correlation is significant at the 0.01 level (2-tailed).
Betweengenderandprice,the empirical results are different. One does not find statistically significant differences as the p-value is equal to 0.803≥0.05, and a correlation coefficient r=0.018, which
is very close to 0. This means that there is almost no correlation be-tween the analysed variables. It is remarkable how the events can change from one variable to another, whileagepresented highly sig-nificant results within the variable price, whilegenderon the other hand showed opposite results. The similar effect as it was with age can be appreciated for gender and the rest of the combinations. One out of the four peers presented a significant effect, the one between
ageandprice.
Table 2 presents the results of the two-way analysis of variance (anova).Agedoes not have a significant effect on the importance of quantitative perceptions, since thep-value is equal to 0.388≥0.05.
In addition, the quantitative factors have a significant effect due to
p=0.000≤0.01. Finally, the interaction effect of both age and
quanti-tative factors showed a significant effect, 0.000≤0.01. In other words,
table 2 anovaResults between Variables Age, Quantitative Factors and the Interaction of Them
Source (1) (2) (3) (4) (5)
Age 0.405 1 0.405 0.746 0.388
Quantitative factors 150.285 3 50.095 92.320 0.000
Age*quantitative factors 15.145 3 5.048 9.304 0.000
notes Column headings are as follows: (1) sum of squares, (2) df, (3) mean square, (4)F-test, (5) sig.
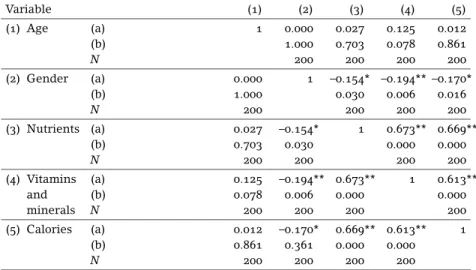
The second question of the survey referred to how often the re-spondents read the information shown on product labels. The study variables were nutritional composition, vitamins-mineral, and calo-ries with the correspondent variable age. Table 3 presents the re-sults of the correlation coefficients. The variableagedid not present any significant difference with the other analysed variables. The pair
age and nutritional composition (nutrients) had a very high non-significant effect as well as calories, 0.703 and 0.861, respectively.
Vitamins and mineralswere close to being significant, but the results are above the requested alpha level 0.078≥0.05.
Gendergives some interesting results. The three peers presented significance differences. Gender and nutritional composition show thatp-value is equal to 0.030 at the alpha level of 5%, which makes it significant. The correlation coefficient is very weak and negative,
r= −0.154, which signifies that both variables are moving into
op-posite directions. The remaining pairsgenderandvitaminsand min-eralsand gender caloriesshow the same negative correlation coef-ficients which are equal to r= −0.194 and r= −170 and significant
differences 0.006 and 0.016 respectively, at two different alpha lev-els. This is a good example of some greater differences among the studied variables, whereageandgenderindicate opposite results. In the comparison between age and gender, three out of the six vari-ables are significant.
Using the same data, a two-way analysis ofanovawas executed to analyse the quantitative variables previously exposed. Table 4 shows that age did not have a significant effect on the number of times the respondents look at the quantitative perceptions on labels; the p -value was above the alpha level 0.05, as it was equal to 0.182. The quantitative factors had a significant effect equal to 0.023 at 5%. Fi-nally, the interaction effect of them was not significant according to the 0.472≥0.05.
table 3 Correlation Matrix between Quantitative Variables Nutrients, Vitamins and Minerals, and Calories, and Variables Age and Gender
Variable (1) (2) (3) (4) (5)
(1) Age (a) (b) N 1 0.000 1.000 200 0.027 0.703 200 0.125 0.078 200 0.012 0.861 200
(2) Gender (a) (b) N 0.000 1.000 200 1 –0.154* 0.030 200 –0.194** 0.006 200 –0.170* 0.016 200
(3) Nutrients (a) (b) N 0.027 0.703 200 –0.154* 0.030 200 1 0.673** 0.000 200 0.669** 0.000 200 (4) Vitamins and minerals (a) (b) N 0.125 0.078 200 –0.194** 0.006 200 0.673** 0.000 200 1 0.613** 0.000 200
(5) Calories (a) (b) N 0.012 0.861 200 –0.170* 0.361 200 0.669** 0.000 200 0.613** 0.000 200 1
notes (a) Pearson correlation, (b) sig. (2-tailed). ** Correlation is significant at the 0.01 level (2-tailed). * Correlation is significant at the 0.05 level (2-tailed).
table 4 anovaResults between Variables Age, Quantitative Factors (Labels) and the Interaction of Them
Source (1) (2) (3) (4) (5)
Age 2.407 1 2.407 1.789 0.182
Quantitative factors 10.210 2 5.105 3.789 0.023
Age*quantitative factors 2.023 2 1.012 0.752 0.472
notes Column headings are as follows: (1) sum of squares, (2) df, (3) mean square, (4)F-test, (5) sig.
favour of the null hypothesis. There are not enough statistically sig-nificant differences to reject the null hypothesis.
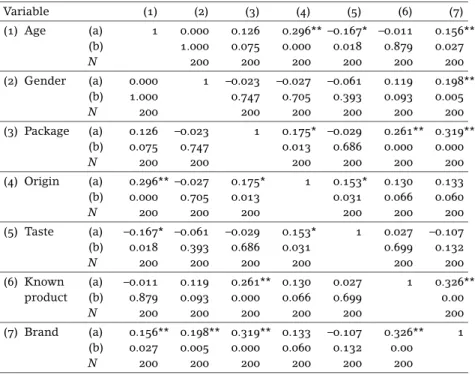
To clarify the seth2 the effects of attitude towards the qualitative
variables are compared: Package (how the product looks), geograph-ical location (where the product comes from), and the taste, already know the product, the brand name and the variable age.
The empirical results from the correlation analysis can be seen in table 5. The first pair between age and how the package looks ex-hibits a non-significant effect. Thep-value is equal to 0.075≥0.05.
The next pair was faced to geographical origin. In this case it can be detected that they have a significance effect between variables (p=0.000≤0.01) at the alpha level of 1%, and a low positive
next pair regarding age and taste gives a low negative correlation
r= −0.167 with a significant effect equal to 0.018 or the significance
level less than 5%. Younger people have different perceptions re-garding taste than older people, as for the former group it might be important while the latter group does not pay much attention to this variable. The fourth pair, age and already know the product demon-strates that the level of significance was above the 5% (0.879≥0.05);
the coefficient of correlation is close to zero (r=0.011). This
find-ing proves that there is a very weak correlation between the vari-ables. Finally, the last peer reveals the interaction effect with the brand, which is statistically significant at less than 5% (0.027≤0.05),
and a relatively low correlation coefficient equal to 0.156. Resum-ing, three out of five peers between age and the qualitative variables presented significant effects at different levels. Campbell (1996) ex-plains that the experience seems to be the principal motivation to learn about new products on the market. Therefore, the consumers’ contacts with the product category generates experience and affects the ability to recognize the products and brands (Foxman, Muehling and Berger 1990). Nevertheless, in our experiment the variable age does not have a significant correlation with the variable ‘I already know the product’ while there is a significant effect with the vari-able brand name.
The variablegenderreveals some intriguing differences. Between the five variables, just thebrand namepresented a statistical signif-icant effect (0.005≤0.01), while the rest of variables remained
non-significant. The difference of the empirical results betweenageand
gendercould give another perspective to the research, depending on the perceptions between these two groups of consumers. An inter-esting to see the results for the variableI already know the product,
which contradicts what Vargas (2003) said: Familiarity with the prod-uct predisposes the purchase; it does not allow that a misinformed purchase can be made, and finally leads to a trustworthy purchase.
Table 6 shows the results of theanovaperformance for the qual-itative variables. It can be seen that age, qualqual-itative factors and the interaction of them were significant at the 1% level. In other words, there is a significant difference in the mean ‘importance of the qual-itative perceptions’ based on age, qualqual-itative factors and the interac-tion of them.
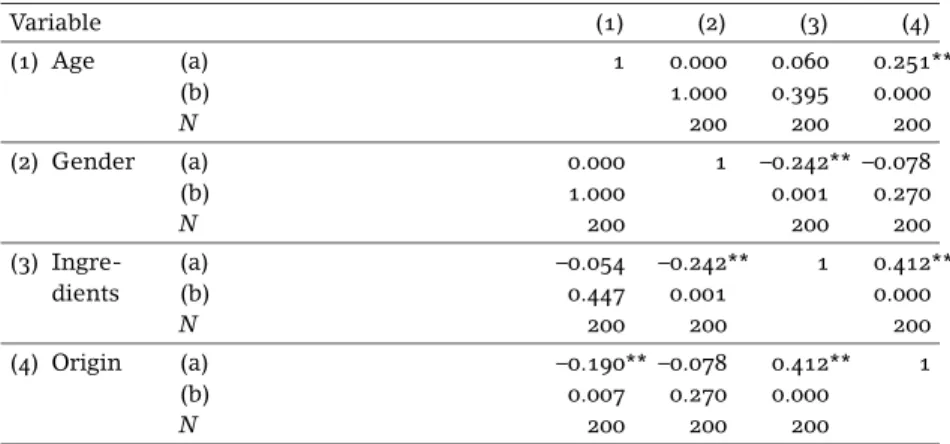
The last part of the research was focused on the food label infor-mation for the consumers. The investigated variables areingredients
andgeographical origin.Table 7 confirms that the pair betweenage
table 5 Correlation Matrix between Qualitative Variables Package, Origin, Taste, Know the Product, and Brand Name, and Variables age and Gender
Variable (1) (2) (3) (4) (5) (6) (7)
(1) Age (a) (b) N 1 0.000 1.000 200 0.126 0.075 200 0.296** 0.000 200 –0.167* 0.018 200 –0.011 0.879 200 0.156** 0.027 200
(2) Gender (a) (b) N 0.000 1.000 200 1 –0.023 0.747 200 –0.027 0.705 200 –0.061 0.393 200 0.119 0.093 200 0.198** 0.005 200
(3) Package (a) (b) N 0.126 0.075 200 –0.023 0.747 200 1 0.175* 0.013 200 –0.029 0.686 200 0.261** 0.000 200 0.319** 0.000 200
(4) Origin (a) (b) N 0.296** 0.000 200 –0.027 0.705 200 0.175* 0.013 200 1 0.153* 0.031 200 0.130 0.066 200 0.133 0.060 200
(5) Taste (a) (b) N –0.167* 0.018 200 –0.061 0.393 200 –0.029 0.686 200 0.153* 0.031 200 1 0.027 0.699 200 –0.107 0.132 200 (6) Known product (a) (b) N –0.011 0.879 200 0.119 0.093 200 0.261** 0.000 200 0.130 0.066 200 0.027 0.699 200 1 0.326** 0.00 200
(7) Brand (a) (b) N 0.156** 0.027 200 0.198** 0.005 200 0.319** 0.000 200 0.133 0.060 200 –0.107 0.132 200 0.326** 0.00 200 1
notes (a) Pearson correlation, (b) sig. (2-tailed). ** Correlation is significant at the 0.01 level (2-tailed). * Correlation is significant at the 0.05 level (2-tailed).
table 6 anovaResults between Variables Age, Qualitative Factors and the Interaction of Them
Source (1) (2) (3) (4) (5)
Age 8.836 1 8.836 10.809 0.001
Qualitative factors 512.824 4 128.206 156.836 0.000
Age*qualitative factors 22.304 4 5.576 6.821 0.000
notes Column headings are as follows: (1) sum of squares, (2) df, (3) mean square, (4)F-test, (5) sig.
There is almost no correlation between them since the correlation coefficient is equal tor=0.060. On the other hand, age and
geograph-ical origin displays a statistically significant correlation at the 1% level asp=0.000≤0.01. However, the correlation coefficientr=0.251
is relatively low. It can be seen that the results forgender are the opposite.Ingredientshave significant differences whilegeographical origindoes not. There is a significant correlation effect in the first pair asp=0.001≤0.01 with a negative correlation coefficient equal
table 7 Correlation Matrix between Qualitative Variables Ingredients and Geographical Origin, and Variables Age and Gender
Variable (1) (2) (3) (4)
(1) Age (a) (b) N
1 0.000 1.000 200
0.060 0.395 200
0.251** 0.000
200
(2) Gender (a) (b) N
0.000 1.000 200
1 –0.242** 0.001
200
–0.078 0.270 200
(3) Ingre-dients
(a) (b) N
–0.054 0.447 200
–0.242** 0.001
200
1 0.412** 0.000
200
(4) Origin (a) (b) N
–0.190** 0.007
200
–0.078 0.270 200
0.412** 0.000
200
1
notes (a) Pearson correlation, (b) sig. (2-tailed). ** Correlation is significant at the 0.01 level (2-tailed).
table 8 anovaResults between Variables Age, Qualitative Factors (Labels) and the Interaction of Them
Source (1) (2) (3) (4) (5)
Age 13.323 1 13.323 11.175 0.001
Qualitative factors 7.023 1 7.023 5.891 0.016
Age*qualitative factors 6.003 1 6.003 5.035 0.025
notes Column headings are as follows: (1) sum of squares, (2) df, (3) mean square, (4)F-test, (5) sig.
coefficient (r= −0.078) but with no significant correlation coefficient
according top=0.270≥0.05.
Finally, theanovawas performed. Table 8 suggests that age has a significant effect asp=0.001≤0.01. The qualitative variables also
have a significant effect (p=0.016≤0.05) as well as the interaction of
them (p=0.025≤0.05). The results suggest that age, qualitative
fac-tors and the interaction of them have statistically significant differ-ences in the mean how often consumers see the labels of the prod-ucts they buy.
Taking into account the results obtained by the Pearson Correla-tion coefficients and theanova, the seth2 cannot be rejected: The perceptions towards novel food product consumption are influenced by information on novel foods and marketing-promotional activities.
Conclusions
age. The comparison between the variables age and gender showed that the preferences-perceptions regarding the novel food could vary in a significant way. The correlation analysis confirmed the importance of quantitative and qualitative perceptions. The corre-lation coefficients were more significant for age and the qualitative perceptions. Theanovaconfirmed the most significant results in the qualitative variables and the age variables, and the interaction of them.
The perceptions of younger and older consumers can be perceived in a very different way when making the statistical analysis. Accord-ing to the seth2, consumers can perceive towards the brand name
and the product origin. This suggests that in the case of new prod-ucts, there is a greater probability of acceptance by the consumer when there is a similarity of the product either with a category previ-ously related to, or with a specific known brand (Barone, Miniard and Romero 2000) or it is supported by the strong promotional campaign made by marketing companies and social networks (Subramani and Rajagopalan 2003).
It is possible that consumers’ experiences can be transcendental when buying products and services. Moreover, as argued by Erdem and Keane (1996), consumers can react adversely to the variation in product attributes. Therefore, a change in product attributes can cause a lack of credibility in content or distrust. For future research, it would be interesting to further investigate whether Slovenian con-sumers would be willing to accept a change in their consumption habits and thus distrust in food consumption.
References
Baker, W., W. Hutchinson, D. Moore, and P. Nedungady. 1986. ‘Brand Familiarity and Advertising: Effects on the Evoked Set and Brand Preference.’ InAdvances in Consumer Research,vol. 13, edited by Richard J. Lutz, 637–42. Provo,ut: Association for Consumer Re-search.
Barone, M. J., P. W. Miniard, and J. B. Romero. 2000. ‘The Influence of Positive Mood on Brand Extension Evaluation.’Journal of Consumer Research26 (4): 386–400.
Bettman, J. R., M. F. Luce, and J. W. Payne. 1998. ‘Constructive Consumer Processes.’Journal of Consumer Research25 (3): 187–217.
Campbell, J. 1996. ‘Shape Properties, Experience of Shape and Shape Concepts.’Philosophical Issues7:351–63.
Food Drink Europe. 2011. ‘Data & Trends of the European Food and Drink Industry 2011.’ http://www.fooddrinkeurope.eu/uploads/ publications_documents/Final_Data__Trends_30.4.2012.pdf
Foxman, E. R., D. D. Muehling, and P. W. Berger. 1990. ‘An Investigation of Factors Contributing to Consumer Brand Confusion.’Journal of Consumers Affairs24 (1): 170–89.
Gürhan-Canli, Z., and D. Maheswaran. 2000. ‘Cultural Variations in Country of Origin Effects.’Journal of Marketing37 (3): 309–17. Han, M. 1989. ‘Country Image: Halo Or Summary Construct?’Journal of
Marketing Research26 (2): 222–9.
Krugman, P. 2005. ‘Crises: The Price of Globalisation?’ InEconomics of Globalisation,edited by P. Gangopadhyay and M. Chatterji, 163–80. Aldershot: Ashgate.
Likert, R. 1932. ‘A Technique for the Measurement of Attitudes.’Archives of Psychology22 (140): 5–55.
Loken, B. 2006. ‘Consumer Psychology: Categorization, Inferences, Af-fect and Persuasion.’Annual Review of Psychology57:453–85. Maheswaran, D. 1994. ‘Country of Origin as a Stereotype: Effects of
Consumer Expertise and Attribute Strength on Product Evalua-tions.’Journal of Consumer Research21 (2): 354–65.
Meulenberg, M. T. G., and J. E. B. M. Steenkamp. 1991. ‘El analisis del consumo de alimentos y la eleccion de los productos alimenticios.’ Revista de estudios agrosociales157:125–51.
Ramos, A. M. 1999. Análisis de las preferencias del turista mediante análisis conjunto: el caso de Tenerife. Tenerife: Departamento de Economía de las Instituciones, Estadística Económica y Econometría. Rodgers, J. L., and A. Nicewander. 1988. ‘Thirteen Ways to Look at the
Correlation Coefficient.’The American Statistician42 (1): 59–66. Roth, M. S., and J. B. Romeo. 1992. ‘Matching Product Category and
Country Image Perceptions: A Framework for Managing Country of Origin Effects.’Journal of International Business Studies23 (3): 477– 97.
Sachs, J. 2005. ‘Preface.’ InEconomics of Globalisation,edited by P. Gan-gopadhyay and M. Chatterji, xv–xviii. Aldershot: Ashgate.
Smith, D. C., and C. Whan Park. 1992. ‘The Effects of Brand Extensions on Market Share and Advertising Efficiency.’Journal of Marketing Research29 (9): 296–313.
Statistical Office of the Republic of Slovenia. 2012. ‘Population in the City of Maribor in the Year 2012.’ http://www.stat.si/krajevnaimena/ default.asp?txtIme=MARIBOR&selNacin=celo&selTip=naselja&ID =2620.
Subramini, M. R., and B. Rajagopalan. 2003. ‘Knowledge-Sharing and Influence in Online Social Networks via Viral Marketing.’ Commu-nications of theacm46 (12): 300–7.
Tangren, J. 2002. ‘Basic Info: What Is ananova?’ Washington State Uni-versity, Tree Fruit Research and Extension Center, Washington,dc. http://www.tfrec.wsu.edu/anova/basic.html
Ulene, V., and J. Prochaska. 2011. ‘Why Are Unhealthy People So Reluc-tant to Change Their Lifestyles?’ http://articles.latimes.com/2011/ may/23/health/la-he-the-md-change-illness-20110523.
Vargas, L. 2003. ‘Procesamiento de información y familiaridad de mar-ca.’Anàlisi Quaderns de Comunicació i Cultura30 (3): 225–40. Vázquez, R. 1990.Investigación de las preferencias del consumidor
medi-ante análisis de conjunto: importancia para el diseño de nuevos pro-ductos.Oviedo: Facultad de Ciencias Económicas.