Brazilian Journal of Poultry Science
Revista Brasileira de Ciência Avícola
ISSN 1516-635X Oct - Dec 2013 / v.15 / n.4 / 287-294
Review
The Role of Poultry Industry in Indian Economy
Author(s)
Vetrivel SCI
Chandrakumarmangalam SII
I Kongu Engineering College, Perundurai Erode, Tamilnadu- India
II Department of Management Studies Anna University Regional Centre, Coimbatore.
India
Mail Adress
Corresponding author e-mail address Dr. S.C.Vetrivel
Assistant Professor, School of Management Studies
Kongu Engineering College, Perundurai Erode, Tamilnadu- India
Tel: +91 94422 10999. E-mail: scvetrivell@gmail.com
Keywords
Eggs, supply, production, technology, growth, population.
Submitted: November/2012 Approved: July/2013
ABSTRACT
Poultry farming in India, in spite of several constraints, has progressed considerably during the last decade. The present study has been undertaken to examine various aspects related to the growth and development of poultry production in the country. Poultry production in India was confined to backyards till recently. Local breed of birds were reared for the supply of eggs and meat. The increasing demand for poultry products necessitates augmenting the supply by importing improved breeds of poultry. In 1961, the proportion of hybrid populations in the total population of poultry was about 2 percent. Within a couple of decades, these birds have dominated the market sidelining the indigenous birds. The technological advances have revolutionized the role and the structure of poultry industry in India. It became one of the most specialized enterprises in many parts of the country. A general confidence has been created among the people that green revolution has ushered an era of self-reliance in the food grain production. The rapidly growing population has created some doubts in the said hypothesis. In fact, crop production alone may not solve the food problem of the country. The advances in cereal technology, of course, can fill the empty stomach, but it may not help in the balanced growth of the human body. The chief ingredients of balanced diet also comprise proteins, fats, minerals and vitamins, which are essential for growth. The supply of these items can easily be increased through increased production of livestock products.
INTRODUCTION
In a short period, in the livestock sector poultry is the most
efficient enterprise for increasing the supply of Desi red proteins,
fats, minerals and vitamins.
The broad objectives of this study are, as follows:To study the existing status of poultry sector in India
To examine the growth pattern of poultry in different regions and To construct developmental indices for poultry production in different states.
LITERATURE REVIEW
costs occupy a major share of total cost of production of eggs followed by cost of chicks and labor. Goutard & Magalhaes, (2006) have identified the major marketing channels of poultry and poultry products. Here, the marketing channel shows that a large number of middlemen are involved in the marketing chain between producers and consumers. It was found that an average trader handles between 40 to 100 chickens per week while the middleman manages 2000 eggs per month. Moreover, it is estimated that the average number of birds that are sold at local markets ranges from 30 to 400 per day.
According to Bhardwaj et al. (1995), in a study
on cost behavior and marketing margins of broilers, observed that cost of raising broilers varied according to the size of poultry farms. In marketing broilers, the retailers earned maximum profits, whereas the producers’ profit was only half of that of retailer.
Bhardwaj et al. (1996), in a study of broilers in
Haryana, concluded that the supply of broilers was affected by bird mortality and culling rate , which depended on bird age and size of poultry farms. The depletion rate decreased as the size of poultry farm increased. The study further showed that the marketing practices were influenced by the size of farms and seasons. Pandey et al. (1996a) studied the status of poultry production in India and also analyzed the behavior of production cost of poultry products in selected areas. The study showed that poultry had become a vital component of the farm economy as it generated additional income and employment in the rural area. The cost estimated revealed that feed alone accounted for about two-thirds of the total cost. The study concluded that availability of feed at reasonable prices would provide an incentive to the farmers
to produce more poultry . Pandey et al. (1996b)
observed that the development of poultry production was adversely affected by wide fluctuations in the demand. The study showed that rise in the price of eggs was comparatively lower than the rise in prices of milk, food articles and all commodities during the period of 1982-94. The production and disposal of eggs at poultry farms revealed that more than 98 percent of the eggs were sold for profit.
The main marketing agents were identified as wholesale dealer and contractors. Iqbaluddin (1996) mentions that in most of the poultry pockets in India, marketing was still controlled by private traders. Fluctuation in the prices of poultry products was one of the main constraints for attracting investment in the sector. Market Intervention Scheme (MIS) for
procurement of eggs in Andhra Pradesh, Tamil Nadu, Punjab, Haryana, Madhya Pradesh and Rajasthan by NAFED had shown encouraging results, though the magnitude of operation is very small. Seetharaman (1996) studied the pattern of poultry development in India. He observed that out of 9 states, with well-developed poultry industry, only in two of them, i.e., in Gujarat and Maharashtra, the poultry cooperatives were doing well. He recommended that poultry cooperatives need to be extended in all poultry producing states.
METHODOLOGY
Due to constraints of resources and time along with preliminary nature of this investigation, only 220 interviewers were chosen from Namakkal, Pollachi, Rasipuram and Velloredistricts of Tamil Nadu. Stratified random sampling method was used to select the sample. To obtain a probability sample, considerable effort was devoted to selecting the appropriate sample plan. A preliminary version of the questionnaire was developed in English on the basis of insights from in-depth qualitative interviews with experts. Besides, personal observation was done where necessarily applicable. A pilot survey was conducted in the study area and the questionnaire was improved in that light. Interviewers were given a letter of introduction about the researcher so that respondents would see that the study was authentic. The telephone/mobile numbers were provided too, in case respondents wanted to verify the identity of the investigators or clarify any questions.
STATUS OF POULTRY IN INDIA
Poultry enterprises in India can distinctly be grouped into two categories i.e. developmental poultry farms and commercial poultry farms.
a) Developmental poultry farms
Vetrivel SC
Chandrakumarmangalam S The Role of Poultry Industry in Indian Economy
(SLPP), Tribal Development Program (TDP), etc. to popularize poultry farming in rural areas. However, the growth of developmental poultry did not succeed at Desi red level.
b) Commercial poultry production
Commercial / industrial poultry production refer to large-scale enterprises where the number of birds per unit is large enough to reap maximum advantages of technological improvement. These enterprises present various economies of scale of operation and, thus, are able to absorb the fluctuations in demand and supply and in input cost. The growth of this sector has remained highly significant over the years. However, it has been confined to some pockets of the country.
POULTRY POPULATION AND ITS
DISTRIBUTION
The poultry population in India in 1951 was 73.5 million birds. It increased to 138.5 million in 1972 (doubled) and about four times by 1992, i.e., 307.07 million. The growth in poultry population was 5.32 percent per annum between 1951-56, 5.47 percent per annum between 1977-82, and 5.79 percent per annum (maximum) between 1982-87. The minimum growth in population was recorded between 1961-66, i.e., 0.21 percent per annum. Distribution or spread of poultry birds over the space may be examined by two approaches:
a) Distribution according to area (rural/urban) and b) Distribution according to different regions.
Poultry populations in rural/urban areas:
Based on the Livestock Census of 1987 and 1992, the distribution of poultry reveals the following interesting features:
Rural and semi-urban area accounted for the largest number of broilers (more than 90%).
Population of improved breeds of both layers and meat-type chickens increased much faster during the two periods as compared to Desi (Local) breeds.
The population of broilers had increased rapidly, i.e., 21% per annum as compared to layers.
The proportion of poultry distribution in two areas did not reveal much variation during the period.
The leading poultry producing states in different regions were Andhra Pradesh and Tamil Nadu in Southern Region, West Bengal and Bihar in Eastern
Region, Maharashtra in Western Region and Punjab in Northern Region.
Productivity of Desi (Local) and improved birds, i.e., eggs produced/year, also varied in different regions. Maximum productivity of Desi (Local) birds, i.e., 91 eggs/year, was reported in Eastern region and minimum of 15 eggs/year, was reported in Northern Region. In case of improved birds, the productivity was highest in Southern Region (241 eggs/year), followed by 238, in Western Region, 209, in Northern region and 204, in Eastern Region. State-wise, the productivity of Desi (Local) birds was maximum in Himachal Pradesh, i.e., 168 eggs/year and lowest in Nagaland, i.e., 79 eggs/year. In case of improved birds, the maximum productivity was 278 eggs/year, in Andhra Pradesh, and minimum of 180 eggs/year, again in Nagaland.
Regional distribution of hybrid parent stock revealed that it is heavily concentrated in Southern Region, with nearly 45% of layers and 37% of broilers. The Northern region ranked second, with 27% layers and 25% broilers. It was followed by the Western Region, with nearly 20% and 25% of layer and broilers, respectively. The Eastern region had only 9% of layers and 14% of broilers. State-wise concentration of percent stock of both layer parent and broilers reveals a similar trend. The ranking of different states was Andhra Pradesh (25% and 18%), Tamil Nadu (14% and 9%), Maharashtra (12% and 18%), Punjab (10% each) and West Bengal (3% and 9%) of layers and broilers, respectively.
POULTRY DEVELOPMENT IN INDIA
two WPDI groups, the 0.52 level was arbitrarily chosen as the cut-off of different states classifying all states in two groups on the basis of low/high poultry farming development.
a. Growth in production.
Poultry products had shown a massive growth in the country after 1961. Egg production in that year was 2,881 million, which increased to about 30,000 millions in the year 1996. Broiler production starting from zero increased 400 million birds in the year 1996. Similarly, poultry meat, which was about 81 thousand tones in the year 1961, increased to 659 thousand tones in that same period. The increased production increased the availability of poultry products for consumption.
b. Growth in Production and Productivity of Eggs and Chicken Meat
Years Production Per capita availability
Eggs
(Million)
Broiler (Million)
Poultry meat(000’
t)
Egg (number)
Poultry meat (grams)
1991 2881 2 81 7 188
1999 5340 4 121 10 220
2001 12500 30 179 18 266
2005 23300 190 440 28 498
2009 33000 700 875 36
-2012 35000 800 975 38
-c. Growth in Egg Production
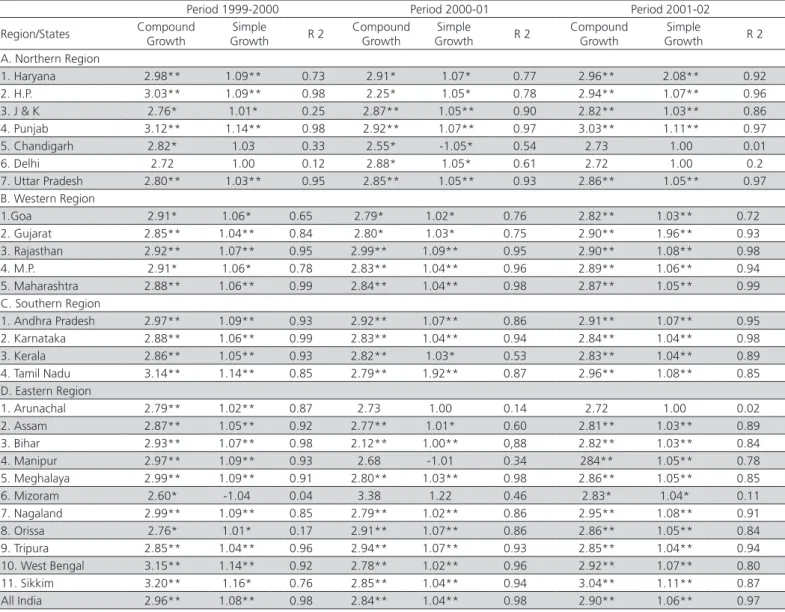
Growth in egg production in the major producing states of different regions of the country was examined during the period of 1980-98. The period was further divided in to two periods, i.e., 1980-89 and 1990-98. Compound growth and simple growth rates were calculated for the three periods and four regions.
1. Northern Region- There was a significant
growth in egg production in all the egg-producing states of the region. Punjab presented a maximum growth rate of 3.12%/year during first period and 3.03%/year in the intermediate period, followed by Himachal Pradesh (3.03, 2.94) Haryana (2.98, 2.96) and U.P. (2.80, 2.86). The period of 2002-03 had the lowest growth rate in egg production in the region.
2. Western Region – The major egg producing
states in the region showed the most significant growth in egg production during first period, except for Rajasthan, where the second period had shown a much faster growth, wtih 2.99%/year. The overall growth in the states of Gujarat, Madhya Pradesh, Maharashtra and Goa remained at 2.90, 2.89, 2.83 and 2.82%/year, respectively.
3. Southern Region: In this region, a maximum
and highly significant growth rate of 3.14%/year was observed in Tamil Nadu during the first period, 2.79%/year in the second period and 2.96%/year in both periods, followed by Andhra Pradesh, with 2.97, 2.92 and 2.91%/year, respectively., Karnataka grew 2.88, 2.83 and 2.84%/year and Kerala had 2.86, 2.82, 2.83%/year, respectively, in the first, second and entire period of study.
4. Eastern Region: In the Eastern Region, Sikkim
presented maximum growth egg production rates of 3.20, 2.85 and 3.04%/year, in first, second and entire period, followed by West Bengal with 3.15, 2.78, 2.92% year, Nagaland with 2.99, 2.79 and 2.95%/year, Meghalaya with 2.99, 2.80 and 2.86%/year, Manipur with 2.87, 2.68 and 2.85%/year, Bihar with 2.93, 2.12 and 2.82%/year, and Assam with 2.87, 2.77 and 2.81%/year. At national level, egg production growth rate was higher in first period, with 2.96%/year. In the second period, it was 2.84%/year and in entire period the growth was 2.90%/year.
d. Growth in Productivity
Productivity of Desi (Local) and improved birds in different regions was examined for the period of 1987-88 to 1994-95. The mean productivity level of Desi (Local) birds was maximum, i.e., 156 eggs/year, in Himachal Pradesh, in Northern region, and minimum, with 62 eggs/year, in Manipur, in Eastern Region. In case of improved birds, the maximum productivity of 278 eggs/year was reported in Andhra Pradesh, in the Southern region, and minimum of 109 eggs/year, in Manipur State, in the Eastern Region.
SUMMARY AND CONCLUSIONS
Vetrivel SC
Chandrakumarmangalam S The Role of Poultry Industry in Indian Economy
Table 1 – Distribution of Birds (Number of birds “000”)
Type of birds 2000 2008 Annual
Growth
Rural Urban Total Rural Urban Total
1. Cocks Total 32282(94.05) 2041(5.95) 34323 40677(93.02) 3054 (6.98) 43731 4.43 a) Desi 28288(95.05) 1473(4.95) 29761 31741(93.38) 2251(6.62) 33.992 2.21 b) Improved 3994(87.55) 568(12.45) 4562 8936(91.75) 803(8.25) 9739 15.48 2. Hens a) Desi 68129(94.65) 3853(5.35) 71982 69039(93.29) 4981(6.73) 74020 0.16 b) Improved 30003(85.78) 4975(14.22) 34978 41962(90.70) 4303(9.30) 46265 5.59 3. Total Chicken
below 5 months
98133(91.75) 8828(8.25) 106961 111001(92.28) 9284(7.72) 120285 2.05
Desi for eggs 28.142(93.53) 1946(6.47) 30088 42581(93.54) 2940(6.46) 45521 8.35 Desi for meat 13058(94.25) 797(5.75) 13855 29610(93.50) 2060(6.50) 31670 17.53 Total 60494(95.50) 2848(4.50) 63342 72191(93.52) 5000(6.48) 77191 3.82 a) Improved for eggs 10800(86.44) 1694(13.56) 12494 22136(87.66) 3115(12.34) 25251 14.89 b)Improved for meat 5600(86.81) 851(13.90) 6451 15245(86.78) 2322(13.22) 17567 21.57 Total 18335(86.69) 2814(13.31) 21149 37381(87.30) 5437(12.70) 42818 14.84 Total chicken 78829(93.30) 5662(6.70) 84491 109572(91.30) 10437(8.70) 120009 7.03 Total 215480(92.76) 16815(7.24) 232295 261250(91.98) 22775(8.02) 284025 2.50
Data Source: Basic Animal Husbandry Statistics 2009 (AHS Series-7) (I did not find the indication of this reference)
Table 2 – Regional Distribution of Poultry Birds (Population in ‘000.)
Regions/State (2010-11) Productivity
A. Northern Region Desi birds population
% of all India Desi
birds
Improved birds population
% of all India Improved bird’s
population
Total No. of birds
% of all India total population
Desi Improved
1. Haryana 344 0.48 2695 3.69 3039 2.10 144 217
2. Himachal 227 0.32 147 0.20 374 0.26 168 195
3. J&K 1377 1.92 396 0.54 1773 1.23 162 200
4. Punjab - 12011 16.42 12011 8.30 - 203
5. Uttar Pradesh 2590 3.62 1195 1.63 3785 2.62 128 234
Regional Total 4538 6.34 16444 22.48 20982 14.51 150.5 209.8
B. Western Region
1. Gujarat 1351 1.89 1349 1.84 2700 1.87 95 252
2. Rajasthan 981 1.37 1262 1.73 2243 1.55 106 240
3. Maharashtra 10120 14.14 5187 7.09 15307 10.58 113 263
4. Madhya Pradesh 4052 5.66 3788 5.18 7840 5.42 97 199
Regional Total 16504 23.06 11586 15.84 28090 19.42 100 238
C. Southern Region
1. Andhra Pradesh 8035 11.23 16225 22.19 24260 16.77 117 278
2. Karnataka 6980 9.75 3221 4.40 16201 7.05 96 249
3. Kerala 4113 5.75 6287 8.60 10400 7.19 121 205
4. Tamil Nadu 4481 6.25 11464 15.68 15945 11.02 88 232
Regional Total 23609 32.98 37201 50.87 66806 42.03 100 241
D. Eastern Region
1. Bihar 7970 11.14 3041 4.16 11011 7.61 88 187
2. Orissa 3731 5.21 1063 1.45 4794 3.31 91 205
3. West Bengal 10655 14.89 1782 2.44 12437 8.60 114 268
4. Assam 2661 3.72 394 0.54 3055 2.11 83 183
5. Nagaland 216 0.30 143 0.20 359 0.25 79 180
Regional Total 25233 34.26 64.23 8.79 31656 21.88 91 204
All India 71558 73127 144685 106 233
100 100 100 100
The funds allocated for poultry farming development during the various plans are minimal. However, the poultry sector has achieved production goals satisfactorily. The stage of poultry farming development in different states reveals that in most of the states, the poultry sector is still not well developed. Only few states like Andhra Pradesh, Maharashtra, Haryana, Punjab, Tamil Nadu and Gujarat have significant poultry production.
The study on poultry production cost reveals that feed is the main cost component, followed by other items, such as cost of one-day-old chick, cost of medication and labor cost. The marketing channel is well organized and operates in a fairly competitive environment. The prices in wholesale market, as well as in the retail market, over the years, have increased at a significant rate. The price series correlation in the
wholesale and retail market during the period under study remained positive and significantly high, which implies that wholesale and retail markets showed strong integration in the commodity market and the price movements in one market are fully transmitted to other markets.
REFERENCES
Basic Animal Husbandry Statistics. Department of Animal Husbandry, Dairying & Fisheries, Ministry of Agriculture, Government of India; 2012.
Bhardwaj SP, Nirman KPS, Pandey RK, Kaushik MS. Study of Marketing of Broilers in Haryana. Indian Journal of Agricultural Marketing 1996;10(2):118.
Bhardwaj SP, Mahajan VK, Pandey RK. Study of cost Behaviour and Marketing Margins in Poultry Production - A case study of Broilers, Indian Journal of Agricultural Marketing Conference special p.72-73.
Department of Animal Husbandry. India; 2012 Nov. Table 3 – Regional Growth in Egg Production
Period 1999-2000 Period 2000-01 Period 2001-02
Region/States Compound Growth
Simple
Growth R 2
Compound Growth
Simple
Growth R 2
Compound Growth
Simple
Growth R 2 A. Northern Region
1. Haryana 2.98** 1.09** 0.73 2.91* 1.07* 0.77 2.96** 2.08** 0.92
2. H.P. 3.03** 1.09** 0.98 2.25* 1.05* 0.78 2.94** 1.07** 0.96
3. J & K 2.76* 1.01* 0.25 2.87** 1.05** 0.90 2.82** 1.03** 0.86
4. Punjab 3.12** 1.14** 0.98 2.92** 1.07** 0.97 3.03** 1.11** 0.97
5. Chandigarh 2.82* 1.03 0.33 2.55* -1.05* 0.54 2.73 1.00 0.01
6. Delhi 2.72 1.00 0.12 2.88* 1.05* 0.61 2.72 1.00 0.2
7. Uttar Pradesh 2.80** 1.03** 0.95 2.85** 1.05** 0.93 2.86** 1.05** 0.97 B. Western Region
1.Goa 2.91* 1.06* 0.65 2.79* 1.02* 0.76 2.82** 1.03** 0.72
2. Gujarat 2.85** 1.04** 0.84 2.80* 1.03* 0.75 2.90** 1.96** 0.93
3. Rajasthan 2.92** 1.07** 0.95 2.99** 1.09** 0.95 2.90** 1.08** 0.98
4. M.P. 2.91* 1.06* 0.78 2.83** 1.04** 0.96 2.89** 1.06** 0.94
5. Maharashtra 2.88** 1.06** 0.99 2.84** 1.04** 0.98 2.87** 1.05** 0.99 C. Southern Region
1. Andhra Pradesh 2.97** 1.09** 0.93 2.92** 1.07** 0.86 2.91** 1.07** 0.95 2. Karnataka 2.88** 1.06** 0.99 2.83** 1.04** 0.94 2.84** 1.04** 0.98
3. Kerala 2.86** 1.05** 0.93 2.82** 1.03* 0.53 2.83** 1.04** 0.89
4. Tamil Nadu 3.14** 1.14** 0.85 2.79** 1.92** 0.87 2.96** 1.08** 0.85 D. Eastern Region
1. Arunachal 2.79** 1.02** 0.87 2.73 1.00 0.14 2.72 1.00 0.02
2. Assam 2.87** 1.05** 0.92 2.77** 1.01* 0.60 2.81** 1.03** 0.89
3. Bihar 2.93** 1.07** 0.98 2.12** 1.00** 0,88 2.82** 1.03** 0.84
4. Manipur 2.97** 1.09** 0.93 2.68 -1.01 0.34 284** 1.05** 0.78
5. Meghalaya 2.99** 1.09** 0.91 2.80** 1.03** 0.98 2.86** 1.05** 0.85
6. Mizoram 2.60* -1.04 0.04 3.38 1.22 0.46 2.83* 1.04* 0.11
7. Nagaland 2.99** 1.09** 0.85 2.79** 1.02** 0.86 2.95** 1.08** 0.91
8. Orissa 2.76* 1.01* 0.17 2.91** 1.07** 0.86 2.86** 1.05** 0.84
9. Tripura 2.85** 1.04** 0.96 2.94** 1.07** 0.93 2.85** 1.04** 0.94 10. West Bengal 3.15** 1.14** 0.92 2.78** 1.02** 0.96 2.92** 1.07** 0.80
11. Sikkim 3.20** 1.16* 0.76 2.85** 1.04** 0.94 3.04** 1.11** 0.87
All India 2.96** 1.08** 0.98 2.84** 1.04** 0.98 2.90** 1.06** 0.97
Vetrivel SC
Chandrakumarmangalam S The Role of Poultry Industry in Indian Economy
Table 4 – Poultry production (Period 2000-01 to 2009-10)
Desi Birds Improved Birds
Region/State Mean Std.dev. C.V. Mean Std. Dev. C.V.
1. Northern Region
Haryana 145.875 12.3 8.5 203.250 15.173 7.456
H.P. 156.875 11.344 7.231 183.375 7.425 4.049
U.P. 123.500 3.251 2.633 182.000 32.562 17.891
2. Western Region
Gujarat 88.125 3.681 4.178 240.125 7.699 3.206
M.P. 113.600 28.315 24.927 199.000 18.924 9.512
Maharashtra 116.250 1.909 1.642 247.625 37.705 15.227
Rajasthan 99.625 6.163 6.186 240.625 0.916 0.381
3. Southern Region
A.P. 138.625 11.722 8.456 278.750 22.575 8.099
Karnataka 46.895 1.356 1.399 248.375 0.518 0.208
Kerala 115.500 6.141 5.317 201.750 4.062 2.013
T.N. 93.000 17.760 19.097 231.625 7.110 3.070
4. Eastern Region
Bihar 87.250 0.886 1.016 185.750 2.816 1.516
Manipur 62.875 4.794 7.625 109.375 11.538 10.549
Meghalaya 107.750 1.982 1.840 213.250 8.190 3.841
Mizoram 74.875 2.100 2.805 126.250 9.146 7.244
Nagaland 77.375 2.264 2.926 176.875 8.061 4.557
Orissa 94.000 1.773 1.886 206.125 20.003 9.704
Data Source: Basic Animal Husbandry Statistics – 2012
Goutard F, Magalheas RS. Risk and consequence assessment of HPAI. CIRAD; 2006. Feb.
Headley JC. Economics of Scale and Size in Floor Managed Laying Flocks. World Agril. Economics and rural Sociology Abstract 1964;6(3):1964.
Hunter R. The Commercial Egg Industry, Fewer Farm Supply on Egg. Quarterly Review of Rural Economy 1981;3(4):351-358.
Iqbaluddin (1996) Poultry development policies and planning for higher production environmental production income and employment. Proceedings of the 20th World Poultry Congress; 1996 Sept 25; New Delhi. India. v.111, p.333-342.
Business News. National Agricultural Cooperative Marketing Federation of India. New Delhi; 2010 Apr.
Pandey RK, Bhardwaj SP, Mahajan VK, Nirman KPS. Economic Study of Poultry Production in India. Proceedings of the 20th World Poultry Congress; 1996 Sept 2-5; New Delhi. India. v.3, p.527-34.
Pandey RK, Bhardwaj SP, Nirman KPS, Mahajan VK. Economic Analysis of Price Behaviour and Marketing of Eggs. Indian Journal of Agricultural Marketing 1996b; 3: 343-357.
Seetharaman. The role of Poultry Co-operation in India. Proceedings of the 20th World Poultry Congress; 1996 Sept 2-5; New Delhi. India. v.3, p.343-357.