Cyclic alternating pattern in normal
children aged 12 to 24 months
Gabriela Rodrigues Alves1, Agostinho Rosa2,
Magneide Brito1, Marcia Pradella-Hallinan1, Sergio Tuik1
ABSTRACT
Objective: The aim of this study is to complement existing data on the expression and characteristics of cyclic alternating pattern (CAP) in children, specifically in the 12 to 24 month age bracket. Method: Descriptive study. Settings: a university pediatric sleep laboratory. Participants: Twelve normal and healthy subjects (6 girls and 6 boys, mean age 18.9±4.72 months; range 12-24 months underwent a standard polysomnography night recording in our pediatric sleep laboratory. Sleep stages and CAP were analyzed according to standard international rules. Results: CAP rate found in children of 12 to 24 months of age was (25.78±10.18%) and it is characterized by a linear increase of 2% per month, from 12% at 12 months reaching 35% at 24 months. With coefficient of determination R2 of 0.91. The duration of A phases was 6.93±1.06 seconds, and B phases was found to last 21.44±2.31 seconds. The number of CAP cycles was 173.25±73.85 with an average index per hour of 33.55±14.61. The number of CAP sequences reached 25.25±9.55 per recording. CAP rate for the different type of A phases are (21.83±9.68%), for A1, (2.43±2.30%) for A3 and (1.67±1.11%) for A2. Conclusion: Our study provides normative data on CAP in a group of young children (12 to 24 months). The most salient result of this study is the strong correlation of CAP rate of 2% per month in this age group.
Key words: cyclic alternating pattern, children, sleep.
Padrão alternante cíclico em crianças normais de 12 a 24 meses
RESUMO
Objetivo: O objetivo deste estudo é complementar os dados normativos sobre a expressão e as características do padrão alternante cíclico (CAP) em crianças, especificamente na faixa etária de 12 para 24 meses. Método: Estudo descritivo. Participantes: Doze indivíduos normais e saudáveis (6 meninas e 6 meninos, entre 12-24 meses de idade (média de 18,9±4,72 meses), foram submetidos a uma noite de gravação de polissonografia em nosso laboratório de sono pediátrico. As fases do sono e CAP foram analisados de acordo com padrão e normas internacionais. Resultados: A taxa máxima encontrada em crianças de 12 a 24 meses de idade foi de (25,78%±10,18) e é caracterizada por um aumento linear de 2% ao mês, a partir de 12% em 12 meses atingindo 35% em 24 meses de idade. A duração da fase A foi de 6,93±1,06 segundos, e nas fases B foi encontrado a média de 21,44±2,31 segundos. O número de ciclos CAP foi 173,25±73,85, com um índice médio por hora de 33,55±14,61. O número de sequências CAP chegou a 25,25±9,55 por registro. Os índices dos subtipos de fases A foram (21,83%±9,68), para a A1, (2,43%±2,30) para a A3 e (1,67%±1,11) para A2. Conclusão: Nosso estudo fornece dados normativos sobre CAP em um grupo de crianças (12 a 24 meses de idade). O resultado mais saliente deste estudo é a forte correlação entre taxa do CAP e idade, mostrando que a cada mês ocorreu o aumento de 2%.
Palavras-chave: padrão alternante cíclico, crianças, sono. Correspondence
Gabriela Rodrigues Alves Instituto do Sono, Departamento de Psicobiologia
Rua Marselhesa 500 / 14° andar 04020-060 São Paulo SP - Brasil E-mail: [email protected]
Received 5 January 2010 Received in final form 16 April 2010 Accepted 26 April 2010
1Department of Psychobiology, Federal University of São Paulo, São Paulo SP, Brazil; 2Evolutionary Systems and Biomedical
A limited number of studies have been conducted in order to analyse normal sleep architecture in children and assess more speciic patterns such as cyclic alternating pattern (CAP).
It is known that as weeks and months of life go by EEG pattern changes. he graphic physiological characteristic of sleep evolves thereby enabling non rapid eye move-ments (NREM) stages to be identiied. We believe that by only assessing sleep macrostructure, we can lose impor-tant data regarding the maturation of electroencephalo-gram patterns during sleep. We believe that CAP studies can be a crucial tool to evaluate the instability, sleep frag-mentation, maturation and EEG development in children. CAP analysis and other criteria related to arousal clas-siication are necessary where they set out to quantify the ratio between sleep fragmentation and its neurocognitive consequences. A child with sleep disorders such period-ic leg movements, as apnea and snoring, diferent from adults, do not present signiicant alterations in sleep mac-rostructure.
Cyclic alternating pattern is a normal physiological elec-troencephalogram pattern which is commonly observed in healthy subjects during NREM sleep1. It is characterized
by periodical recurrence of phasic morphological patterns which are compounded by the alternation of activation phases (A phase) followed by inhibition phases (B phase)2.
hree main EEG A phase patterns were described: A1 subtype has a predominance of synchronized EEG activi-ty. In the A3 subtype, the opposite situation revealing the predominance of EEG desynchronization can be found. he A2 subtype is represented by a combination of both A1 and A3 subtypes. hese subtypes have diferent inter-pretations: A1 subtype is involved in the building up and maintenance of deep NREM sleep and can have a protec-tive role for sleep continuity; A2 and A3 can be involved in NREM activity and display the function of maintain-ing subject arousability2.
Few studies are found of CAP in childhood and youth, Bruni3,4 described the default of CAP in pre school and
school children, Lopes5 in peripubertal and Miano6 studied
the CAP in infants from 1 to 4 months of age. here are no studies showing a consistent CAP pattern rate in the very young age range. In order to ofer a comprehensive over-view of CAP development in the irst years of life, the aim of this study was to describe CAP pattern in children of 12 to 24 months of life. It is argued that such an approach can become a new tool to help further our understanding of normal sleep and its disorders within this age range.
METHOD
Volunteers
Following an announcement using standard media communication, nineteen parents of children aged
be-tween 12 and 24 months (without sleep-related com-plaints), contacted the Sleep Institute (Sleep Laborato-ry of Psychobiology Department from Federal Universi-ty of São Paulo, São Paulo SP - Brazil) with a view to par-ticipating in the study.
We applied the “Sleep Disturbance Scale for Children” which is a questionnaire which requires information on behaviour and general medical conditions such as dis-eases and use of medication. he second part involves scale items which indicate values from 1 to 5 for the fre-quency of each airmation regarding sleep, such as before and during sleep behaviour, respiratory disorders and in-vestigation of neurological disorders along with received medication.
Selected children had no sleep disorder and no severe diseases. All volunteers with history of prematurity and anoxia were excluded. No child took medication at the time of the study. All participants were required to fol-low sleep laboratory routine regarding good sleep habits one week before the study. By the day of the study, normal daily activities of the children were maintained.
Only 12 children (six boys and six girls) met the in-clusion criteria. Parent or care giver signed the informed consent form for this study and adhesion to it was a vol-untary act. he present study was approved by the Ethics Committee of the Federal University of São Paulo.
Polysomnograic recordings (PSG)
Sleep recordings ware performed in a standard labo-ratory setting of Sleep Institute’s Psychobiology Depart-ment, UNIFESP. We endeavoured to maintain normal dai-ly activities before sleep time including normal physical activities and alimentary habits. he recordings were con-ducted with a minimum duration of 7 hours. All children went to bed at their usual sleep time. he end of the re-cording occurred in the morning spontaneously. We per-formed subjective assessment of sleep quality by means of post-sleep questionnaires in which the parent or care giv-er attributed a value regarding his/hgiv-er pgiv-erception of how successful the night had been for the child in question. All rooms had acoustic insulation to keep possible ex-ternal noise under control. Ambient temperature ranged between 20°C to 23°C. Children slept in separate beds from their parent or care giver in order to avoid any in-terference in the recording.
abdominal belts, and pulse oximetry. Each recording was exported into the European Data Format and the Somno-logica (Flaga-Medcare, Reykjavik, Iceland) software was used to assess sleep and CAP.
Criteria for sleep architecture classiication and CAP
Recordings were scored by the agreement of two ex-perienced sleep investigators, based or Rechtschafen and Kales7 criteria. he arousal events were scored according
to American Sleep Disorders Association8. Sleep
macro-structure was scored based or conventional parameters such as sleep eiciency, TST (total sleep time), sleep onset latency (delay time from saying good night or lights out to the three consecutive epochs of stage 1 NREM sleep or any other sleep stage), total duration of sleep stages (1, 2, 3 and 4 NREM sleep) and REM sleep total duration.
CAP was classiied visually based or the criteria de-scribed by Terzano et al.9. However some adaptation was
needed regarding this age range for the subtypes classii-cation (A1, A2 and A3), and some auxiliary EEG channels were used (O1-A/M2 or O2-A/M1) along with EMG and ECG. Due to the non occurrence of physiological alpha rhythms in the studied age range, we decided to use the most prevalent rhythm - theta (4-7 Hz) for CAP classii-cation. We classiied A1 subtype when theta rhythm was detected in the central channels and when no cardiorespi-ratory repercussion was observed or no concurrent in-crease in EMG was noted. We further classiied this sub-type when theta rhythm was detected in the central and occipital channels and when there was cardiorespiratory repercussion and/ or enhancement of EMG tone A2 or A3 subtypes, depending on their duration.
Statistical analysis
he Mann-Whitney U test was used for identifying sex differences. Regarding the three subtypes of CAP phases, we reported the absolute number, relative per-centage and mean duration in seconds. We also assessed the frequency per hour (index) and the mean duration of CAP phases in the diferent NREM sleep stages.
Two-dimensional plotting of the interval (in seconds) distribution of A1 and A2+A3 phase was also obtained in order to establish the mean interval values and to assess whether a preferential distribution can be observed from diferent distributions. Linear regression was performed to model the relationship between CAP rate and Age. he software system STATISTICA (StatSoft, Inc. 2004, ver-sion 6) was used for statistical analysis.
RESULTS
The mean age of the study group was 18.9±4.72 months. Sleep quality in the laboratory was considered
satisfactory when evaluated by parent or care giver in the morning following the polysomnographic recording.
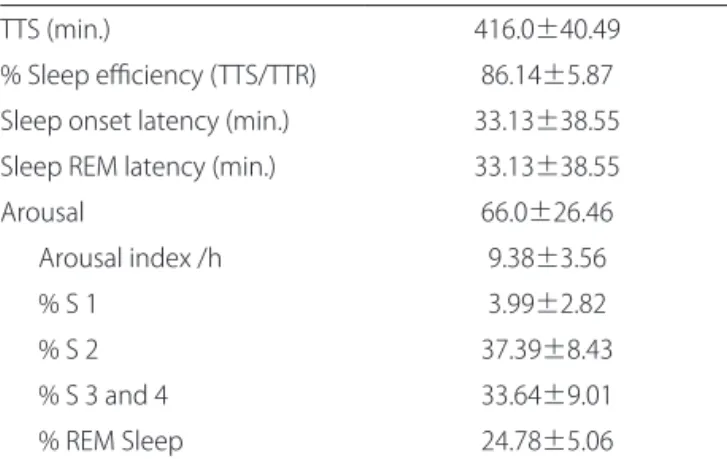
he mean total sleep time was 416.0±40.49 minutes and the mean of stage 1 NREM sleep was 3.99±2.82; stage 2 was 37.39±8.43. he sum of the mean values for stages 3 and 4 was 33.64±9.01and REM sleep produced 24.78±5.06 minutes (Table 1).
The mean CAP rate found is (25.78%±10.18) at 12 months its value is 12% and reaching 35% at 24 months. he CAP rate was found by linear regression to exhibit a gradual increase of 2% per month with age [regression curve is CAP (%); y=1.94722 × (age in months) – 10.734]. (Figure) and the Pearson´s coeicient of determination r2
is 0.9092 with p<0.001.
CAP analysis revealed that the duration of A phases was 6.93±1.06 seconds while B phases scored 21.44±2.31 seconds. he number of CAP cycles was 173.33±73.80 and the mean index of CAP cycles per hour in the
pres-Table 1. Sleep parameters in 12 children.
TTS (min.) 416.0±40.49
% Sleep eiciency (TTS/TTR) 86.14±5.87 Sleep onset latency (min.) 33.13±38.55 Sleep REM latency (min.) 33.13±38.55
Arousal 66.0±26.46
Arousal index /h 9.38±3.56
% S 1 3.99±2.82
% S 2 37.39±8.43
% S 3 and 4 33.64±9.01
% REM Sleep 24.78±5.06
TTS: total sleep time; TTR: total recording time; REM: rapid eye movements.
45 40 35 30 25 20 15 10 5 0
CAP (%)
0 5 10 15 20 25 30
Age (months)
y = 1.9472× – 10.734 R2 = 0.9092
CAP Linear (CAP)
ent study was 33.55±14.61. he total number of A phas-es is (2080), A1 is the most dominant (1805), followed by A3 (160) and (115) A2. he CAP rate was 25.78±10.18% and phase A1 subtype had an higher contribution 21.83± 9.68%, then phase A3 2.43±2.30% and phase A2 with 1.67±1.11%. We did not find significant differences in CAP rate related to gender (Table 2).
CAP rate in stage 1 NREM sleep was 6.88±10.41, in stage 2 this was 14.39±8.67; 39.29±23.37 in stage 3 and 47.87±18.73 in stage 4. We observed that CAP rate in-creases as sleep becomes deeper.
he A phases duration according to sleep stages were distributed as follows: stage 1 NREM sleep was 7.56±1.77 seconds; stage 2 was 6.27±1.73 seconds, in stages 3 and 4 was 11.30±3.14 seconds.
A high percentage of A1 subtype was observed in sleep stage 4 (45.88±19.01%) when compared to stage 1 (8.72±7.01%).
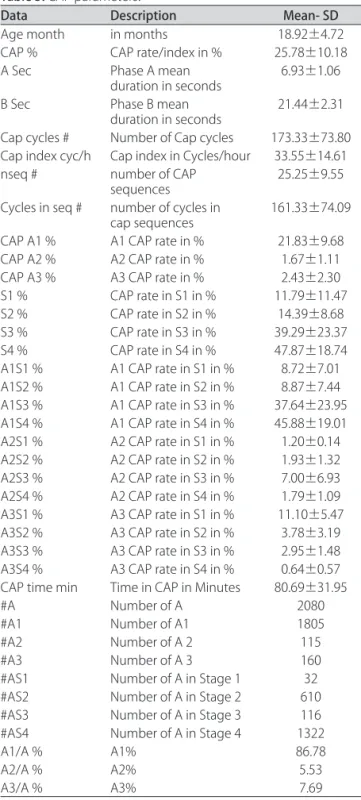
Table 3 shows a comprehensive overview of CAP pa-rameters.
DISCUSSION
Our study is to our knowledge the irst one to anal-yse CAP normative data in the 12 to 24 month of life age range.
Some adaptation was needed regarding this age range for the subtypes classiication (A1, A2 and A3), In the present study we considered the need of using auxiliary channels besides other EEG channels (O1-A2, O2-A1), EMG submental, ECG and respiratory frequency due to the absence of alpha rhythm in EEG. heta rhythm was used to classify A1, A2 and A3 subtypes.
Parrino10 initially hypothesized that CAP rate shows
a U-shaped curve throughout the life cycle, and as-sumed that by birth time, CAP rate is 100%. he curve showed a nadir of 38% in young adults (20 to 39 years old) and an increased rate higher than 60% for elderly population. Normative studies in children do not rein-force this hypothesis, where the % CAP rate in children of age pre school5 is (25.93+13.51%), up at school age to6
Table 2. Relationship between CAP, age and gender.
Gender Months CAP Rate % Gender Months CAP Rate %
F 12 9.5 M 12 15.6
F 14 9.5 M 16 21.5
F 17 26.1 M 20 28.2
F 18 23.2 M 23 31.3
F 23 38.6 M 24 36.0
F 24 36.8 M 24 33.1
Mean-SD 18.00±4.77 23.95±12.67 Mean-SD 19.83±4.92 24.72±9.99 CAP: cyclic alternating pattern; SD: standard deviation.
Table 3. CAP parameters.
Data Description Mean- SD
Age month in months 18.92±4.72
CAP % CAP rate/index in % 25.78±10.18
A Sec Phase A mean
duration in seconds 6.93±1.06
B Sec Phase B mean
duration in seconds 21.44±2.31 Cap cycles # Number of Cap cycles 173.33±73.80 Cap index cyc/h Cap index in Cycles/hour 33.55±14.61 nseq # number of CAP
sequences 25.25±9.55
Cycles in seq # number of cycles in
cap sequences 161.33±74.09 CAP A1 % A1 CAP rate in % 21.83±9.68
CAP A2 % A2 CAP rate in % 1.67±1.11
CAP A3 % A3 CAP rate in % 2.43±2.30
S1 % CAP rate in S1 in % 11.79±11.47
S2 % CAP rate in S2 in % 14.39±8.68
S3 % CAP rate in S3 in % 39.29±23.37
S4 % CAP rate in S4 in % 47.87±18.74
A1S1 % A1 CAP rate in S1 in % 8.72±7.01 A1S2 % A1 CAP rate in S2 in % 8.87±7.44 A1S3 % A1 CAP rate in S3 in % 37.64±23.95 A1S4 % A1 CAP rate in S4 in % 45.88±19.01 A2S1 % A2 CAP rate in S1 in % 1.20±0.14 A2S2 % A2 CAP rate in S2 in % 1.93±1.32 A2S3 % A2 CAP rate in S3 in % 7.00±6.93 A2S4 % A2 CAP rate in S4 in % 1.79±1.09 A3S1 % A3 CAP rate in S1 in % 11.10±5.47 A3S2 % A3 CAP rate in S2 in % 3.78±3.19 A3S3 % A3 CAP rate in S3 in % 2.95±1.48 A3S4 % A3 CAP rate in S4 in % 0.64±0.57 CAP time min Time in CAP in Minutes 80.69±31.95
#A Number of A 2080
#A1 Number of A1 1805
#A2 Number of A 2 115
#A3 Number of A 3 160
#AS1 Number of A in Stage 1 32
#AS2 Number of A in Stage 2 610
#AS3 Number of A in Stage 3 116
#AS4 Number of A in Stage 4 1322
A1/A % A1% 86.78
A2/A % A2% 5.53
A3/A % A3% 7.69
(33.43+5.27%) and reaches a peak (62.1+10.8%) peripu-bertal children7, these data suggest that the CAP rate
tends to increase from a few months after birth until pu-berty. Our study and our data follow the same trend of available normative studies in children, showing that the CAP rate in children of 12 to 24 months of life is between the younger and older ones.
Normative studies of the pattern of CAP in healthy newborns and infants are not available yet. A recent re-search using 3-hour video-electroencephalographic EEG-polygraphic recording, analysis concluding that CAP is not possible before 46 weeks of life due to lack of sleep grafoelements such as sleep spindles and delta when the pace is during quiet sleep (QS) demonstrating in posteri-or regions, diferent patterns of the CAP where nposteri-ormally involve the central and frontal9. Given the lack of data on
the 6-11 month and 25-35 month age brackets, addition-al studies are necessary to ill the gaps. Nevertheless addition-all these studies have been performed with a limited num-ber of data, so their conclusions shell be conirmed and reinforced with further and larger studies.
It was seen that in children 12 to 24 months have greater expression in terms of subtype A1 of CAP (86.78%) in diferent stages of sleep, also showing greater quanti-ty during stage 4 (63.56%) of sleep NREM (deep sleep). Our data and studies in children at school age, reported an increase in the percentage of A1 (84.45%), strength-en the hipothesis that the CAP can be a marker of thal-amocortical interactions and maturation of brain activity.
Ferri11 reported that the slow components of CAP
(A1) could be considered as the expression of cortical synchronizing mechanisms during sleep of NREM. he
slow wave sleep may promote the formation of thalamo-cortical networks providing endogenous neural signals with repetitive and synchronized activity. he gradual maturation of thalamocortical networks could drive the gradual emergence of a pattern of alternating slow EEG activity. he obtained results reinforce the hypothesis that CAP rate increases from the irst year of life until puberty. Our results attempt to bridge the existing gap in the liter-ature by providing more data regarding CAP rate curve in the studied age range.
REFERENCES
Terzano MG, Mancia D, Salati MR, et al. The cyclic alternating pattern as a 1.
physiologic component of normal NREM sleep. Sleep 1985;8:137-145. Terzano MG, Parrino L. Origin and signiicance of the cyclic alternating pat-2.
tern (CAP). Sleep Med Rev 2000;4:101-123.
Bruni O, Ferri R, Miano S, et al. Sleep cyclic alternating pattern in normal pre-3.
school-aged children. Sleep 2005;28:220-230.
Bruni O, Ferri R, Miano S, et al. Sleep cyclic alternating pat tern in normal 4.
school-age children. Clin Neurophysiol 2002;113:1806-1814.
Lopes MC, Rosa A, Roizenblatt S, et al. Cyclic alternating pattern in peripu-5.
bertal children. Sleep 2005;28:215-219.
Miano S, PiaVilla M, Blanco D, et al. Development of nremsleep instability-6.
continuity (cyclic alternating pattern) in healthy term infants aged 1 to 4 months . Sleep 2009;32:83-90.
Rechtschafen A, Kales A. Manual of standardized terminology: techniques 7.
and scoring system for sleep stages of human subjects. Los Angeles: UCLA Brain Information Service / Brain Research Institute; 1968.
EEG Arousals: scoring rules and examples. An American Sleep Disorders As-8.
sociation Report. Sleep 1992;15:173-184.
Terzano MG, Parrino L, Smerieri A, et al. Consensus report: at las, rules, and re-9.
cording techniques for the scoring of cyclic alter nating pattern (CAP) in hu-man sleep. Sleep Med 2001;2:537-553.
Parrino L, Boselli M, Spaggiari MC, Smerieri A, Terzano MG. Cyclic alternating 10.
pattern (CAP) in normal sleep: polysomnographic parameters in diferent age groups. Electroencephalogr Clin Neurophysiol 1998;107:439-450. Ferri R, Bruni O, Miano S, Terzano MG. Topographic mapping of the spec-11.