Abdul Kadir
1, Lukito Edi Nugroho
2, Adhi Susanto
3and Paulus Insap Santosa
4Department of Electrical Engineering, Gadjah Mada University, Yogyakarta, Indonesia 1
2
3
4
A
BSTRACTThis paper proposed a method that combines Polar Fourier Transform, color moments, and vein features to retrieve leaf images based on a leaf image. The method is very useful to help people in recognizing foliage plants. Foliage plants are plants that have various colors and unique patterns in the leaf. Therefore, the colors and its patterns are information that should be counted on in the processing of plant identification. To compare the performance of retrieving system to other result, the experiments used Flavia dataset, which is very popular in recognizing plants. The result shows that the method gave better performance than PNN, SVM, and Fourier Transform. The method was also tested using foliage plants with various colors. The accuracy was 90.80% for 50 kinds of plants.
K
EYWORDSColor Moments, Plant Retrieval, PFT (Polar Fourier Transform), PNN, SVM, Vein features
1.
I
NTRODUCTIONSeveral researches in leaf identification have been explored, but there are still many challenges for researchers to try other approaches for better performance of the identification system. A certain method may give good performance in specific samples of leaves, but does not guarantee to perform good result for other ones. For example, ignoring colors in recognizing a foliage leaf is too risky. Sometime it is found that two or more plants have leaves with similar or same shape, but different colors. In that case, color features cannot be neglected.
Therefore, a proposed method was accomplished to retrieve plants based on a leaf query using combination features: Polar Fourier Transform (PFT), colour moments, and vein of leaf. PFT is used to handle the shape of the leaf, colour moments are used to capture color information, and features extracted from the leaf’s vein are used to improve performance of the retrieval system. This approach can be used to identify a leaf and also give top five of plants that have similar properties to the leaf query.
method was also tested using 50 kinds of foliage plants that contain various colors. The average accuracy is 90.80%.
The remainder is organized as follows: Section 2 discusses related works, Section 3 describes all features used in the research, Section 4 explains how the mechanism of experiments is accomplished, Section 5 presents the experimental results, and Section 6 concludes the results.
2.
R
ELATEDW
ORKSSeveral researches in plant identification are described here. Warren [3] create a system that can measure the length and width of Chrysanthemum leaf and assesses several descriptive characters including the shape of the leaf apex, the shape of the base, the degree to which the margin is serrated and the depth and shape of the leaf’s lower sinus. Wu et al. [4] identified 6 species of plants. No color information was processed. They used aspect ratio, leaf dent, leaf vein, and invariant moment to identify plant. Wang et al. [5] used centroid-contour distance as shape features. Du et al. [6] captured the leaf shape polygonial approximation and algorithm called MDP (modified dynamic programming) for shape matching. Wu et al. [1] proposed an algorithm for plant recognition using Probabilistic Neural Network (PNN). They used 12 geometric features of leaf as input of identification system. By using 32 kinds of plants, the system has average accuracy 90,312%. The PNN algorithm is very fast to identify a leaf. However, manual processing should be done to locate the two terminal points of the leaf. Other researches, such as Singh et al. [2] proposed Support Vector Machine (SVM) to improve the performance of the indentification system, based on data came from Wu et. al [1], and Zulkifli [7] worked on 10 kinds of leaves and uses invariants moments as features to recognize them. The previous researchers did not incorporated color features in recognizing plants, but Man et al. did [8]. Man et. al. used features came from color and texture features and utilized SVM for classification. The accuracy of their system is 92% for 24 categories.
Other features that are incorporated in recognizing plants are extracted from vein of leaf (venation). Nam et al. [9] used shape and venation for leaf image retrieval. They used MPP (Minimum Perimeter Polygons) algorithm to solve the shape of the leaf and the type of venations as venation features. Li et al. [10] used ICA (Independent Component Analysis) to extract leaf vein. Other approach has done by Wu et al. [1], by performing morphological opening on grayscale image with flat, disk-shaped structuring element of radius 1, 2, 3, and 4. Then, by subtracting remaining image by the margin, the appearance of vein like image is obtained. That operation is quite simple and fast.
Meanwhile, Polar Fourier Transform (PFT) has been introduced in [11] to recognize 52 kinds of foliage plants. Compared to other methods (moment invariants and Zernike moments), PFT is prospective for recognizing shape of plants. However, using PFT only for foliage plant retrieval is not enough. Foliage plants mean that plants have leaves with unique shape, fancy pattern, or attractive colors. Therefore, handling color for features is a must, because some leaves of different species have same patterns but different colors.
3.
F
EATURESF
ORP
LANTR
ETRIEVAL3.1. Polar Fourier Transform
)] 2 ( 2 exp[ ) , ( ) , (
2 ρφ ρφ π ρ πφ
T R r j f PF
r i i +
= (1)
where
• 0<r<R dan θi= i(2π/T) (0<i<T);0<ρ<R, 0<φ<T,
• R is radial frequency resolution,
• T is angular frequency resolution.
How to compute PFT described as follow. For example, there is an image I = {f(x, y); 0<x<M, 0<y<N}. Firstly, the image is converted from Cartesian space to polar space Ip = {f(r,θ); 0<r<R,
0<θ<2π }, where R is the maximum radius from centre of the shape. The origin of polar space becomes as centre of space to get translation invariant. The centroid (xc, yc) calculated by using
formula: − = − = = = 1 0 1 0 , 1 , 1 N x c M x c y N y x M
x (2)
In this case, (r,θ) is computed by using:
c c c c x x y y y y x x r − − = − + −
= ( )2 ( )2,θ arctan
(3)
Rotation invariance is achieved by ignoring the phase information in the coefficient. Consequently, only the magnitudes of coefficients are retained. Meanwhile, to get the scale invariance, the first magnitude value is normalized by the area of the circle and all the magnitude values are normalized by the magnitude of the first coefficient. So, the Fourier descriptors are:
} ) 0 , 0 ( ) , ( ,..., ) 0 , 0 ( ) 0 , ( ,..., ) 0 , 0 ( ) , 0 ( ,..., ) 0 , 0 ( ) 1 , 0 ( , 2 ) 0 , 0 ( { 2 PF n m PF PF m PF PF n PF PF PF r PF FDs π
= (4)
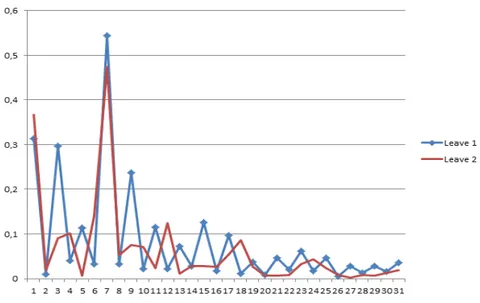
where m is the maximum number of the radial frequencies and n is the maximum number of angular frequencies.
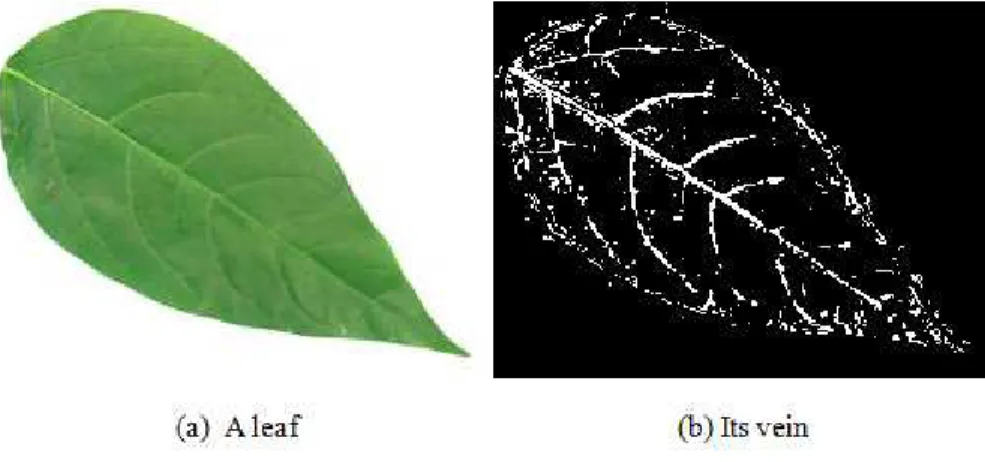
Fig. 1 shows two kinds of leaves and Fig. 2 denotes the Fourier descriptors of the two leaves. In this case, the radial frequency is equal 4 and the maximum number of angular frequencies is equal 6.
Figure 2. Example of Fourier descriptors
3.2. Color Moments
Color moments represent color features to characterize a color image. For example, it was used for skin texture recognition [13] and for image retrieval [14]. Features can be involved are mean (µ), standard deviation (σ), and skewness (θ). For RGB color space, the three features are extracted from each plane R, G, and B. The formulas to capture those moments:
= =
= M
i N
j ij
P
MN 1 1
1
µ
= =
− =
M
i N
j ij
P
MN 1 1
2 ) ( 1
µ
σ
3
1 1
3 ) ( 1
= =
− =
M
i N
j ij
P
MN
µ
θ
M and N are the dimension of image. Pij is values of color on column ith and row jth.
3.3. Vein Features
Vein features are obtained by using morphological opening [1]. That operation is performed on the gray scale image with flat, disk-shaped structuring element of radius 1, 2, 3, 4 and subtracted remained image by the margin. As a result, a structure like vein is obtained. Fig. 3 shows an example of vein resulted by such operation.
(5)
(6)
Figure 3. Illustration of vein processed by using morphological operation
Based on that vein, 4 features are calculated as follow:
A A V A A V A A V A A
V 4
4 3 3 2
1
1 = , = 2 , = , = (8)
In this case, Vi, Vi, Vi, and Vi represent features of the vein, Ai, Ai, Ai, and Ai are total pixels of the
vein, and A denotes total pixels on the part of the leaf.
4.
P
ROCEDUREO
FL
EAVESR
ETRIEVALThe procedure of leaves retrieval is presented in Fig. 4. Firstly, image of the leaf as a query is processed to separate the leaf from its background. After the area of the leaf is found, all features contained in the leaf are extracted. Then, similarity indexes are calculated by comparing all features came from the leaf of the query and all features in the database. Finally, top n species are presented as a result of the query.
4.1. Processing to Get Part of the Leaf
Segmentation is a process to separate objects from its background. Several approaches have been introduced to do it. For example, the fissures of lung lobes are not seen by naked eyes in low dose Computerized Tomography images [15]. Therefore, a special treatment should be done for this case.
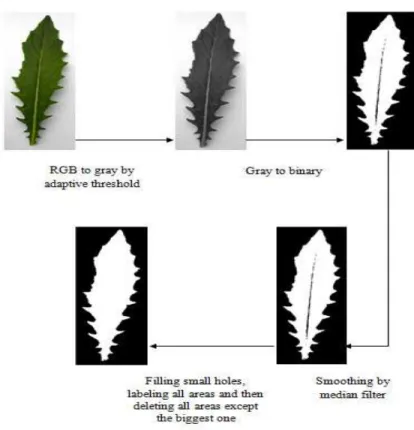
Separation part of the leaf is obtained by accomplishing several steps. Fig. 5 describes all processes to get part of the leaf. Conversion from RGB image to gray scale image is done by using formula below [1]:
B G
R
gray=0.2989* +0.5870* +0.1140* (9)
where R, G, B correspond to the color of pixel respectively.
Figure 5. Schema of separating the leaf from its background
Because lightning when images were taken by camera differs from time to time, a constant threshold cannot be applied to convert the gray scale image into binary form. Therefore, adaptive threshold should be used. An algorithm to obtain such threshold uses three steps [16].
1. Construct an intensity histogram with n bin.
2. Obtain the two major peaks (range that give the maximum number of pixels) which correspond to the leaf and the background.
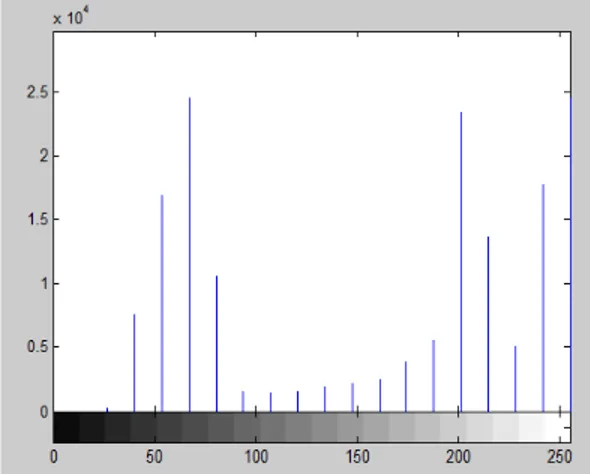
Fig. 6 shows an example of intensity histogram with 20 bins. The real values as follows: 0, 0, 322, 7696, 17057, 24685, 10739, 1638, 1533, 1651, 1982, 2329, 2582, 4010, 5574, 23558, 13704, 5143, 17886 and 24661. The two major peaks contain in bin 6 and 20. So, median of bin 10 becomes the threshold.
Figure 6. Intensity histogram of a leaf
A median filter is used to minimize noises contained in the image. However, the result may contain holes in the leaf due to the thresholding effect or small parts in the background caused by dirty background. To overcome those problems, holes on the leaf can be filled by using morphological operations [17]. Then, all areas in the image are labelled using 8-neighborhood. After that, all areas that have been labelled are deleted except the biggest one. As a result, part of the leaf is found.
4.2. Extracting Features
Features are extracted after the area of the leaf is obtained. Three kinds of features, Fourier descriptors, color moments, and vein features, are calculated based on formulas described on Section 2.
4.3. Calculating The Similarity Index
Similarity index of the two leaves is computed using Euclidean distance by using formulas below:
= − = s n i i s si s s
s Q T Q T
d 0 2 ) ( ) ,
( (10)
= − = c n i i c ci c c
c Q T Q T
d 0 2 ) ( ) ,
( (11)
= − = v n i i v vi v v
v Q T Q T
d 0 2 ) ( ) ,
( (12)
In this case, ds(Qs,Ts), dc(Qc,Tc), and dv(Qv,Tv) represent similarity index of shape, color, and vein
features respectively whereas ns, nc, and nv represent features number of shape, color, and vein
Similarity index that integrates Euclidean distance of shape, color, and vein is calculated using equation suggested by Jyothi et al. [18] in integrating several features:
v c s
v v v v c c c c s s s s
w w w
T Q d w T Q d w T Q d w T Q d
+ +
+ +
= ( , ) ( , ) ( , )
) ,
( (13)
where ws, wc, and wc are weights of features. In their experiment, Jyothi et. al. used all weights
equal 1, but in our experiment all weights are not equal 1 to get optimum performance.
4.4. Presenting Top n Species
Top n species is obtained by sorting the all similarity indexes first. After that, it is easy to get n species with smallest similarity index. For achieving performance of the system, n are chosen 1, 3, and 5.
5.
E
XPERIMENTALR
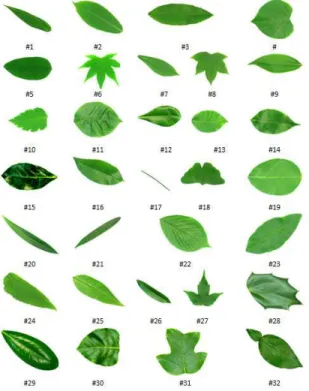
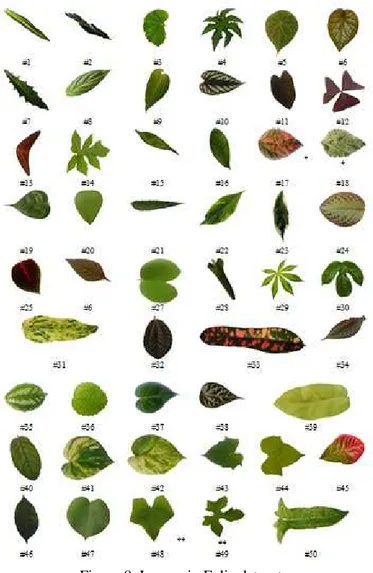
ESULTSThere are two kinds of dataset used in the experiments. First dataset came from Wu et. al. [1], that can be downloaded at http://flavia.sourceforge.net/. There are 32 plants. Samples leaves of each plant are shown in Fig. 7. Second dataset came from our collection (called Folia dataset, that can be downloaded at http://www.mediafire.com/?k9cx9ro4c352baf and http://www.mediafire.com/?qmawxsiv3kge2d1). The dataset contains 50 kinds of leaves (48 kinds of plants), as shown in Fig. 8. Actually, there are two plants that are represented by 2 kinds of leaves (denoted by flags * and ** in Fig. 8).
Figure 8. Leaves in Folia dataset
In order to obtain performance of the system, we used the following formula [18]:
Based on Eq. 13, we set ws = 0.55, wc = 0.25, and wv = 0.20 to test Flavia and Folia databases. By
using 40 leaves per species as references and 10 leaves per species as testing leaves, the system performance using Flavia dataset reaches 93.13% for top 1, 97.81% for top 3, and 98.12% for top 5. In this case, the radial frequency for calculating PFT is equal 4 and the maximum number of angular frequencies is equal 6.
Table 1 shows the accuracy of our methods compared to other methods per species. Integration of Fourier descriptor, color moment, and vein features has better performance than PNN, SVM, and Fourier moments.
Table 1. Comparison accuracy of several methods using Flavia dataset
Species SVM [1] PNN-PCNN [1] Fourier Moment [1] PFT+
#1 100% 100% 32.2% 90%
#2 100% 90% 0% 100%
#3 100% 100% 79.17% 80%
#4 100% 85% 63.01% 100%
#5 100% 100% 30.36% 100%
#6 80% 85% 52.9% 100%
#7 100% 100% 92.31% 100%
#8 90% 90% 33.9% 100%
#9 80% 95% 0% 90%
#10 80% 90% 29.23% 100%
#11 90% 95% 28% 100%
#12 0% 90% 69.84% 100%
#13 90% 90% 25% 100%
#14 100% 85% 1.54% 100%
#15 0% 90% 68.33% 100%
#16 80% 75% 48.21% 100%
#17 100% 100% 97.4% 100%
#18 100% 95% 85.48% 100%
#19 80% 90% 81.97% 70%
#20 100% 85% 93.94% 100%
#21 90% 80% 90% 100%
#22 90% 85% 27.27% 10%
#23 80% 90% 0% 100%
#24 80% 95% 56.92% 90%
#25 40% 85% 1.85% 100%
#26 90% 85% 75% 80%
#27 100% 100% 95.35% 90%
#28 100% 100% 5.45% 90%
#29 90% 80% 15.79% 100%
#30 0% 100% 0% 100%
#31 80% 100% 20.77% 100%
#32 100% 90% 80.36% 90%
Average 81,56% 91.25% 46.30% 93.13%
Table 2. Performance of the system using Flavia and Folia datasets
Dataset Top 1 Top 3 Top 5
Flavia 93.13% 97.81% 98.12%
Folia 90.80% 97.80% 98.80%
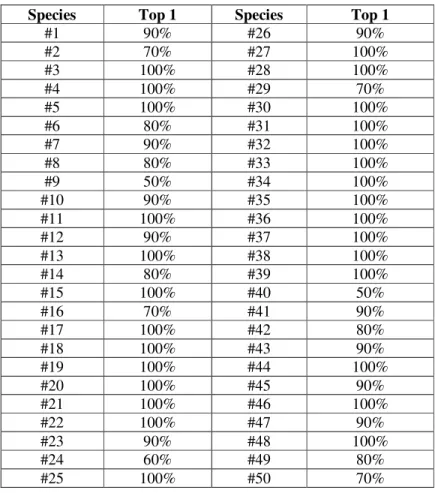
Table 3 shows performance of each plant when using Folia dataset. 27 of 50 plants can be identified with accuracy 100%. However, accuracy of plant such as #9 is very low.
Table 3. Performance of the system using Folia dataset
Species Top 1 Species Top 1
#1 90% #26 90%
#2 70% #27 100%
#3 100% #28 100%
#4 100% #29 70%
#5 100% #30 100%
#6 80% #31 100%
#7 90% #32 100%
#8 80% #33 100%
#9 50% #34 100%
#10 90% #35 100%
#11 100% #36 100%
#12 90% #37 100%
#13 100% #38 100%
#14 80% #39 100%
#15 100% #40 50%
#16 70% #41 90%
#17 100% #42 80%
#18 100% #43 90%
#19 100% #44 100%
#20 100% #45 90%
#21 100% #46 100%
#22 100% #47 90%
#23 90% #48 100%
#24 60% #49 80%
#25 100% #50 70%
6.
C
ONCLUSIONSR
EFERENCES[1] Wu, S. G., Bao, F. S., Xu, E. Y., Wang, Y. X., Chang, Y.-F., & Xiang, Q.-L. (2007). “A Leaf Recognition Algorithm for Plant Classification Using Probabilistic Neural Network”. IEEE 7th International Symposium on Signal Processing and Information Technology, Cairo.
[2] Singh, K., Gupta, I., & Gupta, S. (2010). “SVM-BDT PNN and Fourier Moment Technique for Classification of Leaf Shape”. International Journal of Signal Processing, Image Processing and Pattern Recognition, 3 (4), pp. 67-78.
[3] Warren, D. (1997). “Deriving Chrysanthemum Leaf Shape Descriptions for Variety Testing from Digital Images”. First European Conference for Information Technology in Agriculture. Copenhagen. [4] Wu, Q., Zhou, C., & Wang, C. (2006). “Feature Extraction and Automatic Recognition of Plant Leaf
Using Artificial Neural Network”. Avances en Ciencias de la Computacion , pp. 5-12.
[5] Wang, Z., Chi, Z., Feng, D., & Wang, Q. (2000). “Leaf Image Retrieval with Shape Features”. 4th International Conference on Advances in Visual Information Systems, pp. 477-487.
[6] Du, J. X., Huang, D. S., Wang, X. F., & Gu, X. (2006). “Computer-aided Plant Species Identification (CAPSI) Based on Leaf Shape Matching Technique”. Transactions of the Institute of Measurement and Control, 28 (3), pp. 275-284.
[7] Zulkifli, Z. (2009). Plant Leaf Identification Using Moment Invariants & General Regression Neural Network. Master Thesis. Universiti Teknologi Malaysia.
[8] Man, Q.K., Zheng, C.H., Wang, X.-F., & Lin, F.-Y. (2008). “Recognition of Plant Leaves Using Support Vector”. International Conference on Intelligent Computing, pp. 192-199, Shanghai. [9] Nam, Y., Hwang, E., & Kim, D. (2008). “A Similarity-based Leaf Image retrieval Scheme: Joining
Shape and Venation Features”. Computer Vision and Image Understanding, 110, pp. 245-259. [10] Li, Y., Chi, Z., & Feng, D. D. (2006). “Leaf Vein Extraction Using Independent Component
Analysis”. System, Man and Cybernatics. pp. 3890:3894. Taipei.
[11] Kadir, A., Nugroho, L. E., Susanto, A., & Santosa, P. I. (2011). “A Comparative Experiment of Several Shape Methods in Recognizing Plants”. International Journal of Computer Science & Information Technology (IJSIT), 3 (3), pp. 256-263.
[12] Zhang, D. (2002). Image Retrieval Based on Shape. Unpublished Dissertation. Monash University. [13] Dobrescu, R., Dobrescu, M., Mocanu, S., & Popescu, D. (2010). “Medical Images Classification for
Skin canver Diagnosis Based on Combined Texture and Fractal Analysis”. WISEAS Transactions on Biology and Biomedicine, 7 (3), pp. 223-232.
[14] Choras, R. S. (2007). “Image Feature Extraction Techniques and Their Application for CBIR and Biometrics systems”. International Journal of Bilogy and Biomedical Engineering, 1 (1), pp. 6-16. [15] Anitha, S. & Sridhar, S. (2010). “Segmentation of lung Lobes and nodules in CT Images”. Signal &
[16] Pahalawatta, K. (2008). Plant Species Biometric Using Features Hierarchies A Plant Identification System Using Both Global and Local Features of Plant Leaves. Master Thesis. University of Canterburry.
[17] Gonzalez, R. C., & Woods, R. E. (2002). Digital Image Processing. Upper Saddle River: Prentice-Hall, Inc.
[18] Jyothi, B., Latha, Y. M., & Reddy, V. (2010). “Medical Image Retrieval using Multiple Features”.
Advances in Computational Sciences and Technology, 3 (3), pp. 387-396. Authors
Abdul Kadir received B.Sc in Electrical Engineering from Gadjah Mada University in 1987, M. Eng in Electrical Engineering from Gadjah Mada in 1998, and Master of Management from Gadjah Mada University in 2004. His research interests include image processing, pattern recognition, and web-based applications.
Lukito Edi Nugroho received B.Sc in Electrical Engineering from Gadjah Mada University in 1989, M.Sc. from James Cook University of North Queensland in 1994, Ph.D from School of Computer Science and Software Engineering, Monash University, in 2002. His research interests are software engineering, information systems, and multimedia.
Adhi Susanto is a professor emeritus at Gadjah Mada University, Indonesia. He received Bachelor in Physics in 1964 from Gadjah Mada University, Master in Electrical Engineering in 1966 from University of California, Davis, USA, and Doctor of Philosophy in 1986 from University of California, Davis, USA. His research interests areas are electronics engineering, signal processing, and image processing.

![Table 1. Comparison accuracy of several methods using Flavia dataset Species SVM [1] PNN-PCNN [1] Fourier Moment [1] PFT+](https://thumb-eu.123doks.com/thumbv2/123dok_br/16428514.195811/10.918.192.737.155.791/comparison-accuracy-methods-flavia-dataset-species-fourier-moment.webp)