ISSN 0104-6632 Printed in Brazil
www.abeq.org.br/bjche
Vol. 26, No. 03, pp. 537 - 543, July - September, 2009
Brazilian Journal
of Chemical
Engineering
IDENTIFICATION OF DEFLUIDIZATION REGION
IN A GAS-SOLID FLUIDIZED BED USING A
METHOD BASED ON PRESSURE FLUCTUATION
MEASUREMENTS
M. R. Parise
1*, P. R. G. Kurka
2and O. P. Taranto
11
School of Chemical Engineering, University of Campinas (UNICAMP), Phone: + (55) (19) 3521-3901, Fax: + (55) (19) 3521-3910, P.O. Box 6066, 13083-970, Campinas - SP, Brazil.
2
Faculty of Mechanical Engineering, University of Campinas (UNICAMP), Phone: + (55) (19) 3521-3175, Fax: + (55) (19) 3289-3722, P.O. Box 6122, 13083-970, Campinas - SP, Brazil.
E-mail: [email protected]
(Submitted: October 16, 2008 ; Revised: March 19, 2009 ; Accepted: March 24, 2009)
Abstract - Industrial applications that involve fluidized bed operations must prevent the undesirable
phenomenon of partial or complete bed defluidization. Defluidization can be avoided by increasing the gas velocity and/or, in some cases, changing the solid feed conditions in the system, provided that the changes in the hydrodynamics of the flow are detected early enough. The use of a technique that can perform an early detection of the defluidization condition in industrial applications is important, in order to avoid the loss of efficiency or even an undesirable shutting down of the process. The objective of this work is to show the application of a method for early detection of the condition where the bed is tending to the defluidization, in a gas-solid fluidized bed flow. The method is based on pressure fluctuation measurements. Experimental tests are carried out using two solid particles: microcrystalline cellulose and sand. Results show that the proposed method is efficient in detecting the fluidization condition in a conventional bubbling bed regime. The potential of application of the technique is also shown for the control of the defluidization phenomenon in industry.
Keywords: Gas-solid fluidized bed; Defluidization; Pressure fluctuations; Fourier Transform; Exponential Gaussian distribution.
INTRODUCTION
The interest in gas-solid fluidized bed systems in chemical industries has increased in the last few decades, due to its important characteristics, such as, excellent fluid mixing, high heat and mass transfer rates and temperature uniformity. Examples of industrial applications of gas-solid fluidized bed are that of drying of solids, coating of particles, combustion and gasification of coal and biomass, catalytic reactions, adsorption, and catalyst regeneration (Kunii and Levenspiel, 1991).
A good mixture of the gas-solid components is crucial in fluidized bed systems. In some industrial
processes (e.g. drying, coating of particle, combustion and gasification), the agglomeration of particles may lead to a partial or complete defluidization of the bed, consequently affecting the quality of the fluidization process. The present technique may therefore be used for an early identification of the operating condition where the bed is tending to defluidization.
538 M. R. Parise, P. R. G. Kurka and O. P. Taranto
Brazilian Journal of Chemical Engineering Pressure fluctuations have been used to determine
several fluidization parameters or phenomena, such as the transition from bubbling to turbulent fluidization (Lee and Kim, 1988), the bubble frequency (Nelson et al., 1993), the minimum fluidization gas velocity (Puncochar et al., 1985; Wilkinson, 1995; Felipe and Rocha, 2007), differentiation of states of typical fluidization (Felipe and Rocha, 2004) and the condition where the bed is tending to defluidization (Parise, 2007; Parise et al., 2008; Parise et al., 2009).
The present work uses the method developed by Parise (2007), which is based on the Fourier transform of pressure fluctuation with exponential Gaussian distribution in order to identify the condition where the bed is tending to defluidization.
NORMAL SPECTRAL DISTRIBUTION IN THE FLUIDIZATION PROCESS
The frequency spectrum of bed pressures in a gas-solid fluidized process is characterized by the absence of a dominant peak, except at the slugging regime. The monitoring of individual peak frequencies, as an indication of defluidization condition in a bed pressure spectral analysis method, is of little practical use.
In a fixed bed regime, there is a bulk energy distribution that is reflected in an almost constant bed pressure without significantly high amplitudes in the pressure spectra. On the other hand, in a fluidized bed regime, there is gas bubble formation, which is the main origin of pressure fluctuations. In this case, the pressure spectrum has amplitude and frequency values that are higher than those found in the fixed bed regime.
All such behaviors can be measured through statistical distribution of the spectral lines, as an indication of the fluidization stage. A Gaussian or normal curve fitted to the pressure amplitude spectrum is used as an indication of the stage of the fluidization process.
The normal distribution curve has the expression:
2 (fk fm)
2
´ 2σ
k
1
G (f ) = e
σ 2 π
− −
(1)
where f is the frequency, fm is the central frequency
value, σ is the standard deviation of the spectral distribution, and, k = 0, 1, …, M-1.
The amplitude of the normal distribution curve as shown in Eq.(1) is dependent on the inverse of the standard deviation parameter (σ). The same exponential curve can be used with an amplitude independent parameter (A), given by the expression:
( )
( )2 k m
2 f f
2 k
G f A .e
− −
σ
= (2)
Applying the natural logarithm in Equation (2) yields:
( )
[ ] (
k m)
2k 2
f f
ln G f ln A
2 −
= −
⎡ ⎤
⎣ ⎦ σ (3)
or,
( )
2k k k
ln G f⎡⎣ ⎤⎦=af +bf +c, (4)
where,
[ ]
2m m
2 2 2
1 f f
a b c ln A
2 2
= − = = −
σ σ σ
so, .
2 m 2 f c
2
A=e + σ
A cost function (e'k) is defined, and its minimization by a least square method leads to the optimally identified parameters A,σ,and fm, through
the following expression:
[
] [
]
N 1
2 '
k s k k
k 0
e ln A (f ) ln G(f )
−
=
=
∑
⎡⎣ − ⎤⎦ (5)In Equation (5) above, As (f) is the measured
amplitude of the pressure spectrum.
Figure 1 shows a typical example of fitting of the natural logarithms of the Fourier transform amplitudes.
0 2 4 6 8 10 12 14 16 18 20
-20 -15 -10 -5 0 5
ln [ A
s
(
fk
)]
Frequency ( Hz)
Adjusted curve [ Ln (G(fk) ]
2 3
AIR
1
PARTICLES 6
5
8 7
AIR
9
4
1 BLOWER
2 STATIC PRESSURE TRANSDU 3 DIFFERENTIAL PRESSURE TR 4 FREQUENCY INVERTOR 5 DIFFERENTIAL PRESSURE TR 6 DATA ACQUISITION SYSTEM 7 COMPUTER
8 FLUIDIZED BED 9 CYCLONE
1 2
3 4
5 6
7 9
8 AIR
PARTICLES
AIR 2
3
AIR
1
PARTICLES 6
5
8 7
AIR
9
4
1 BLOWER
2 STATIC PRESSURE TRANSDU 3 DIFFERENTIAL PRESSURE TR 4 FREQUENCY INVERTOR 5 DIFFERENTIAL PRESSURE TR 6 DATA ACQUISITION SYSTEM 7 COMPUTER
8 FLUIDIZED BED 9 CYCLONE
1 2
3 4
5 6
7 9
8 AIR
PARTICLES
AIR
1. Blower
2. Static Pressure Transducer 3. Differential Pressure Transducer 4. Frequency Invertor
5. Differential Pressure Transducer 6. Data Acquisition System
7. Computer
8. Fluidized Bed
9. Cyclone
Figure 2: Schematic diagram of experimental apparatus.
MATERIALS AND METHODS
The experimental apparatus used in this work, shown schematically in Figure 2, is a Plexiglas column with a 0.143m inner diameter and 0.71m height. The gas distributor is a 1.62mm thick stainless steel perforated plate with hole diameters of 1mm, distributed in a triangular pitch. The perforated plate is covered with a fine grid, to prevent particles falling into the plenum. Air is injected into the bed by a 3kW air blower, which is regulated by a frequency inverter (Danfoss VLT,2800). The air flow rate is measured by an orifice plate. A pressure transmitter (Cole Parmer, 07356-01, range: 0 to 210.8 kPa, response time less than 5 ms) and a differential pressure transmitter (Smar, LD301, range: 0.125 to 5kPa, response time of 100 ms) are employed to measure the up-wind pressure of the orifice plate and the pressure drop across the bed, respectively. The bed pressure is measured in the plenum using a differential pressure transmitter (Cole Parmer, 68014-18, range: 0 to 6.2 kPa, response time of 250 ms).
The pressure signal is acquired by a PCI 6024 E data - acquisition system (National Instrument). The LabView 7.1 software platform is used in all data
acquisition and signal processing.
The pressure sampling frequency used in all tests is 400 Hz, with 8192 data points. Absolute pressures are measured in the plenum, the up-wind orifice plate and the differential pressure is measured across the bed. The large number of data points (8192) sampled at 400 Hz, yields a frequency resolution of 0.05Hz. Such a resolution is sufficient to sample, in a convenient way, most of the dynamical phenomena in engineering applications. The signals are low-pass filtered with a cut-off frequency of 20 Hz.
The fluid dynamic curves were obtained using the traditional method that records pressure drop across the bed versus superficial gas velocity.
Experiments are carried out with microcrystalline cellulose (MCC) and sand particles. Properties of these particles are given in Table 1. Due to the relatively narrow solids distribution required for the bed particles used in the tests, the Sauter diameter determination by means of the classical sieve analysis was not possible. Instead, the mean particle diameter for both bed materials was adopted as being the average value between two consecutive opening size sieves. The apparent particle density was obtained by water picnometry.
Table 1: Characteristics of solids and bed properties.
Type of particle
Mean particle diameter,
dp (μm)
Apparent density,
ρs (kg/m3)
Fixed bed height,
hL (m)
H/D (bed aspect
ratio)
Mass of solids,
ms (kg)
Minimum fluidization
velocity, umf (m/s)
180 (150- 210) 980 0.25 1.75 1.72 0.026
Microcrystalline
cellulose (MCC) 460 (420-500) 980 0.25 1.75 1.97 0.066
180 (150- 210) 2650 0.25 1.75 6.01 0.032
Sand
540 M. R. Parise, P. R. G. Kurka and O. P. Taranto
Brazilian Journal of Chemical Engineering
RESULTS AND DISCUSSION
Figures 3(a) to (h) show data corresponding to 10s time intervals, for the bed pressure fluctuation measured in the plenum. The figures also show the respective Fourier transform (with 8192 data points) of pressure measurements for the solids used . Figures 3(a), (b), (e) and (f) characterize the fixed bed regime for MCC and sand, respectively. Figures
3 (c), (d), (g) and (h) illustrate the fluidized bed condition for the same materials. The results show that, in a fixed bed regime, the pressure fluctuation amplitude is lower than that observed in the fluidized bed situation, due to the absence of bubbles. In the Fourier transform, it is observed that the pressure spectrum related to fixed bed condition is characterized by the presence of lower frequency and amplitudes than those in the fluidization regime.
1 2 3 4 5 6 7 8 9 10
-100 -80 -60 -40 -20 0 20 40 60 80 100
(a)
Nom
a
lized Pr
essur
e
Fluct
u
at
ion
(Pa)
Time (s)
0 2 4 6 8 10 12 14 16 18 20
0.0 0.2 0.4 0.6 0.8 1.0
(b)
Fo
ur
ie
r t
ran
sfo
rm (
P
a)
Frequency (Hz)
1 2 3 4 5 6 7 8 9 10
-100 -80 -60 -40 -20 0 20 40 60 80 100
(c)
Nomal
ized Pr
e
ssure Fluctuati
on (Pa)
Time (s)
0 2 4 6 8 10 12 14 16 18 20
0 1 2 3 4 5 6
(d)
Fouri
e
r t
ransform
(P
a)
Frequency (Hz)
1 2 3 4 5 6 7 8 9 10
-500 -250 0 250 500
(e)
Nom
a
liz
e
d
P
res
su
re
Fl
uc
tu
at
io
n
(P
a
)
Time (s)
0 2 4 6 8 10 12 14 16 18 20
0.0 0.5 1.0 1.5 2.0 2.5 3.0
(f)
Fourier t
rans
form (Pa)
1 2 3 4 5 6 7 8 9 10 -500
-250 0 250 500
(g)
N
o
ma
liz
e
d
Pr
essu
re
F
luctu
a
ti
o
n (Pa
)
Time (s)
0 2 4 6 8 10 12 14 16 18 20
0 10 20 30 40 50 60
(h)
F
o
u
rier
t
ran
s
for
m (Pa)
Frequency (Hz)
Figure 3: Time sequence of the pressure fluctuations measured in (a) fixed bed regime for MCC, uo =
0.012 m/s; (c) fluidized bed for MCC, uo = 0.083 m/s; (e) fixed bed regime for sand, uo = 0.024 m/s; (g)
fluidized bed for sand, uo = 0.192 m/s. Fourier transform of (b) fixed bed regime for MCC; (d) fluidized
bed for MCC; (f) fixed bed regime for sand; (h) fluidized bed for sand.
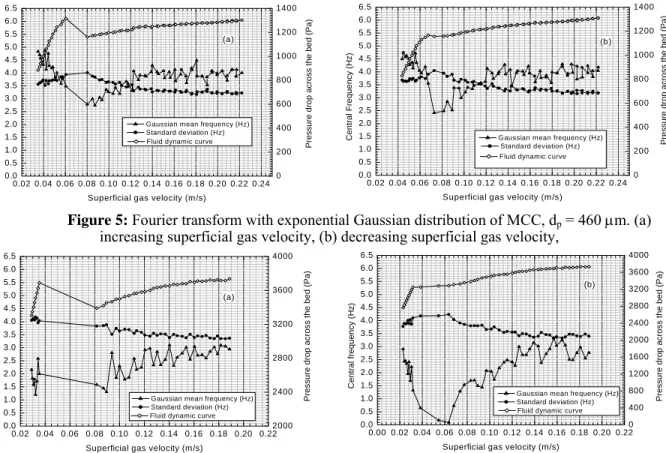
Figures 4 to 7 illustrate the exponential Gaussian distribution parameters of the Fourier transforms obtained from the pressure signals for the two particles studied. The parameters are Gaussian mean frequency value of the pressure spectrum and standard deviation of the spectral distribution, throughout the fluid dynamic curve. Results show that the Gaussian mean frequency reaches a minimum value when the bed tends to defluidization, that is, when the superficial gas velocity is near the minimum fluidization velocity (verified through the fluid dynamic curve).
Fixed bed regime contains peaks at lower frequencies and amplitudes than that in fluidized bed (Figure 3 (b), (d) and (f), (h), respectively). Low values of Gaussian mean frequency are expected in the case of fixed bed condition, when the exponential Gaussian curve is fitted to the pressure spectrum. Figures 4-6, however, show that the value of the Gaussian mean frequency in such a regime is about 4 Hz, which is a high value for this condition. This occurs due to the presence of components with very low amplitudes, around 0.2 Pa, Figure 3 (b), and high frequencies, which are responsible for the
displacement of the mean value of the exponential Gaussian curve.
Figures 4-6 show that the region where the bed is tending to defluidization is clearly defined with an accentuated drop of the Gaussian mean frequency. From this point, the value of the Gaussian mean frequency increases with the increase of the superficial gas velocity. However, such a behavior is observed when the fluidization regime is a conventional bubbling bed.
In the case of Figure 7, the defluidization zone is not easily identified. The Gaussian mean frequency profile for the same figure, however, indicates a change of fluidization regime. The approach of the fluidization regime to slugging, after attaining the minimum fluidization velocity with an increase of the gas velocity, is also visually observed during the experimental test.
Figures 4-7 show that the standard deviation parameter also increases when the minimum value of the exponential Gaussian distribution is reached, but it is not a better indicator to identify the defluidization region than that of the Gaussian mean frequency.
0.00 0.01 0.02 0.03 0.04 0.05 0.06 0.07 0.08 0.09 0.10 0.0
0.5 1.0 1.5 2.0 2.5 3.0 3.5 4.0 4.5 5.0 5.5 6.0 6.5
0 200 400 600 800 1000 1200
Gaussian m ean frequency (H z) Standard deviation (H z)
C
e
ntra
l fr
equ
ency
(
H
z
)
Superficial gas velocity (m /s)
Pr
essure
dro
p
acro
ss
th
e be
d (Pa
)
(a)
Fluid dynamic curve
0 .0 0 0 .0 1 0 .0 2 0 .0 3 0 .0 4 0 .0 5 0 .0 6 0 .0 7 0 .0 8 0 .0 9 0 .1 0 0 .0
0 .5 1 .0 1 .5 2 .0 2 .5 3 .0 3 .5 4 .0 4 .5 5 .0 5 .5 6 .0 6 .5
0 2 0 0 4 0 0 6 0 0 8 0 0 1 0 0 0 1 2 0 0
G au s sian m ea n frequ en cy (H z) S tan da rd de via tion (H z)
Ce
ntral Fre
quency
(
H
z)
S u p e rfic ia l g a s ve lo city (m /s)
Pr
ess
u
re dr
op across t
h
e bed (P
a)
(b )
F lu id d yna m ic c u rve
Figure 4: Fourier transform with exponential Gaussian distribution of MCC, dp = 180 μm. (a)
542 M. R. Parise, P. R. G. Kurka and O. P. Taranto
Brazilian Journal of Chemical Engineering
0.02 0.04 0.06 0.08 0.10 0.12 0.14 0.16 0.18 0.20 0.22 0.24 0.0 0.5 1.0 1.5 2.0 2.5 3.0 3.5 4.0 4.5 5.0 5.5 6.0 6.5 0 200 400 600 800 1000 1200 1400
Gaussian mean frequency (Hz) Standard deviation (Hz)
C entr al frequ ency (H z)
Superficial gas velocity (m/s)
Pressur e dro p acro s s the be d (Pa ) (a)
Fluid dynamic curve
0.02 0.04 0.06 0.08 0.10 0.12 0.14 0.16 0.18 0.20 0.22 0.24 0.0 0.5 1.0 1.5 2.0 2.5 3.0 3.5 4.0 4.5 5.0 5.5 6.0 6.5 0 200 400 600 800 1000 1200 1400
Gaussian m ean frequency (Hz) Standard deviation (Hz)
C e n tral F re que ncy ( H z)
Superficial gas velocity (m /s)
Pre ssure dr op a c ro s s th e be d ( P a) (b)
Fluid dynamic curve
Figure 5: Fourier transform with exponential Gaussian distribution of MCC, dp = 460 μm. (a)
increasing superficial gas velocity, (b) decreasing superficial gas velocity,
0.02 0.04 0.06 0.08 0.10 0.12 0.14 0.16 0.18 0.20 0.22 0.0 0.5 1.0 1.5 2.0 2.5 3.0 3.5 4.0 4.5 5.0 5.5 6.0 6.5 2000 2400 2800 3200 3600 4000
Gaussian mean frequency (Hz) Standard deviation (Hz)
Ce ntr a l fr equenc y (H z)
Superficial gas velocity (m/s)
Pres s u re dro p a c ro ss t
he bed (Pa)
(a)
Fluid dynamic curve
0.00 0.02 0.04 0.06 0.08 0.10 0.12 0.14 0.16 0.18 0.20 0.22 0.0 0.5 1.0 1.5 2.0 2.5 3.0 3.5 4.0 4.5 5.0 5.5 6.0 6.5 0 400 800 1200 1600 2000 2400 2800 3200 3600 4000
Gaussian mean frequency (Hz) Standard deviation (Hz)
Cen tr a l fr equenc y (H z )
Superficial gas velocity (m/s)
Pres s ure dro p a c ro ss t
he bed (
P
a)
(b)
Fluid dynamic curve
Figure 6: Fourier transform with exponential Gaussian distribution of sand, dp = 180 μm. (a) increasing
superficial gas velocity, (b) decreasing superficial gas velocity.
0.15 0.20 0.25 0.30 0.35 0.40 0.0 0.5 1.0 1.5 2.0 2.5 3.0 3.5 4.0 4.5 5.0 5.5 6.0 6.5 0 400 800 1200 1600 2000 2400 2800 3200 3600 (a)
Gaussian mean frequency (Hz) Standard deviation (Hz)
C
entral f
requency
(Hz)
Superficial gas velocity (m/s)
Pressure drop across
the bed (Pa)
Fluid dynamic curve
0.15 0.20 0.25 0.30 0.35 0.40 0.0 0.5 1.0 1.5 2.0 2.5 3.0 3.5 4.0 4.5 5.0 5.5 6.0 6.5 0 400 800 1200 1600 2000 2400 2800 3200 3600
Gaussian mean frequency (Hz) Standard deviation (Hz)
Centra l frequen c y (H z )
Superficial gas velocity (m /s)
Pr
es
sure dro
p
across
the bed (Pa)
(b)
Fluid dynamic curve
Figure 7: Fourier transform with exponential Gaussian distribution of sand, dp = 460 μm. (a) increasing
superficial gas velocity, (b) decreasing superficial gas velocity.
CONCLUSIONS
The defluidization condition for MCC and sand (dp = 180 μm) particles is clearly detected in all
experimental tests carried out in bubbling regime, using the method based on pressure fluctuations. In the case of 460 μm diameter sand, such a condition could not be easily identified, due to the presence of large bubbles, close to the minimum fluidization velocity and the fluidization regime approaching to slugging. The results indicate that the proposed
methodology can also be useful to indicate transitions between fluid dynamic regimes.
ACKNOWLEDGMENT
The authors would like to thank National Council of Technological and Scientific Development
NOMENCLATURE
As (f) measured amplitude of the
pressure spectrum
Pa
D column inner diameter m
dp mean particle diameter μm
f frequency Hz
fm central frequency Hz
H Fixed bed height m
H/D bed aspect ratio M 8192 data points
umf minimum fluidization
velocity
m/s
Greek Letter
σ the standard deviation of the spectral distribution
Hz
ρs apparent density kg/m
3 '
k
e cost function
REFERENCES
Felipe, C. A. S. and Rocha, S. C. S., Time series analysis of pressure fluctuation in gas-solid fluidized beds, Brazilian Journal of Chemical Engineering, 21, 497 (2004).
Felipe, C. A. S. and Rocha, S. C. S., Prediction of minimum fluidization velocity of gas-solid fluidized bed by pressure fluctuation measurements – analysis of the standard deviation methodology, Powder Technology, 174, 104-113 (2007). Kunii, D. and Levenspiel, O., Fluidization Engineering,
Butterworth-Heinemann, 2nd edition, Toronto (1991).
Lee, G. S. and Kim, S. D., Pressure fluctuations in
turbulent fluidized beds, Journal of Chemical Engineering of Japan, 5, 515(1988).
Nelson, B. H., Briens, N. L. and Bergougnou, M. A., Pressure fluctuations at individual grid holes of a gas-solid fluidized bed, Powder Technology, 77 (1993).
Parise, M. R., Application of the normal spectral distribution in a gas-solid fluidized bed, Ph.D. thesis, University of Campinas, Campinas, SP, Brazil, 110 p. (2007). (In Portuguese).
Parise, M. R., Taranto, O. P., Kurka, P. R. G. and Benetti, L. B., Detection of the minimum gas velocity region using Gaussian spectral pressure distribution in a gas-solid fluidized bed, Powder Technology, 182, 453-458 (2008).
Parise, M. R., Kurka, P. R. G. and Taranto, O. P., The Gaussian spectral pressure distribution applied to a fluidized bed, Chemical Engineering and Processing, 48, 120-125 (2009).
Puncochar, M., Drahos, J., Cermak, J. and Selucky, K., Evaluation of minimum fluidizing velocity in gas fluidized bed from pressure fluctuations, Chemical Engineering Commun, 35, 81 (1985).
Schouten, J. C. and Van den Bleek, C. M., Monitoring the Quality of Fluidization Using the Short-Term Predictability of Pressure Fluctuations, AIChE Journal, 44, 48 (1998).
van der Schaaf, J., Schouten, J. C., Johnsson, F. and Van den Bleek, C. M., Non-intrusive determination of bubble and slug length scales in fluidized beds by decomposition of the power spectral density of pressure times series, International Journal of Multiphase Flow, 28, 865 (2002).