Towards a Computable Data Corpus of
Temporal Correlations between Drug
Administration and Lab Value Changes
Axel Newe1*, Stefan Wimmer2, Antje Neubert2, Linda Becker3, Hans-Ulrich Prokosch1, Matthias W. Beckmann4☯, Rainer Fietkau5☯, Christian Forster6☯, Markus
Friedrich Neurath7☯, Georg Schett8☯, Thomas Ganslandt9
1Chair of Medical Informatics, Friedrich-Alexander-University Erlangen-Nuremberg, Erlangen, Germany,
2Department of Paediatrics and Adolescent Medicine, University Hospital Erlangen, Erlangen, Germany,
3Institute of Psychology, Friedrich-Alexander-University Erlangen-Nuremberg, Erlangen, Germany,
4Department of Gynecology and Obstetrics, University Hospital Erlangen, Erlangen, Germany,
5Department of Radiation Therapy, University Hospital Erlangen, Erlangen, Germany,6Department of Internal Medicine 4, University Hospital Erlangen, Erlangen, Germany,7Department of Internal Medicine 1, University Hospital Erlangen, Erlangen, Germany,8Department of Internal Medicine 3, University Hospital Erlangen, Erlangen, Germany,9Medical Centre for Information and Communication Technology, University Hospital Erlangen, Erlangen, Germany
☯These authors contributed equally to this work.
Abstract
Background
The analysis of electronic health records for an automated detection of adverse drug reac-tions is an approach to solve the problems that arise from traditional methods like spontane-ous reporting or manual chart review. Algorithms addressing this task should be modeled on the criteria for a standardized case causality assessment defined by the World Health Organization. One of these criteria is the temporal relationship between drug intake and the occurrence of a reaction or a laboratory test abnormality. Appropriate data that would allow for developing or validating related algorithms is not publicly available, though.
Methods
In order to provide such data, retrospective routine data of drug administrations and tempo-rally corresponding laboratory observations from a university clinic were extracted, trans-formed and evaluated by experts in terms of a reasonable time relationship between drug administration and lab value alteration.
Result
The result is a data corpus of 400 episodes of normalized laboratory parameter values in temporal context with drug administrations. Each episode has been manually classified whether it contains data that might indicate a temporal correlation between the drug admin-istration and the change of the lab value course, whether such a change is not observable OPEN ACCESS
Citation:Newe A, Wimmer S, Neubert A, Becker L, Prokosch H-U, Beckmann MW, et al. (2015) Towards a Computable Data Corpus of Temporal Correlations between Drug Administration and Lab Value Changes. PLoS ONE 10(8): e0136131. doi:10.1371/ journal.pone.0136131
Editor:Andrey Rzhetsky, University of Chicago, UNITED STATES
Received:April 29, 2015
Accepted:July 30, 2015
Published:August 24, 2015
Copyright:© 2015 Newe et al. This is an open access article distributed under the terms of the
Creative Commons Attribution License, which permits unrestricted use, distribution, and reproduction in any medium, provided the original author and source are credited.
Data Availability Statement:All relevant data are within the paper and its Supporting Information files.
Funding:The authors acknowledge support by Deutsche Forschungsgemeinschaft (DFG, German Research Foundation) and Friedrich-Alexander-University Erlangen-Nuremberg within the funding program Open Access Publishing.
or whether a decision between those two options is not possible due to the data. In addition, each episode has been assigned a concordance value which indicates how difficult it is to assess. This is the first open data corpus of a computable ground truth of temporal correla-tions between drug administration and lab value alteracorrela-tions.
Discussion
The main purpose of this data corpus is the provision of data for further research and the provision of a ground truth which allows for comparing the outcome of other assessments of this data with the outcome of assessments made by human experts. It can serve as a contri-bution towards systematic, computerized ADR detection in retrospective data. With this lab value curve data as a basis, algorithms for detecting temporal relationships can be devel-oped, and with the classification made by human experts, these algorithms can immediately be validated. Due to the normalization of the lab value data, it allows for a generic approach rather than for specific or solitary drug/lab value combinations.
Introduction
It is a well-known fact that all drugs have both benefits and the potential for harm. Even under circumstances of flawless application (i.e. correct indication, dose, consideration of contraindi-cations etc.), a drug can still have unwanted and possibly harming effects [1]. These harming effects are a known common cause of iatrogenic morbidity and are among the common causes of death in many countries [1,2].
Pharmacovigilance is the systematic and continual monitoring of drugs with the aim to dis-cover, assess, understand and prevent related adverse effects and to take appropriate measures to minimize related risks [1]. The most commonly used method for the detection of adverse drug reactions (ADRs) is mandatory spontaneous reporting, although this practice is limited by several systematic shortcomings (e.g. under-reporting & bias) [3]. While an estimated third of hospital admissions is accompanied by ADRs, up to 90 percent of ADRs remain undetected in hospital settings [4]. The manual chart review–the gold standard in pharmacoepidemiol-ogy–is in contrast rather time consuming and expensive [3].
The analysis of electronic health records (EHRs) for detecting ADRs is (in comparison to mandatory spontaneous reporting and manual chart review) a relatively new approach [5]. One of the most common features of EHRs adopted by (U.S.) hospitals is an electronic labora-tory reporting system [6] and laboratory data have been identified as suitable parameters for the detection of ADRs [3,7,8]. Reference work that provides information about known influ-ence of drug intake on laboratory test results is amply available [9,10,11].
The World Health Organization (WHO) in collaboration with the Uppsala Monitoring Centre (UMC) defined a set of criteria for a standardized case causality assessment of ADRs [12]. In order to detect ADRs by means of EHR data analysis, relevant algorithms should be modeled on these criteria as archetypes.
One of these criteria is the temporal relationship between drug intake and the occurrence of a reaction or a laboratory test abnormality. It is obvious that some kind of time relationship between drug intake and an ADR must exist. However, the kind of this relationship can range from an immediately anaphylactic reaction to congenital defects that become evident months after intake (whereof the thalidomide tragedy of the 1960s [13] is the probably best known
Data Corpus of Temporal Correlations
example). These two extremes are not the main focus of EHR analysis: immediate reactions are usually obvious and very long term reactions are most likely very hard to detect by means of EHRs. Short term reactions, however, are well suited to be unveiled by EHR analysis–especially those of a single hospital stay, because it is likely that much of the necessary information and data are available.
An algorithm that is aimed to detect temporal correlations between drug intake and lab test abnormalities within such a single hospital stay needs a ground truth on which it can be vali-dated. This article presents a first version of such a ground truth data corpus that is based on real-world data and that can be used for the development and for the validation of algorithms for the detection of temporal correlations between drug intake and lab value alterations.
Methods
Ethics
Both the Ethics Committee of the Friedrich-Alexander-University Erlangen-Nuremberg and the Data Protection Officer of the University Clinic of Erlangen were consulted before the study.
Based on the description of the procedure as detailed below, the Ethics Committee con-cluded and confirmed in writing that no formal approval was required as regards the participa-tion of human subjects and the usage of the underlying data in general.
The Data Protection Officer approved in writing the usage and publication of the underly-ing anonymized data.
Raw Data Collection & Preparation
An anonymous excerpt of the i2b2 research data warehouse [14] of the University Clinic of Erlangen, Germany, was generated, comprising the following retrospective data:
• All administrations of Filgrastim (ATC: L03AA02) from six different departments (Oncol-ogy, Gynecol(Oncol-ogy, Radiotherapeutics, Gastroenterol(Oncol-ogy, Immunol(Oncol-ogy, Nephrology), reduced to the pure calendar date. Dose information was not exported.
• All lab values of Alkaline Phosphatase, Aspartate Transaminase, Alanine Transaminase, Gamma-Glutamyl Transpeptidase, Uric Acid, Urea, Creatinine, Creatine Kinase, Lactate Dehydrogenase, Potassium, Sodium, Myoglobin, Hemoglobin, Leucocytes Count, Granulo-cytes Count and ThromboGranulo-cytes Count for patients with the administrations listed above.
The lab parameters were selected based on their commonness and their likeliness to be influenced by Filgrastim. Two groups of ADR likeliness were included, distinguished by their expected frequency (according to the standard categories of ADR frequency as recommended by the Council for International Organizations of Medical Sciences, CIOMS [15], and based on the data of the knowledge base described in [3]):
1. lab parameters with an expected ADR frequency of“very common”(i.e. ADR frequency1/10) and
2. lab parameters with an expected ADR frequency of“rare”(i.e. ADR frequency1/104 and<1/103).
In addition to that, lab parameters with anexpectedeffect (i.e. the drug is intended to have an influence on the parameter) were also included.
1. the intended effect of Filgrastim is to stimulate the proliferation and differentiation of granulocytes, thus probably having direct influence on two of the selected lab parameters (Leucocytes Count, Granulocytes Count),
2. possible ADRs and the affected lab parameters are known from [3] and
3. its administration is well documented.
A total of 4332 cases with Filgrastim administrations were extracted from the i2b2. The first step after data extraction was to find solitary episodes of drug administrations. This was achieved by searching for continuous administrations with administration-free intervals of at least 14 days before the first administration and administration-free intervals of at least 14 days after the last administration, respectively. A maximum of one administration-free day was allowed during an episode. Although a minimum administration length was not defined explic-itly, it arose implicitly from the lab value selection criteria (5 days, see below).
In a second step, the temporally corresponding lab values were identified. Only drug admin-istration episodes with at least five lab value observations before, during, and after the actual episode were considered for further processing. The lab value observations before and after the administration episode had to be recorded within seven days. During this process, Alanine Transaminase, Myoglobin and Thrombocytes Count dropped out of the list of lab parameters, because no matching episodes were found.
The lab values were then normalized so that the respective patient specific reference interval fell within the range of [0..1] (i.e., the patient specific lower border value maps to 0 and the patient specific upper border value maps to 1), using the following formula:
LVn¼LVa BVl
BVu BVl ð1Þ
where LVnis the normalized lab value, LVais the actual (absolute) lab value, BVlis the patient
specific lower border value and BVuis the patient specific upper border value.
An example: let the patient specific reference range of Alkaline Phosphatase be 30–120 U/L (BVl= 30 U/L; BVu= 120 U/L). In this case, absolute values map as follows: 15 U/L!-0.16; 30 U/L!0.0; 100 U/L!0.78;120 U/L!1.0; 220 U/L!2.11. By application of this nor-malization, only the absolute values were changed while the shape of curves and the relative values were kept (especially in comparison to the reference interval). Since the normal (“refer-ence”) values of laboratory parameters are patient-specific (depending on sex, age, etc.) and also laboratory-specific (depending on the exact method used for determining the value), the precise figures used for conversion are not listed here.
The purpose of this normalization was to make impossible any inference to the underlying lab value while keeping the shape of curves, the relative values and the reference interval information.
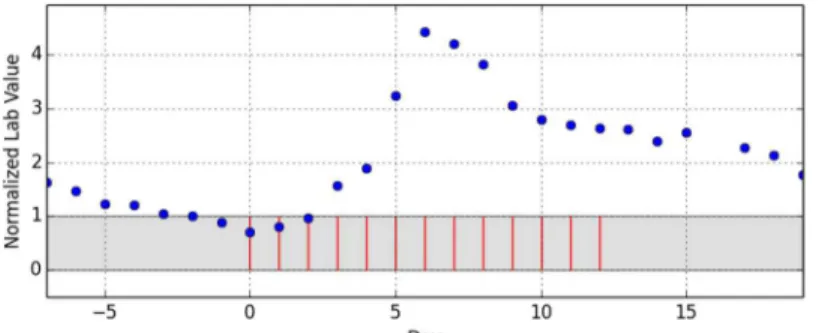
As the last step of data preparation, the drug administration dates were reassigned to a scale of relative days with day 0 being the first day of the administration episode.Fig 1shows an exemplary episode that does not allow any more inference to the underlying drug, the underly-ing laboratory parameter or any patient-specific information. A total of 902 episodes of drug administrations with temporarily corresponding lab value observations were distilled out of the 4332 initial cases.
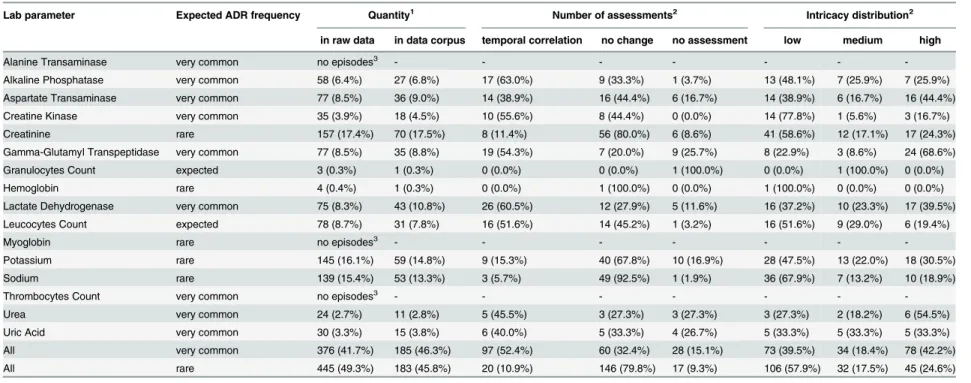
Finally, a random selection of 400 out of these 902 episodes was sampled to constitute the basis for the data corpus. A detailed breakdown can be found inTable 1.
Data Corpus of Temporal Correlations
Data Assessment
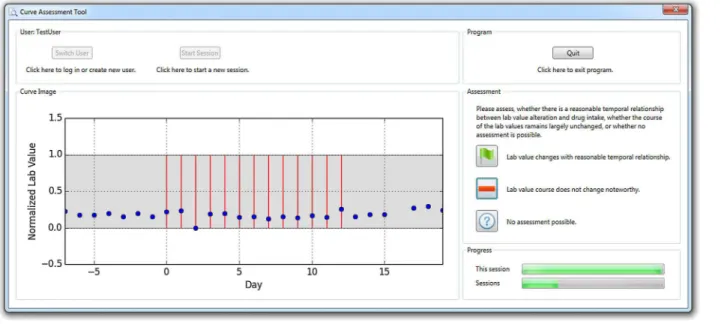
An expert group of three physicians, four pharmacists, three mathematicians and one physicist (seven male & four female, age 35.4y ± 8.2y) assessed the data. The randomly selected 400 data episodes described before were exported to curve plots in lossless Portable Network Graphics (PNG) file format and graphically presented to each of the experts in random order by means of a dedicated software tool (“Curve Assessment Tool”, CAT;Fig 2). For each episode, the study participants were asked to classify the curve graph in terms of a reasonable time relation-ship between drug administration and lab value alteration into one out of three categories of a nominal scale (the terms in brackets are the abbreviated classifications used for further reference):
• “Lab value changes with reasonable temporal relationship.”(temporal correlation)
• “Lab value course does not change noteworthy.”(no change)
• “No assessment possible.”(no assessment)
The 400 curves were processed twice. Each of the two rounds was divided into four sessions of 100 curves to minimize fatigue effects. The first round was intended to make the assessors familiar with the tool and to give them a feel for the task and the curves. The whole process was then repeated in a second round to actually collect the assessment data (the results of the first familiarization round were disregarded). This second round was performed after a pause of at least three nights after the last session of the first round. By means of this break, reminiscence effects should be minimized while keeping alive the training for the general methodology.
The presentation of the lab value curves (Figs1and2) resembled the Relative Multigraph used by Torsvik et.al. [16], but rather than using a partially logarithmic scale for the ordinate axis, a completely linear scale was used. The reference interval was highlighted and the events of drug administrations were presented as vertical bars. Therefore, the graphs contained no information as regards the underlying drug or the observed lab value. This enabled focusing on the pure temporal relationship and should eliminate possible expertise-related bias.
In order to test the feasibility of the procedure, a pre-test was performed before the actual assessment. The pre-test group consisted of two mathematicians and two physicists (one male & one female each, age 29.5y ± 5.2y). Participants of this profession were selected under assumption that they were familiar with the reading and interpretation of data curves. Fig 1. Example of extracted drug administration days (red bars) with corresponding normalized lab values (blue dots).A complete episode consist of a starting administration-free interval of seven days with at least five lab value observations, a period of continuous administration (max. one administration-free day) with at least five lab value observations and finally another administration-free interval of seven days with at least five lab value observations.
Table 1. Distribution and characteristics of lab parameters in the raw data and in the data corpus.
Lab parameter Expected ADR frequency Quantity1 Number of assessments2 Intricacy distribution2
in raw data in data corpus temporal correlation no change no assessment low medium high
Alanine Transaminase very common no episodes3 - - - - - -
-Alkaline Phosphatase very common 58 (6.4%) 27 (6.8%) 17 (63.0%) 9 (33.3%) 1 (3.7%) 13 (48.1%) 7 (25.9%) 7 (25.9%) Aspartate Transaminase very common 77 (8.5%) 36 (9.0%) 14 (38.9%) 16 (44.4%) 6 (16.7%) 14 (38.9%) 6 (16.7%) 16 (44.4%) Creatine Kinase very common 35 (3.9%) 18 (4.5%) 10 (55.6%) 8 (44.4%) 0 (0.0%) 14 (77.8%) 1 (5.6%) 3 (16.7%) Creatinine rare 157 (17.4%) 70 (17.5%) 8 (11.4%) 56 (80.0%) 6 (8.6%) 41 (58.6%) 12 (17.1%) 17 (24.3%) Gamma-Glutamyl Transpeptidase very common 77 (8.5%) 35 (8.8%) 19 (54.3%) 7 (20.0%) 9 (25.7%) 8 (22.9%) 3 (8.6%) 24 (68.6%) Granulocytes Count expected 3 (0.3%) 1 (0.3%) 0 (0.0%) 0 (0.0%) 1 (100.0%) 0 (0.0%) 1 (100.0%) 0 (0.0%) Hemoglobin rare 4 (0.4%) 1 (0.3%) 0 (0.0%) 1 (100.0%) 0 (0.0%) 1 (100.0%) 0 (0.0%) 0 (0.0%) Lactate Dehydrogenase very common 75 (8.3%) 43 (10.8%) 26 (60.5%) 12 (27.9%) 5 (11.6%) 16 (37.2%) 10 (23.3%) 17 (39.5%) Leucocytes Count expected 78 (8.7%) 31 (7.8%) 16 (51.6%) 14 (45.2%) 1 (3.2%) 16 (51.6%) 9 (29.0%) 6 (19.4%)
Myoglobin rare no episodes3 - - - - - -
-Potassium rare 145 (16.1%) 59 (14.8%) 9 (15.3%) 40 (67.8%) 10 (16.9%) 28 (47.5%) 13 (22.0%) 18 (30.5%) Sodium rare 139 (15.4%) 53 (13.3%) 3 (5.7%) 49 (92.5%) 1 (1.9%) 36 (67.9%) 7 (13.2%) 10 (18.9%) Thrombocytes Count very common no episodes3 - - - - - -
-Urea very common 24 (2.7%) 11 (2.8%) 5 (45.5%) 3 (27.3%) 3 (27.3%) 3 (27.3%) 2 (18.2%) 6 (54.5%) Uric Acid very common 30 (3.3%) 15 (3.8%) 6 (40.0%) 5 (33.3%) 4 (26.7%) 5 (33.3%) 5 (33.3%) 5 (33.3%) All very common 376 (41.7%) 185 (46.3%) 97 (52.4%) 60 (32.4%) 28 (15.1%) 73 (39.5%) 34 (18.4%) 78 (42.2%) All rare 445 (49.3%) 183 (45.8%) 20 (10.9%) 146 (79.8%) 17 (9.3%) 106 (57.9%) 32 (17.5%) 45 (24.6%)
1
Percent values are relative to the total number of datasets in the raw data (902) / data corpus (400). 2
Percent values are relative to the frequency in the data corpus. 3
No episodes with at leastfive observations before, during, and after the drug administration were found.
doi:10.1371/journal.pone.0136131.t001
Data
Corpus
of
Temporal
Correla
tions
PLOS
ONE
|DOI:10.137
1/journal.p
one.0136131
August
24,
2015
6/1
Before using the software, all participants were informed about the purpose of the study and about the usage of the data. The software did not allow starting the data collection before a par-ticipant had explicitly declared consent. No incentives were offered.
Data Classification
Each curve was finally classified according to the majority of the rater’s votes. Possible stand-offs would have been classified as“no assessment”, but this case did not occur. Since one of the main goals of this study was to create a data corpus that reflects real-world data, curves with low inter-rater concordance were not filtered out. Instead, in order to reflect the incertitude, a “concordance value”was calculated by dividing the number of assessors that agreed to the majority call by the total number of assessors (11).
In order to facilitate the following description of the results and the discussion, a rule-based “intricacy”classification will be used, based on the variance of the rater’s votes:
• “low”for curves with nearly total concordance (i.e., 10 or all 11 raters agreed),
• “medium”for curves with high concordance (8 or 9 raters agreed),
• “high”for curves with lower concordance (7 or less raters agreed).
Results
Ground Truth Data Corpus
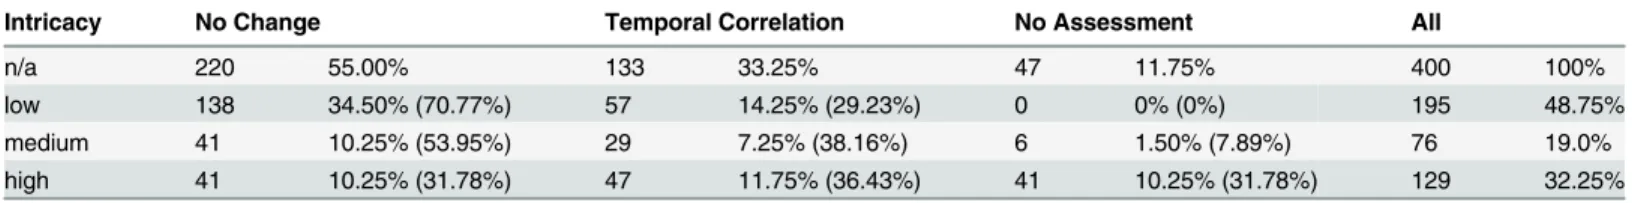
Of the 400 curve plots, 220 (55.0%) were finally classified as“Lab value course does not change noteworthy”(no change), 133 (33.25%) were classified as“Lab value changes with reasonable temporal relationship”(temporal correlation), and 47 (11.75%) were classified as“No assess-ment possible”(no assessment).
The“low”intricacy classification applies to 195 of the 400 curves (48.75%). Another 76 (19.0%) belong to the“medium”intricacy group and the remaining 129 (32.25%) are“high” intricacy curves.
Fig 2. Screenshot of the software tool used for the assessment of the data.
The inter-rater agreement, determined by calculating Krippendorff’sα[17], wasα= 0.453 for the whole data corpus. However, this figure is of very limited value (seeDicussionsection) and only presented for the sake of completeness.
For a more detailed breakdown seeTable 1andTable 2. The average length of the drug administration episodes is (9.81 ± 3.96) days and the average length of the overall data episodes (i.e. including the administration-free intervals before and after the administration episode) is (23.36 ± 4.14) days.
Availability of Data and Software
The Ground Truth Data Corpus is available in Extensible Markup Language (XML) format as
S1 File. This data corpus contains the relative days of drug application, the normalized lab
value data with the relative days of their observation and the temporal correlation assessment results (including the majority call and its concordance) for each of the 400 episodes.
The CAT software application described above is available asS2 File. The version published with this article allows for creating different user profiles and for executing the complete assess-ment procedure as executed during the assessassess-ment stage, but it does not require to declare con-sent with the terms of data collection and data usage as in the version originally utilized. The mandatory pause of 3 days between the two rounds has also been removed in this published version. Since the CAT presents predefined curve plots rather than generating them itself,S2 Filealso contains all these plots of the assessed curves in PNG format.
InS3 File, the original, anonymized results of the assessment for each curve are available
together with a software application (see below) which allows for comparing them with the classification results.
Reutilization Tool
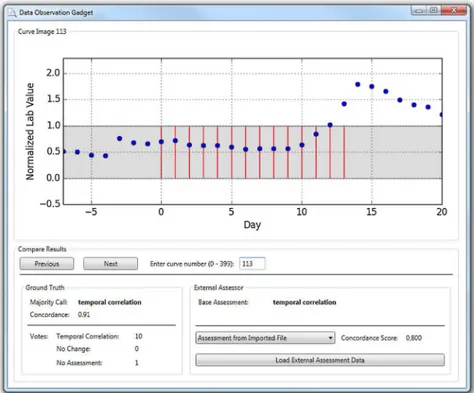
Besides the pure Ground Truth Data Corpus, an additional software application (Data Obser-vation Gadget, DOG;Fig 3) for a facile reutilization of this data is available for the Windows/. NET operating environment (S3 File). This tool can be used for two purposes.
First, it allows for a simple review of the Ground Truth Data Corpus. All 400 curves can be browsed and displayed along with the classification and the detailed assessment results.
Second, it allows for importing external assessment data and for comparing this imported data with the Ground Truth classification, including a basic statistical evaluation by means of the Concordance Score (SC) described in the Discussion section.
Two different file formats can be imported into the DOG using the“Load External Assess-ment Data”button. Any complete result data file produced by the CAT is suitable for import. The original results of the pre-test and the actual assessment are included as an example (file “data_external_original_assessment.xml”withinS3 File). Using the CAT and the DOG, any Table 2. Breakdown of classifications for correlation and intricacy for the Ground Truth Data Corpus (absolute numbers, percent values referred to the total number of curves and in brackets percent values referred to the number of curves of the corresponding intricacy).
Intricacy No Change Temporal Correlation No Assessment All
n/a 220 55.00% 133 33.25% 47 11.75% 400 100%
low 138 34.50% (70.77%) 57 14.25% (29.23%) 0 0% (0%) 195 48.75%
medium 41 10.25% (53.95%) 29 7.25% (38.16%) 6 1.50% (7.89%) 76 19.0%
high 41 10.25% (31.78%) 47 11.75% (36.43%) 41 10.25% (31.78%) 129 32.25%
doi:10.1371/journal.pone.0136131.t002
Data Corpus of Temporal Correlations
interested user can perform her or his own assessment session and compare the personal results to the Ground Truth classification.
Instead of results from the CAT, any other XML file following the structure described in
Fig 4can be imported into the DOG as well. This allows for comparing the results of any
exter-nal software with the Ground Truth classification.S3 Filecontains an example in this format (file“data_external_simple.xml”).
The source code of the DOG is available as open source (S4 File) under CC-BY-SA 4.0 license (https://creativecommons.org/licenses/by-sa/4.0/). Therefore it can be used as a basis for an extension to additional functionality, e.g. a more comprehensive statistical evaluation. Fig 3. Screenshot of the reutilization tool that allows for comparing other assessment results with the ground truth classification.
doi:10.1371/journal.pone.0136131.g003
Fig 4. XML structure needed for loading external data into the DOG reutilization tool.
Discussion
Results
The presented Ground Truth Data Corpus contains a collection of 400 episodes of normalized laboratory parameter values in temporal context with drug administrations. Each episode has been classified by means of a nominal scale whether it contains data that might indicate a tem-poral correlation between the drug administration and the change of the lab value course, whether such a change is not observable or whether human experts cannot definitely decide between those two options due to the data. In addition, each episode has been assigned a con-cordance value which indicates how difficult it is to assess. This reflects the fact that even human experts are subject to ambiguity when faced with a challenging lab value curve. In order to achieve a high reliability of the classifications, the lab value curves were assessed by a total of 11 experts.
One-third of the episodes (33.25%) was classified into the“temporal correlation”category, i.e., the human experts assessed that there was a temporal correlation between the drug admin-istration and the change of a lab value course. This might seem to be an exaggerated quota, but it must be kept in mind that the underlying lab parameters were not only selected by their like-liness to be influenced byadversedrug effects, but also by their likeliness to be affected by intendeddrug effects. On the other hand, this figure is interestingly close to the finding by Clas-sen et. al. [4], who figured out that one-third of hospital admissions is accompanied by ADRs.
For those lab values with an expected ADR frequency of“very common”, the share of “tem-poral correlation”is even higher (52.4%), but this is in line with the expectation (i.e.>10%). On the other hand, those lab values with an ADR frequency expected to be“rare”show more temporal correlations than expected (10.9% vs.<0.1%). Considering only results with low and medium intricacy, the figures are similar: 58.9% of the“very common”lab values and 8.0% of the“rare”lab values were classified into the“temporal correlation”category. A chi-squared test shows that the number of temporal correlations in these intricacy groups is significantly higher for the“very common”lab values (63 out of 107) than for the“rare”lab values (11 out of 138): χ2(df = 1, N = 245) = 74.09, p<.001.
Even if the ~10% temporal correlations that were found for the curves with expected“rare” ADR rate were assumed to be purely coincidental and if these 10% were therefore simply sub-tracted from the findings, it is still interesting, that a share of ~40%“temporal correlation” clas-sifications remains for curves with an expected“very common”ADR rate.
However, it must be kept in mind that a temporal correlation does not equal a causal corre-lation and that it can never be the sole source of evidence for an ADR. Therefore, many of the temporal correlations might be caused by other confounders (especially when derived from data that has been collected from treatment in a university hospital).
The“Leucocytes Count”lab parameter was initially selected due to its expected response to Filgrastim. Although more than a half of the leucocytes curves were assessed as“temporal cor-relation”(51.6%), this share is far from 100%. Besides the fact that each patient’s response is different, the most probable explanation for this observation is, that the drug was administered in doses that were intended to adjust the leucocytes count to the regular values or in small doses that did not affect the curves in a way that a doubtless temporal correlation could be identified.
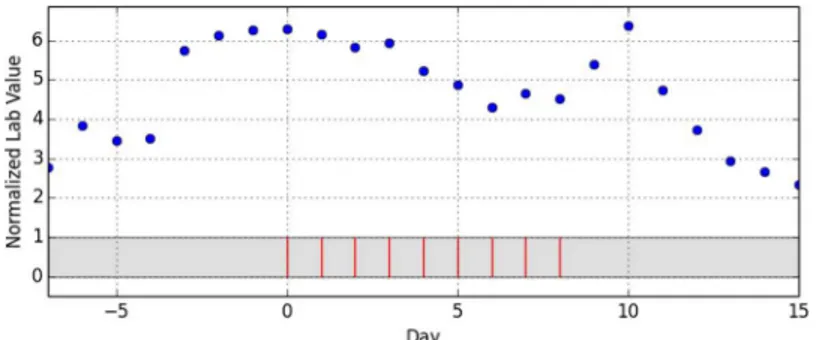
It is noticeable, although not amazing, that the number curves that were finally classified as “no assessment possible”rises together with the level of intricacy: while not a single curve was classified into this category concordantly by all experts, 1.5% of the curves with medium intri-cacy fall into this category as well as 10.25% of the curves with high intriintri-cacy. However, it is also noticeable, that only 31.78% (41/129) of the curves with high intricacy fall into the“no
Data Corpus of Temporal Correlations
assessment”category (seeFig 5for an example). Therefore, a high level of intricacy does not mean that a curve cannot be assessed at all. Another interesting observation is that the group of curves with high intricacy is the only group where the number of curves that were assessed to express a possible temporal correlation almost equals the number of curves that were assessed to show no sign of temporal correlation (45 vs. 43 curves).
Purpose & Usage
The main purpose of this data corpus is the provision of data for further research and the pro-vision of a ground truth which allows for comparing the outcome of other assessments of the data with the outcome of assessments made by human experts.
Besides the pure open access availability of such a data collection, which–to our best knowl-edge–has never been published before, it can serve as a contribution towards systematic, com-puterized ADR detection in retrospective data. Therefore, it contributes to similar efforts like the“SIDER2”database of phenotypic effects of drugs [18], the“OFFSIDES”database of off-label side effects [19] and the“TWOSIDES”database of drug-drug interactions [19].
With the lab value curve data as a basis, algorithms can be developed, and with the corre-sponding classification made by human experts, these algorithms can immediately be vali-dated. Due to the normalization of the lab value data, it allows for a generic approach rather than for specific or solitary drug/lab value combinations.
However, about one-third (33.25%) of the assessments was assigned to the high intricacy group (as defined above). In this group, 5–7 out of 11 raters agreed to the majority call. Having three result classes, a high rate of chance agreement is likely for this group, thus limiting the quality of the call and making the classification somewhat arbitrary. Therefore, it should be considered carefully, whether this share of the data corpus is suitable for a desired usage.
Applicability of Statistical Standard Measures
A quality measure of data that is based on human assessment is the agreement among indepen-dent observers. A number of statistical measures are established (Scott’sπ[20], Cohen’sκ[21],
Fleiss’κ[22], Krippendorff’sα[23,24]) and Hayes et. al. [25] discussed the most popular ones, finally recommending Krippendorff’sαas the best suited for nominally scaled data. Therefore, αwas calculated for the data assessment, yielding a rather low value ofα= 0.453 for the overall data corpus. However, all these measures (including Krippendorff’sα) have corrections for chance agreement and this is a major pitfall, since these corrections presume that all items that were assessed are subject to the same level of difficulty as regards assessing them. The presented data corpus, on the contrary, is derived from real-world data and not constructed or filtered to contain only ideal data. Therefore, it contains elements with different levels of difficulty which Fig 5. Example for a curve with“no assessment”and high intricacy (curve #129).
impedes the application of standard statistical measures. Nearly half of the data (48.75%) con-sists of curves with low intricacy and another fifth (19%) was classified as medium intricacy, which means that at least 8 of the 11 raters were concordant for these curves (Table 2).
Statistical Evaluation Means
In order to provide a useful means for comparing any other (external, e.g. algorithmic) assess-ment of the Ground Truth data corpus with the assessassess-ment made by human experts as pro-posed above, a simple numerical value is desirable. As discussed above, standard statistical measures for comparing assessments of nominally scaled data are not suitable in this case, since they do not consider item difficulty.
Therefore, we recommend using a defined Concordance Score (SC) which is a weighted
per-cent measure [25] and considers the difficulty by weighting the false assessments:
SC¼ P400
i¼1mici
P400
i¼1ci
ð2Þ
where miis 1 for a matched assessment, miis 0 for a mismatched assessment, ciis the
concor-dance value of the curve’s majority call and SCis the Concordance Score. Using this score
instead of a statistical standard measure reflects the difficulty of the curves and takes into account that even human experts can be at odds with certain curve progressions. Therefore, it is well suited to compare the outcome of a single external assessment (e.g. by an algorithm) with the classification as determined by human experts, thus validating the results of the exter-nal assessment.
Limitations
The first limitation to be mentioned is the selection of only one single drug (Filgrastim) for generating the data. This can possibly cast doubt on the transferability as regards other drugs, but since the curves generated by the normalization process have very different shapes and characteristics, a monoculture is not recognizable and therefore this limitation can be regarded as not too severe. However, further research should be pursued.
The overall number of 400 curves might be considered rather low, especially since not a sin-gle curve with low intricacy was categorized as“no assessment”. However, this magnitude was a reasonable tradeoff between an acceptable number of curves and the effort for the study par-ticipants. Future research to add new data is desirable here, too.
The timeframe of the episodes in this data corpus only considers one week before and after the period of drug administration. Therefore, any changes occurring later than one week after the end of the drug administration are not modeled by this data.
Considering only drug administration episodes with at least five lab value observations before, during, and after the actual drug administration might also limit the reuse of this data corpus. However, the minimum of five observations in each phase was selected as a tradeoff and with the computability of the data corpus in mind. Real world episodes might often consist of fever data points, but these types of episodes are also likely to be out of scope of computa-tional processing and algorithms. By reducing the lab value observation time points to a daily scale, any change within a day could not be observed. This was out of scope of this study, though, and in addition, a more granular observation might raise data protection issues.
Furthermore, the presented data corpus in its current version disregards drug dose information and any other possible confounders, like (for example) applied therapies, addi-tional drugs, findings and diagnoses, which are necessary to assess the causality between a drug
Data Corpus of Temporal Correlations
administration and an ADR. However, it does not raise a claim to be comprehensive. It focuses purely on the temporal correlation which is only one component of causality assessment.
Although the lab values were normalized in order to make them unrecognizable, it cannot be guaranteed that the medical professionals who were in charge to assess them had absolutely no guess which lab value could be underlying. This is due to the fact that not every lab parame-ter can drop below the lower border and not every lab parameparame-ter can e.g. rise tenfold.
The curves that were included into this data corpus were selected randomly out of 902 soli-tary episodes of drug administrations with corresponding lab value observations. A less strict filtering of the initial 4332 cases of drug administrations might have led to a broader basis. However–in order to focus purely on the temporal relationship, it was necessary to find iso-lated episodes. Administration-free intervals of one week before and one week after the drug administration were considered to be the minimum to guarantee this isolation. In order to be able to assess the possible temporal correlation between the drug administration and the lab value course, a dense sampling of lab value observations was inevitable. This policy led to a drop-out of many cases with unsteady or infrequent lab value recordings.
At this point it should finally be mentioned that the WHO criteria for a standardized case causality assessment of ADRs refers to the drugintakewhich–strictly speaking–differs from drugadministration. However, this difference has no practical impact on this work, since it does not really matter if an administrated drug was really ingested. If there was no drug intake, no lab value abnormality would be observable, which could also happen if a drug intake simply did not cause an abnormality.
Outlook
Although the data corpus presented in this article constitutes a result of its own, it is also rather a milestone than the final outcome of a research effort, since it enables two main branches of future research: extension and usage.
As regards possible extensions, it can be strived for overcoming the limitations mentioned above. By taking into account e.g. drug dose and possible confounders of ADRs, this data cor-pus of temporal correlations could possibly be extended to a corcor-pus that includes additional correlations and finally maybe a corpus of real causality relations.
Second, the data collection could be extended generally, by e.g. adding data generated from other drugs and laboratory parameters. Since the CAT software provided asS2 Filepresents curve plots taken from PNG format files, it can directly be re-used by other researchers. The only effort needed is to replace the curve plot image files. However, in order to produce compa-rable results, the protocol for data generation and data assessment should be kept as closely as possible to the procedure described above.
As regards usage, the curve data can be utilized to develop algorithms for the detection of temporal correlations and the expert assessments of the curves can be utilized to validate these algorithms.
Conclusion
In this article, we present the first open data corpus of a computable ground truth of temporal correlations between drug administration and lab value alterations. The data consists of nor-malized laboratory parameter values in temporal context with drug administrations and corre-sponding expert assessments of possible temporal correlations.
Supporting Information
S1 File.“temporal_correlation_groundtruth.zip”.The Ground Truth Dataset in zipped XML format.
(ZIP)
S2 File.“CAT.zip”.The“Curve Assessment Tool”(CAT) software application. This archive also contains the plots of all curves in Portable Network Graphics (PNG) format.
(ZIP)
S3 File.“DOG.zip”.The“Data Observation Gadget”(DOG) software application. This archive also contains the Ground Truth Dataset and the original, anonymized results of the pre-test and the assessment.
(ZIP)
S4 File.“DOG-Sources.zip”.The C# source code of the“Data Observation Gadget”(DOG) software application. This source code is licensed under CC-BY-SA 4.0 (https://
creativecommons.org/licenses/by-sa/4.0/).
(ZIP)
Acknowledgments
We thank all participants of the pre-test and the assessment for spending their time and effort to support this study.
Our special thanks go to Prof. Mackensen and Prof. Krause for providing clinical data from routine treatment.
The present work was performed in fulfillment of the requirements for obtaining the degree “Dr. rer. biol. hum.”from the Friedrich-Alexander-University Erlangen-Nuremberg (FAU).
Author Contributions
Conceived and designed the experiments: Axel Newe LB. Performed the experiments: Axel Newe SW TG Antje Neubert. Analyzed the data: Axel Newe SW TG LB. Wrote the paper: Axel Newe SW Antje Neubert LB HUP MWB RF CF MFN GS TG. Engineered the software: Axel Newe. Obtained permission for publication of data: Axel Newe. Contributed data: MWB RF CF MFN GS.
References
1. World Health Organization. Fact sheet No 293. Medicines: Safety of medicines–adverse drug reac-tions. 2008. Available:http://www.wiredhealthresources.net/resources/NA/WHO-FS_
MedicinesSafetyAdverseReactions.pdf. Accessed 2015 Jul 30.
2. Meier F, Maas R, Sonst A, Patapovas A, Müller F, Plank-Kiegele B, et al. Adverse drug events in patients admitted to an emergency department: an analysis of direct costs. Pharmacoepidemiology and Drug Safety. 2015; 24(2): 176–186. doi:10.1002/pds.3663PMID:24934134.
3. Neubert A, Dormann H, Prokosch HU, Bürkle T, Rascher W, Sojer R, et al. E-pharmacovigilance: development and implementation of a computable knowledge base to identify adverse drug reactions. British Journal of Clinical Pharmacology. 2013; 76(1): 69–77. doi:10.1111/bcp.12127PMID: 23586589.
4. Classen DC, Resar R, Griffin F, Federico F, Frankel T, Kimmel N, et al.‘Global Trigger Tool’Shows That Adverse Events In Hospitals May Be Ten Times Greater Than Previously Measured. Health Affairs. 2011; 30(4): 581–589. doi:10.1377/hlthaff.2011.0190PMID:21471476.
5. Liu Y, LePendu P, Iyer S, Shah NH. Using Temporal Patterns in Medical Records to Discern Adverse Drug Events from Indications. In: AMIA Summits on Translational Science proceedings; 2012. 47–56. PMID:22779050.
Data Corpus of Temporal Correlations
6. Jha AK, DesRoches CM, Campbell EG, Donelan K, Rao SR, Ferris TG, et al. Use of Electronic Health Records in US Hospitals. New England Journal of Medicine. 2009; 360(16): 1628–1638. doi:10.1056/ NEJMsa0900592PMID:19321858.
7. Grönroos P, Irjala K, Heiskanen J, Torniainen K, Forsström J. Using computerized individual medica-tion data to detect drug effects on clinical laboratory tests. Scandinavian Journal of Clinical & Labora-tory Investigation. 1995; 55(S222): 31–36. PMID:7569744.
8. Ramirez E, Carcas A, Borobia A, Lei S, Piñana E, Fudio S, et al. A Pharmacovigilance Program From Laboratory Signals for the Detection and Reporting of Serious Adverse Drug Reactions in Hospitalized Patients. Clinical Pharmacology & Therapeutics. 2010; 87(1): 74–86. doi:10.1038/clpt.2009.185 PMID:19890254.
9. Young DS, Thomas D, Friedman R, Perstaner L. Effects of Drugs on Clinical Laboratory Tests. Clinical Chemistry. 1972; 18(10): 1041–1303. PMID:4561120
10. Siest G. Drug Effects on Laboratory Test Results. Springer; 1980. ISBN: 978–9024724192.
11. Young DS. Effects of Drugs on Clinical Laboratory Tests. 5th ed. Vol 2. Amer Assn for Clinical Chemis-try; 2000. ISBN: 978–1890883249.
12. World Health Organization. The use of the WHO-UMC system for standardised case causality assess-ment. Available:http://www.who.int/medicines/areas/quality_safety/safety_efficacy/WHOcausality_ assessment.pdf. Accessed 2015 Jul 30.
13. Curran WJ. The thalidomide tragedy in Germany: the end of a historic medicolegal trial. The New England Journal of Medicine. 1971; 284(9): 481–482. PMID:5100423.
14. Murphy SN, Weber G, Mendis M, Gainer V, Chueh HC, Churchill S, et al. Serving the Enterprise and Beyond with Informatics for Integrating Biology and the Bedside (i2b2). Journal of the American Medical Informatics Association. 2010; 17(2): 124–130. doi:10.1136/jamia.2009.000893PMID:20190053.
15. Council for International Organizations of Medical Sciences. Guidelines for Preparing Core Clinical-Safety Information on Drugs: Including New Proposals for Investigator's Brochures. 2nd ed. Geneva: Council for International Organizations of Medical Sciences; 1999. ISBN: 978–9290360704.
16. Torsvik T, Lillebo B, Mikkelsen G. Presentation of clinical laboratory results: an experimental compari-son of four visualization techniques. Journal of the American Medical Informatics Association. 2013; 20(2): 325–331. doi:10.1136/amiajnl-2012-001147PMID:23043123.
17. Krippendorff K. Computing Krippendorff 's Alpha-Reliability. 2011. Available:http://repository.upenn. edu/asc_papers/43/. Accessed 2015 Jul 30.
18. Kuhn M, Campillos M, Letunic I, Jensen LJ, Bork P. A side effect resource to capture phenotypic effects of drugs. Molecular Systems Biology. 2010; 6: 343. doi:10.1038/msb.2009.98PMID:20087340.
19. Tatonetti NP, Ye PP, Daneshjou R, Altman RB. Data-Driven Prediction of Drug Effects and Interactions. Science Translational Medicine. 2012; 4(125): 125ra31. doi:10.1126/scitranslmed.3003377PMID: 22422992.
20. Scott WA. Reliability of content analysis: The case of nominal scale coding. Public Opinion Quarterly. 1955; 19: 321–325.
21. Cohen J. A coefficient of agreement for nominal scales. Educational and Psychological Measurement. 1960; 20: 37–46.
22. Fleiss JL. Measuring nominal scale agreement among many raters. Psychological Bulletin. 1971; 76 (5): 378–382.
23. Krippendorff K. Estimating the reliability, systematic error and random error of interval data. Educational and Psychological Measurement. 1970; 30: 61–70.
24. Krippendorff K. Content Analysis: An Introduction to Its Methodology. 3rd ed. Thousand Oaks, London, New Delhi: Sage; 2012. ISBN 978–1412983150.