Prediction of soil chemical attributes using optical remote sensing
Aline Marques Genú1* and José Alexandre Melo Demattê2
1Departamento de Agronomia, Universidade Estadual do Centro-Oeste, Rua Simeão Camargo Varela de Sá, 3, 85040-080,
Guarapuava, Paraná, Brazil. 2Departamento de Ciência do Solo, Escola Superior de Agricultura "Luiz de Queiroz”, Universidade de São Paulo, Piracicaba, São Paulo, Brazil. *Author for correspondence. E-mail: agenu@unicentro.br
ABSTRACT. Soil fertility variability management is one of the pioneering and important areas in which Precision Agriculture has been commercially applied. Consequently, the objective of this work was to predict soil chemical attributes through spectral responses. The 1,000 ha study area used for this report was located in Uberlândia, Minas Gerais State, Brazil. Thirty sampling points were established, at which the soil was collected at 3 different depths. The samples were chemically and physically analyzed and the radiometric data obtained in the 400 – 2500 nm range. Multiple regression equations were generated for sum of bases, cation exchange capacity, base saturation, aluminum saturation, pH, P, K, Ca, Mg, Al, and H, all using 60 soil samples. H, Al, m%, and pH were found to have R2 values less than 0.50. Equations with an R2 > 0.50 for the other attributes were tested for the 30 unknown soil samples, and the estimated values were obtained. These values were then compared with those determined by conventional analysis. The coefficients of correlation were higher than 50% for all attributes except P and V%. Results indicated that determining chemical attributes with models that are specific for the region is feasible.
Keywords: soil chemistry, reflectance, laboratory sensor.
RESUMO. Predição de atributos químicos do solo utilizando sensoriamento remoto ótico. Uma das primeiras e mais importantes áreas nas quais a Agricultura de Precisão está sendo comercialmente aplicada é o manejo da variabilidade da fertilidade do solo. Desta forma, o objetivo deste trabalho foi predizer o teor dos atributos químicos do solo através da sua resposta espectral. A área de estudo de 1000 ha localiza-se em Uberlândia, Estado de Minas Gerais. Estabeleceu-se 30 pontos de amostragem nos quais o solo foi coletado em 3 profundidades. As amostras foram analisadas química e fisicamente e, os dados radiométricos obtidos com um sensor em laboratório na faixa de 400 – 2500 nm. Equações de regressão múltipla foram geradas para soma de bases, CTC, saturação por bases, saturação por alumínio, pH, P, K, Ca, Mg, Al e H usando 60 amostras de solo. H, Al, m% e pH obtiveram R2 < 0,50. As equações com R2 > 0,50 para os outros atributos foram testadas para as 30 amostras de solo desconhecidas obtendo-se os valores estimados. Posteriormente, estes valores foram comparados com aqueles determinados pela análise convencional. Os coeficientes de correlação foram maiores que 50% para todos os atributos exceto P e V%. Os resultados indicam que é possível determinar atributos químicos com modelos específicos para a região.
Palavras-chave: química do solo, reflectância, sensor em laboratório.
Introduction
Agricultural producers consider the production area to be homogeneous; therefore, the amount of input for production is applied consistently over the entire area (CORÁ et al., 2004). However, the area typically has considerable differences in its characteristics, especially in regard to soil type, due to pedogenetic processes and factors of soil formation (SOUZA et al., 2008), which leads to variable productivity. For this reason, the identification of management zones that take into account the distribution of soil attributes is important to redefine management practices to
minimize costs and maximize yield (BASNYAT et al., 2004).
The application of fertilizers is, without a doubt, one of the greatest costs involved in agricultural production, and therefore, determining the best possible cost-benefit ratio for this type of input is very important. In this respect, remote sensing has been shown to be a valuable source of information in soil fertility variability management, especially after the establishment of precision agriculture.
analyses. The basic principle behind this method consists of sampling an area in such a way that analysis of those samples will reflect soil fertility in the area (THOMASSON et al., 2001).
Sample collection for fertility purposes consists of one compound sample comprising 20 subsamples for an area no larger than 20 ha, thus generating a considerable opportunity for error. In the case of precision agriculture, however, sampling consists of
1 to 2.5 points ha-1, resulting in high cost. Demattê
et al. (2001) demonstrated that for Oxisols in the State of São Paulo, the recommended sampling rate
was 1 to 2 samples ha-1. The authors also found that
the analysis of soil samples had the greatest impact on production costs.
Therefore, new soil analysis methods that are less costly and faster have been investigated. The application of spectroscopy as a soil analysis method began after Bowers and Hanks (1965) demonstrated that it was possible to quantify soil attributes, such as moisture and organic matter content, by using reflected energy. In view of this, our work aimed to quantify soil chemical attributes using spectral data obtained in the laboratory and establishing their relationship to chemical management. It is expected that evaluation of the spectral data will show a correlation with the soil’s chemical attributes, making quantification of these attributes possible.
Material and methods
Soil sampling and study area characterization
The 1,000 ha study area, located in Uberlândia, Minas Gerais State, Brazil, was defined by the
geographical coordinates 19°27’ - 19°23’ latitude S
and 47°57’ - 47°51’ longitude W. The climate was
characterized by a rainy season from October to April and a dry period from May to September.
Thirty points were sampled at three depths, 0 - 20, 40 – 60, and 80 - 100 cm, referred to respectively as A, B, and C. The ninety collected samples were dried, ground and sieved. After that, chemical analyses were performed according to Brazilian
guidelines reported in Raij et al. (1987) for pH, OM,
Ca, Mg, K, P, Al and H + Al (potential acidity). The SB (sum of bases), CEC (cation exchange capacity), V% (base saturation) and m% (aluminum saturation) values were then calculated.
Obtaining the spectral data
The sample spectral data were obtained in the laboratory with an Infra Red Intelligent Spectroradiometer (IRIS) sensor ranging from 400 to 2,500 nm. The geometry of the system was based
on positioning the sensor 27 cm above the sample, which was placed in a Petri dish measuring 9 cm in diameter. The lighting source, a 650 W halogen lamp, produced a non-collimated ray toward the target plane and was positioned 61 cm from the
target at a zenithal angle of 20°. The standard
reference utilized was a white spectralon plate with reflectance calibrated at 100 %. The spectral ratio between the radiation flow reflected by the reference surface and the sample generated the bidirectional reflectance factor (NICODEMUS et al., 1977).
Statistical analysis
The statistical analysis was performed between the reflectance data obtained in the laboratory for the different chemical attributes of the soils (SB,
CEC, V%, m%, pH in CaCl2, P, K, Ca and Mg, Al
and H) studied. Twenty-two bands (B) and 13
heights (H) (in nm) were selected for the spectral
data: B1: 420-481, B2: 481, B3: 481-596, B4:
596-710, B5: 710-814, B6: 814-975, B7: 975-1350, B8:
1350-1417, B9: 1417, B10: 1417-1449, B11:
1449-1793, B12: 1793-1831, B13: 1865-1927, B14: 1927,
B15: 1927-2102, B16: 2101-2139, B17: 2139-2206,
B18: 2206, B19: 2206-2258, B20: 2258, B21:
2258-2389, B22: 2389-2498; H1: 469-532, H2: 532-768,
H3: 768-876, H4: 876-1353, H5: 1353-1411, H6:
1411-1439, H7: 1439-1783, H8: 1860-1923, H9:
1923-2120, H10: 2120-2206, H11: 2206-2258, H12:
2258-2389, and H13: 2389-2498, as suggested by
Nanni and Demattê (2006).
Initially, variables (bands and heights) were selected for each soil attribute through stepwise analysis. Next, a multi-colinearity test was used to eliminate one or more of the variables that acted concurrently by estimating the same attribute that caused an overestimation of that attribute. Then, a statistical model was generated using 60 soil samples and a multiple linear regression analysis. These analyses were performed with the Statistical Analysis System (SAS, 1999). Estimated values were then generated for 30 samples that were meant for testing. These values were obtained only for
attributes whose R2 from the multiple regression
equation showed values higher than 0.50. Next, a correlation analysis between values determined in the laboratory (DV) and those estimated (EV) by radiometry was conducted.
Results and discussion
The attributes m%, pH in CaCl2,and Al did not
reported by Dunn et al. (2002), Chang et al. (2001), Malley et al. (1999), or Nanni and Demattê (2006).
Another attribute that showed an R2 value smaller than
0.5 was hydrogen (0.42). It was interesting to note that the four attributes showing the smallest coefficients of determination were all related (pH and H, m% and Al). Therefore, it could be expected that as the base content increased, an increase in reflectivity also occurred, a result verified by Demattê et al. (2004). On the other hand, little information was available on the action of elements related to soil acidity, such as H, Al, and pH. The lack of precise results for those elements indicated that there was not a logical definition for their increases and decreases as a function of reflected energy.
For SB, V% and CEC, R2 values of 0.83, 0.77, and
0.88 were obtained, respectively (Table 1). Other authors reported values that were similar to those observed (CHANG et al., 2001; GENÚ et al., 2010). However, Demattê and Garcia (1999) found coefficients that were smaller than 0.5 for the same three attributes. The potential CEC (pH 7.0) is an attribute determined by the sum of exchangeable bases, H, and Al. Therefore, the incident energy on the elements that make up CEC reflect the soil’s retention capacity. In the area under consideration, CEC was low
in most soil samples (approximately 42 mmolc dm–3).
In other words, even when the data did not show great variation, the correlation was reasonable, indicating that CEC directly influenced reflected energy.
The exchangeable bases (K, Ca and Mg) and
phosphorous showed R2 values between 0.67 and 0.84
(Table 1), which were considered satisfactory and agreed with those obtained by Thomasson et al. (2001). However, Dematê and Garcia (1999) obtained values smaller than 0.4 for these four elements, whereas
Malley et al. (1999) reported R2 values higher than 0.9
for the same nutrients. The differences observed between results obtained in this work and other results cited in the literature could be related to the equipment utilized, which have different resolutions, or with selection of the best bands to carry out the tests, as observed by McBratney et al. (2006).
Additionally, the variation in results that were more or less reliable indicated that the deviations were related to the sampling locations and regions. While Demattê and Garcia (1999) correlated chemical elements with reflectance in soil samples from distinct regions in the State of Paraná, an area adding up to 25,620 ha with a total of 45 samples, Thomasson et al. (2001) in turn evaluated areas of approximately 273 ha with 724 samples. Nanni and Demattê (2006) followed the same line by studying an area of 280 ha with a high sampling density. In chemical terms, everything indicated that models should be evaluated for and constructed from smaller areas.
In order to verify if it was possible to utilize these equations to predict soil chemical attributes, those
attributes with R2 higher than 0.5 were tested using
30 samples that were not utilized to generate the model. These samples were used to make scatter plots comparing the values determined in the soil analysis laboratory (DV) with the values estimated by the spectral models.
It could be observed that the coefficients obtained in the correlations for the chemical attributes under study were all greater than 0.5 (Figure 1). The sum of bases (SB) and CEC also
showed R2 values greater than 0.5 (Figures 1a and
b), which was in agreement with Nanni and Demattê (2006). Phosphorus (Figure 1d) had the
smallest R2 (0.40) when compared with potassium,
magnesium, and calcium (Figures 1c, e, and f, respectively), but V% had the lowest coefficient at 0.35 (Figure 1g).
It was interesting to notice that the sum of bases (SB) and the exchangeable bases studied (K, Ca and Mg) were all related and had high correlation coefficients (Figures 1a, c, e, and f). However, both CEC and V% were also related, both having potential acidity (H + Al) involved in their determination. As observed in Table 1, the
equations obtained had low R2, indicating that there
was interference with a spectral correlation of these attributes.
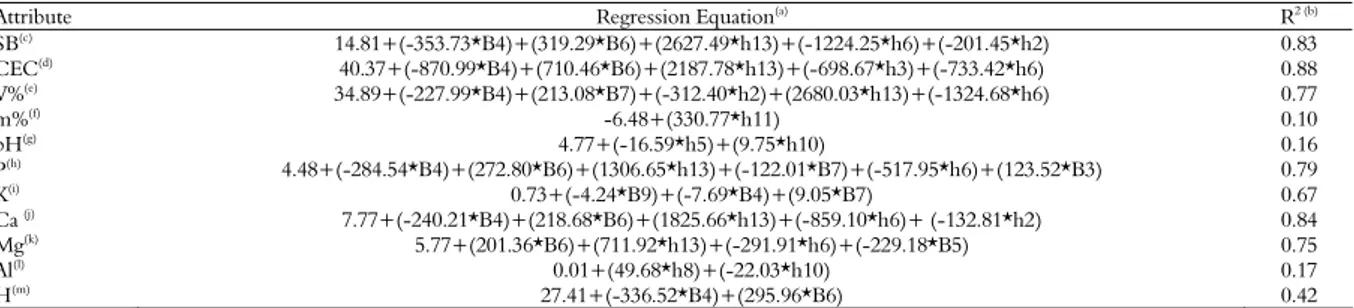
Table 1. Multiple linear regression for quantitative prediction (estimative) of soil chemical properties by reflected data (bands and heights).
Attribute Regression Equation(a) R2 (b)
SB(c) 14.81+(-353.73*B4)+(319.29*B6)+(2627.49*h13)+(-1224.25*h6)+(-201.45*h2) 0.83
CEC(d) 40.37+(-870.99*B4)+(710.46*B6)+(2187.78*h13)+(-698.67*h3)+(-733.42*h6) 0.88
V%(e) 34.89+(-227.99*B4)+(213.08*B7)+(-312.40*h2)+(2680.03*h13)+(-1324.68*h6) 0.77
m%(f)
-6.48+(330.77*h11) 0.10
pH(g) 4.77+(-16.59*h5)+(9.75*h10) 0.16
P(h) 4.48+(-284.54*B4)+(272.80*B6)+(1306.65*h13)+(-122.01*B7)+(-517.95*h6)+(123.52*B3) 0.79
K(i) 0.73+(-4.24*B9)+(-7.69*B4)+(9.05*B7) 0.67
Ca (j) 7.77+(-240.21*B4)+(218.68*B6)+(1825.66*h13)+(-859.10*h6)+ (-132.81*h2) 0.84
Mg(k)
5.77+(201.36*B6)+(711.92*h13)+(-291.91*h6)+(-229.18*B5) 0.75
Al(l) 0.01+(49.68*h8)+(-22.03*h10) 0.17
H(m) 27.41+(-336.52*B4)+(295.96*B6) 0.42
aB1...B22, h1...h13 bands and heights selected, respectively; bSignificant at 5% of probability; cSum of bases; dCation exchange capacity; eBase saturation; fAluminum saturation; gpH
a) Sum of bases (SB) b) Cation Exchange Capacity (CEC)
ŷ = 0.79x + 8.67; R2
= 0.82; r = 0.90 ŷ = 0.66x + 18.55; R2
= 0.56; r = 0.75
E
V
(m
mo
lc
dm
-3)
E
V
(
m
mo
lc
dm
-3)
c) Potassium (K) d) Phosphorus (P)
ŷ = 1.32x + 0.01; R2 = 0.76; r = 0.88 ŷ = 0.26x + 5.61; R2 = 0.40; r = 0.63
E
V
(m
mo
lc
dm
-3)
E
V
(
m
m
o
lc
dm
-3)
e) Magnesium (Mg) f) Calcium (Ca)
ŷ = 0.59x + 2.89; R2 = 0.59; r = 0.77 ŷ = 0.61x + 6.64; R2 = 0.68; r = 0.82
EV
(m
m
o
lc
dm
-3)
E
V
(
m
m
o
lc
dm
-3)
DV (mmolc dm-3) DV (mmolc dm-3)
g) Base saturation (V%)
ŷ = 0.53x + 12.52; R2 = 0.35; r = 0.59
DV (%)
Figure 1. Correlations between values determined in the laboratory (DV) and estimated from spectral data (EV) for soil chemical attributes.
With the advent of Precision Agriculture and the need for optimizing and rationalizing soil sample costs, new research projects on remote sensing have been conducted, with a new emphasis placed on soil chemistry. Under this new perspective, Demattê et al. (2004) determined that the application of agro-industrial liquid residues from sugarcane promoted chemical alterations in the soil samples (increasing K and Ca, for example), which in turn were observed from reflectance. In this case, the authors verified a
change in reflectance intensity and demonstrated the importance of the elements present in the soil solution on reflected energy.
Based on these questions, papers, such as those by Thomasson et al. (2001) and Dunn et al. (2002), indicated that electromagnetic energy, when studied in detail on a per band basis, was capable of detecting variations in exchangeable elements. This work, according to the results presented in Table 1 and Figure 1, verified the results obtained in these
0 10 20 30 40 50 60 70
0 10 20 30 40 50 60 70
0 20 40 60 80 100
0 20 40 60 80 100 0
20 40 60 80 100 120
0 20 40 60 80 100 120
0.0 4.0 8.0 12.0 16.0
0.0 4.0 8.0 12.0 16.0
0 20 40 60 80 100
0 20 40 60 80 100
0 5 10 15 20
0 5 10 15 2
0 10 20 30 40 50
0 10 20 30 40 50
EV
(%
papers and indicated that the electromagnetic spectrum was influenced by these elements. Therefore, these elements are detectable depending on the evaluation methodology.
Conclusion
It was possible to estimate CEC, SB, K, Ca, and Mg content of soils for the region under study from the spectral responses and at levels comparable to those values found from specific models.
References
BASNYAT, P.; McCONKEY, B.; MEINERT, B.; GATKZE, C.; NOBLE, G. Agriculture field characterization using aerial photograph and satellite imagery. IEEE Geoscience and Remote Sensing Letters, v. 1. n. 1, p. 7-10, 2004.
BOWERS, S. A.; HANKS, R. J. Reflection of radiant energy from soils. Soil Science, v. 100, n. 2, p. 130-138, 1965. CHANG, C. W.; LAIRD, D. A.; MAUSBACH, M. J.; HURBURGH JUNIOR, C. R. Near-infrared reflectance spectroscopy - principal components regression analyses of soil properties. Soil Science Society of America Journal, v. 65, n. 2, p. 480-490, 2001.
CORÁ, J. E.; ARAUJO, A. V.; PEREIRA, G. T.; BERALDO, J. M. G. Variabilidade especial de atributos do solo para adoção do sistema de agricultura de precisão na cultura de cana-de-açúcar. Revista Brasileira de Ciência do Solo, v. 28, n. 6, p. 1013-1021, 2004.
DEMATTÊ, J. A. M.; GARCIA, G. J. Avaliação de atributos de Latossolo Bruno e de Terra Bruna estruturada da região de Guarapuava, Paraná, por meio de sua energia refletida. Revista Brasileira de Ciência do Solo, v. 23, n. 2, p. 343-355, 1999.
DEMATTÊ, J. A. M.; DEMATTÊ, J. L. I.; CAMARGO, W. P.; FIORIO, P. R.; NANNI, M. R. Remote sensing in the recognition and mapping of tropical soils developed on topographic sequences. Mapping Science and Remote Sensing, v. 38, n. 2, p. 79-102, 2001.
DEMATTÊ, J. A. M.; GAMA, M. A. P.; COOPER, M.; ARAÚJO, J. C.; NANNI, M. R.; FIORIO, P. R. Effect of fermentation residue on the spectral reflectance properties of soils. Geoderma, v. 120, n. 3-4, p. 187-200, 2004.
DUNN, B. W.; BEECHER, H. G.; BATTEN, G. D.; CIAVARELLA, S. The potential of near-infrared reflectance spectroscopy for soil analysis – a case study
from the Riverine Plain of south-eastern Australia. Australian Journal of Experimental Agriculture, v. 42, n. 5, p. 607-614, 2002.
GENÚ, A. M.; DEMATTÊ, J. A. M.; FIORIO, P. R. Análise espectral de solos da Região de Mogi-Guaçú (SP). Semina: Ciências Agrárias, v. 31, supl. 1, p. 1235-1244, 2010.
MALLEY, D. F.; YESMIN, L.; WRAY, D.; EDWARDS, S. Application of near-infrared spectroscopy in analysis of soil mineral nutrients. Communications in Soil Science and Plant Analysis, v. 30, n. 7-8, p. 999-1012, 1999.
McBRATNEY, A. B.; MINASNY, B.; VISCARRA ROSSEL, R. Spectral soil analysis and inference systems: a powerful combination for solving the soil data crisis. Geoderma, v. 136, n. 1-2, p. 272-278, 2006.
NANNI, M. R.; DEMATTÊ, J. A. M. Spectral reflectance methodology in comparison to traditional soil analysis. Soil Science Society of America Journal, v. 70, n. 2, p. 393-407, 2006.
NICODEMUS, F. E.; RICHMOND, J. C.; HSIA, J. J.; GINSBERG, I. W.; LIMPERIS, T. Geometrical considerations and nomenclature for reflectance. Washington, D.C.: U.S. Department of Commerce, 1977. (NBS Monograph 160).
RAIJ, B. Van; QUAGGIO, J. A.; CANTARELLA, H.; FERREIRA, M. E.; LOPES, A. S.; BATAGLIA, C. O. Análise química do solo para fins de fertilidade. Campinas: Fundação Cargill, 1987.
SAS-Statistical Analisys System. Statistical analisys system: user’s guide version 8.2. Cary: Statistical Analysis System Institute, 1999.
SOUZA, G. S.; LIMA, J. S. S.; SILVA, S. A.; OLIVEIRA, R. B. Variabilidade espacial de atributos químicos em um Argissolo sob pastagem. Acta Scientiarum. Agronomy, v. 30, n. 4, p. 589-596, 2008.
THOMASSON, J. A.; SUI, R.; COX, M. S.; AL-RAJEHY, A. Soil reflectance sensing for determining soil properties in precision agriculture. Transactions of the ASAE, v. 44, n. 6, p. 1445-1453, 2001.
Received on August 17, 2009. Accepted on May 31, 2010.