93
EFFECT OF USING NUTRITION MINERALS AND GROWTH
SUBSTANCE ON PHYSICAL PROPERTIES OF ORANGE FRUITS
Tarek FOUDA, Shimaa SALAH
Tanta University, Faculty of Agriculture, Agricultural Engineering Department, Egypt,
Phone: +201228476266,+ 201146874272 Fax: 0020403455570, E-mails: [email protected], [email protected]
Corresponding author: [email protected]
Abstract
This work was carried to investigate the characterization of orange fruits under using applications of nutrition minerals and one application of growth substance on physical properties of orange fruits at private farm in wadi el-netron, ELbehari governorate, Egypt during winter 2011to predict maturity stage of orange fruits . The physical properties including aspect ratio(AR), Area of flat surface(Af), Area of transverse surface (At), Arithmetic diameter (Da), Density (ρ), Geometric diameter (Dg), surface area (Sa), sphericity, Volume (V) and weight and the results revealed that, the high increasing percentage of orange fruits were considered as follows 9.24, 17.08, 22.65, 9.70, 27.16, 9.70, 20.45, 6.38, 24.07 and 28.84 %
Key words: orange, nutrition minerals and maturity stage, physical properties
INTRODUCTION
Orange is an important horticultural produce around the world amounting to millions of tons per annum and is projected to grow by as much as 64 million by 2010.
Although citrus occupies the greatest planted area among all grown fruit area in Egypt, the exportation of fresh citrus fruits to foreign markets is still limited. Therefore, any effort direction towards maintaining fruit quality and reducing postharvest losses is important for increasing the National income.
Citrus fruits and juices generally serve as primary sources of human daily requirement of vitamin C, their demand for and acceptance depending mainly on their nutritional value, flavour, aroma and then on colour, texture and cloudiness.
The physical parameters of fruits are important indicators of their maturation and internal and external quality, decisive factors for accomplishment of market demands that have encouraged a lot of researches under different conditions overseas.
Physical properties data are important in analysis of the behavior of the product to perform various post harvest operations. Generally, grading of fruits is done based on
PRINT ISSN 2284-7995, E-ISSN 2285-3952
94
while the solids content of potatoes, which determines suitability for manufacture of crisps and dried products, relates to density. Sorting on the basis of density can be achieved using flotation in brine at different concentrations [2]. Size and shape are important physical attributes of foods that are used in screening, grading, and quality control of foods. The dimensions can be measured using a micrometer or caliper. The micrometer is a simple instrument used to measure distances between surfaces. Most micrometers have a frame, anvil, spindle, sleeve, thimble, and ratchet stop. Micrometer used to measure the outside diameters, inside diameters, the distance between parallel surfaces, and the depth of holes. They also added that, shape is also important in heat and mass transfer calculations, screening solids to separate foreign materials, grading of fruits and vegetables, and evaluating the quality of food materials. The shape of a food material is usually expressed in terms of its sphericity and aspect ratio [8]. An image processing based technique was developed to measure volume and mass of citrus fruits such as lemons, limes, oranges, and tangerines. The technique uses two cameras to give perpendicular views of the fruit coefficient of determination (R2) for lemon, lime, orange, and tangerine were 0.962, 0.970, 0.985, and 0.959, respectively. The characterization results for various citrus fruits showed that the volume and mass are highly correlated [6]. The fruit physical properties of ‘Grand Naine’ banana plants significantly increased as a result of using Effective Micro-organisms (EM1) as a biofertilizer. The treatment which received (40 kg P2O5+ EM1) gave the highest value on all treatments during both seasons. Pulp TSS%, acidity%, TSS/acid ratio, starch%, total sugars%, N%, P%, and K% of
‘GrandNaine’ ripe fruits increased by adding EM1 [3]. Projected area (cm2) of orange (Valencia) in the horizontal orientation and
vertical orientation (mean ± standard deviation) were 35.68±7.52 , 34.46 and Length (mm)69.79±7.85 and indicated that
the high R2 values may be adequate for designing and developing a specific sizing
system for oranges based on their masses and volumes, and for estimating the surface area and geometric mean diameter of the orange cultivars and mutants.R2 value showing the relationship between mass and surface area was 0.9669, R2 value showing the relationship between volume and surface area was 0.9722, R2 value showing the relationship between mass and volume was 0.9862,R2 value showing the relationship between Geometric mean diameter and volume was 0.9 64 and R2 value showing the relationship between Geometric mean diameter and mass was 0.9616 [9]. The maximum value of orange fruits (Valencia) length was 75.04 mm, while the minimum value was 70.06 mm. The maximum value of width was 79.54 mm, while the minimum value was 74.66 mm. The maximum value of thickness was 78.87 mm, while the minimum value was 74.56mm. The maximum value of arithmetic diameter was 77.82 mm, while the minimum value was 74.27 mm [7].
MATERIALS AND METHODS
An experiment was carried out in a private farm at wadi elnetron, ELbehari governorate, Egypt from 13 November 2011 to 24 December 2011, to detect orange fruits maturity of Valencia orange fruits under using some applications of nutrition minerals and growth substance. Also to study the effect of the physical properties on orange fruits maturity
Materials
- Valencia orange fruits.
Orange sample varieties were obtained from the field at different maturity stages.
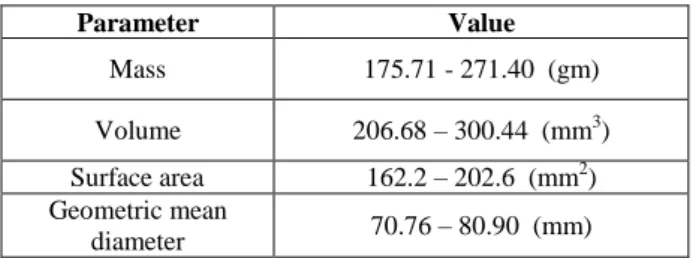
Table 1.Some physiochemical characteristics of orange fruit Valencia
Parameter Value
Mass 175.71 - 271.40 (gm)
Volume 206.68 – 300.44 (mm3)
Surface area 162.2 – 202.6 (mm2) Geometric mean
diameter 70.76 – 80.90 (mm)
95 selected randomized. All samples were
individually numbered.
Instruments
-Digital venire caliper
A digital vernire caliper was used for measuring the dimensions of orange fruits to determine Physical properties with accuracy of 0.01mm.
-Electrical digital scale
An Electrical digital balance was accuracy up to .0001 gm was used for measuring the mass of orange fruits.
Treatments were:
Experiments were carried out to evaluate the effect of using three applications of nutrition minerals which containing (N,P,K) by using (10 cm3/5L)and one application of growth substance on maturity of orange fruits under using through 8 different treatments as follows:
A: Without nutrition minerals + without growth substance (control)
B: Without nutrition minerals + with growth substance.
C: With one application of nutrition minerals + without growth substance
D: With one application of nutrition minerals + with growth substance
E: With two application of nutrition minerals + without growth substance
L: With two applications of nutrition minerals + with growth substance
M: With three application of nutrition minerals + without growth substance
S: With three application of nutrition minerals + with growth substance
Measurements
Different physical of orange fruits were determined after the applications of nutrition minerals and one application of growth substance. The following properties were measured and/or determined and the mean dimensions of orange fruits:
Such as length (L), thickness (T) and the width (W) mm, of the fruits as a digital vernire caliper and the means values of different measurement were used for calculating of Physical properties.
The following equations were applied for calculation of geometric diameter (Dg) in
mm, arithmetic diameter (Da) in mm, volume in mm3 (V), area of flat surface (Af) in mm2 and area of transverse surface (At ) in mm2 of an individual orange fruits in millimeters, density in (gm/cm3) and surface area with mm2 [11].
- Geometric diameter (Dg) = (LWT)1/3 -Arithmetic diameter (Da) = (L+W+T)/3 - Volume = Π/6(LWT)
- Area of flat surface (Af) = Π/4(LW) - Area of transverse surface (At ) = Π/4(WT) - Sphericity: can be defined by different ways. According to the most commonly used definition, sphericity is the ratio of solid volume to the volume of a sphere that has a diameter equal to the major diameter of the object so that it can circumscribe the solid sample. For a spherical particle of diameter, sphericity can be calculated as follows, [5]:
- The aspect ratio (AR) used to express the shape of a fruit.
for each fruit - Density: ρ = m/v Where:
ρ = volume mass of product in gm.cm-3. m= Mass of sample in gm.
v = Volume occupied by the sample in cm3.
-Surface area: Sa = Π (Dg)2 Where:
Sa = surface area;
Dg = Geometric mean diameter
RESULTS AND DISCUSSIONS
In maturity period for orange fruits the weight increase and also the dimensions.
At different ripening stages the color of orange varies from nature green, yellow, to intense orange color.
100
)
.
(
3 / 1
L
W
R
A
ratio
aspect
PRINT ISSN 2284-7995, E-ISSN 2285-3952
96
The results obtained from measuring orange samples showed that, the maximum value of fruit length was 79.45 mm, while the minimum value was 69.10 mm. The maximum value of width was 81.32 mm, while the minimum value was 70.81 mm. The maximum value of thickness was 79.67 mm, while the minimum value was 70.67mm. The maximum value of arithmetic diameter was 78.35 mm, while the minimum value was 70.15 mm. The maximum value of geometric diameter was 78.52 mm, while the minimum value was 70.15 mm as shown in Fig. 1.
-10 0 10 20 30 40 50 60 70 80
50 60 70 80 90
Dimensions, mm Fr eq ue nc y
L W T
Fig. 1. Some physical properties of orange fruit
The results in fig. 2 showing that the maximum and the minimum value of increasing percentage of aspect ratio (AR) were consequently 9.24 and 5.23% in treatments (M: With three application of nutrition minerals + without growth substance) and (C: With one application of nutrition minerals + without growth substance) while the high value of increasing percentage of Area of flat surface (Af) were consequently 20.46 and 17.08 % in treatments (L: With two applications of nutrition minerals + with growth substance) and (B: Without nutrition minerals + with growth substance) and the low value of increasing percentage were consequently 8.69 and 6.30 % in treatments (B: Without nutrition minerals + with growth substance) and (M: With three application of nutrition minerals + without growth substance).
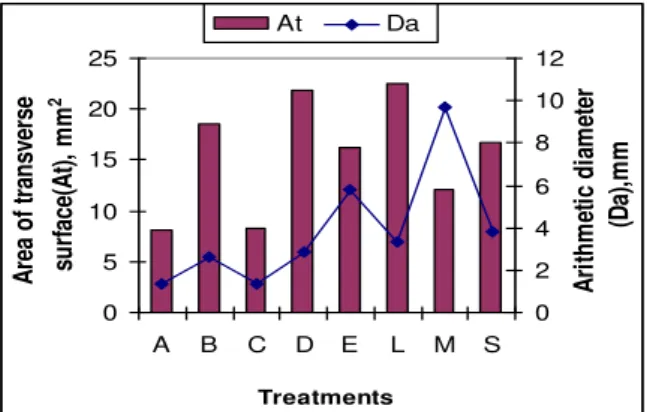
The results in fig. 3 showing that the maximum and the minimum value of increasing percentage of area of transverse surface (At) and were consequently 22.56 and
8.13 % in treatments (L: With two applications of nutrition minerals + with growth substance) and (A: Without nutrition minerals + without growth substance (control)) while the high value of increasing percentage of arithmetic diameter (Da) were consequently 9.70 and 5.82 % in treatments (M: With three application of nutrition minerals + without growth substance) and (E: With two application of nutrition minerals + without growth substance) and the low value of increasing percentage were consequently 1.39 and 1.34 % in treatments (C: With one application of nutrition minerals + without growth substance) and ( A: Without nutrition minerals + without growth substance (control)). 0 2 4 6 8 10
A B C D E L M S
Treatments A sp ec t r at io (A .R ), % 0 5 10 15 20 25 A re a of fl at s ur fa ce ( Af ), mm 2 A.R Af
Fig. 2. Effect of nutrition minerals and growth substance on aspect ratio (AR) and Area of flat surface (Af) during maturity stage
0 5 10 15 20 25
A B C D E L M S
Treatments A re a o f tr an sv er se su rf ac e( At ), mm 2 0 2 4 6 8 10 12 A ri th m et ic d ia m et er (D a) ,m m
At Da
Fig. 3. Effect of nutrition minerals and growth substance on area of transverse surface (At) and arithmetic diameter(Da) during maturity stage
97 (A: Without nutrition minerals + without
growth substance (control)) and (M: With three application of nutrition minerals + without growth substance) while the high value of increasing percentage of geometric diameter (Dg) were consequently 9.70 and 8.72 % in treatments (L: With two applications of nutrition minerals + with growth substance) and (D: With one application of nutrition minerals + with growth substance) and the low value of increasing percentage were consequently 4.12 and 3.77 % in treatments (A: Without nutrition minerals + without growth substance (control)) and (M: With three application of nutrition minerals + without growth substance).
0 5 10 15 20 25 30
A B C D E L M S
Treatments
D
en
si
ty
(
gm
/cm
3)
0 4 8 12
G
eo
m
et
ri
c
d
ia
m
et
er
(D
g
),
m
m
Density Dg
Fig. 4. Effect of nutrition minerals and growth substance on density (ρ) and geometric diameter (Dg) during maturity stage
The results in fig. 5 showing that the maximum and the minimum value of increasing percentage of surface area (Sa) were consequently 20.45 and 7.63 % in treatments (L: With two applications of nutrition minerals + with growth substance) and (M: With three application of nutrition) while the high value of increasing percentage of sphericity were consequently 6.38 and 5.86 % in treatments (M: With three application of nutrition minerals + without growth substance) and (D: With one application of nutrition minerals + with growth substance) and the low value of increasing percentage were consequently 3.41 and 3.05 % in treatments (C: With one application of nutrition minerals + without growth
substance) and (S: With three application of nutrition minerals + with growth substance).
0 5 10 15 20 25
A B C D E L M S
Treatments
S
ur
fa
ce
a
re
a
(Sa
),
mm
2
0 2 4 6 8
sp
he
ri
ci
ty
Sa sphericity
Fig. 5. Effect of nutrition minerals and growth substance on surface area (Sa) and sphericity during maturity stage
The results in fig. 6 showing that the maximum and the minimum value of increasing percentage of Volume (V) were consequently 32.41 and 11.61% in treatments (L: With two applications of nutrition minerals + with growth substance) and (M: With three application of nutrition minerals + without growth substance) while the high value of increasing percentage of weight were consequently 28.84 and 28.45 % in treatments (L: With two applications of nutrition minerals + with growth substance) and (B: Without nutrition minerals + with growth substance) and the low value of increasing percentage were consequently 14.60 and 13.37 % in treatments (E: With two application of nutrition minerals + without growth substance) and (M: With three application of nutrition minerals + without growth substance).
0 10 20 30 40
A B C D E L M S
Treatments
V
ol
um
e
(cm
3 )
0 10 20 30 40
W
ei
gh
t (
gm
)
v weight
PRINT ISSN 2284-7995, E-ISSN 2285-3952
98
CONCLUSIONS
In this work using two applications of nutrition minerals and with growth substance caused high percentage value of Area of flat surface(Af), Area of transverse surface (At), Geometric diameter (Dg), surface area (Sa), Volume (V) and weight were as follow 20.46, 22.56, 9.70, 20.45, 32.41 and 28.84% and by using three application of nutrition minerals and without growth substance caused high percentage value of aspect ratio(AR), Arithmetic diameter (Da) and sphericity were as follow 9.24, 9.70 and 6.38%.
While without using nutrition minerals and without growth substance caused high
percentage value of density (ρ) was 27.16%. The maximum value of fruit length was 79.45 mm, while the minimum value was 69.10 mm. The maximum value of width was 81.32 mm, while the minimum value was 70.81 mm. The maximum value of thickness was 79.67 mm, while the minimum value was 70.67mm.
REFERENCES
[1]Akar, R., Aydinm, C., 2005, Some physical
properties of gumbo fruit varieties. J. Food Eng., (66):
387–393.
[2]Brennan, J. G., 2006, Food Processing Handbook. Chapter(1) Postharvest Handling and Preparation of Foods for Processing. WILEY-VCH Verlag GmbH & Co. KGaA, Weinheim
[3]Ezz, Th.M., Aly, M.A., Saad, M.M., El-Shaieb, F., 2011, Comparative study between bio-and phosphorus fertilization on growth, yield, and fruit quality of banana (Musa spp.) grown on sandy soil. Journal of
the Saudi Society of Agricultural Sciences . xxx, xxx–
xxx.
[4]Lorestani, A.N., Tabatabaeefar, A., 2005, Modelling the mass of kiwi fruit by geometrical attributes. Int. Agrophysics, Polish Academy of Sciences (20): 135-139
[5]Mohsenin, N.N., 1970, Physical Properties of Plant and Animal Materials. New York: Gordon and Breach. [6]Omid, M., Khojastehnazhand, M., Tabatabaeefar, A., 2010, Estimating volume and mass of citrus fruits
by image processing technique. Journal of Food
Engineering,(100):315–321.
[7]Salah, Sh. E., 2013, Using image analysis to predict orange fruits maturity. Ms.c. Thesis, Agric. Eng. Dept. Fac. of Agric., Tanta Univ.
[8]Sahin, S., Sumnu, G. S., 2006, Physical Properties
of Foods. Library of Congress Control Number: 2005937128. Springer Science+Business Media, LLC..
Middle East Technical University. Ankara,
TurkeyScience and technology.
[9]Sayinci, B., Ercisli, S., Ozturk, I., Eryilmaz, Z., Demir, B., 2012, Determination of Size and Shape in the ‘Moro’ Blood Orange and ‘Valencia’ Sweet Orange Cultivar and its Mutants Using Image Processing. Not Bot Horti Agrobo, 40(1):234-242.
[10]Singh, K. K., Reddy, B. S., Varshney, A. C.,
Mangraj, S., 2004,Physical and frictional properties of
orange and sweet lemon. American Society of
Agricultural Engineers ASAE,20(6): 821-825.