www.ccarevista.ufc.br ISSN 1806-6690
Physical characteristics and chemical-nutritional composition of the
castanheira-do-gurguéia fruit (
Dipteryx lacunifera
Ducke)
1Características físicas e composição químico-nutricional do fruto de
castanheira-do-gurguéia (
Dipteryx lacunifera
Ducke)
Francisca Samara de Carvalho Ribeiro2*, Valdomiro Aurélio Barbosa de Souza3 e Ângela Celis de Almeida
Lopes4
Abstract - The castanheira-do-gurguéia is a native fruit tree with great regional importance, whose almond present pleasant flavor and exploration still limited. The objective of this research was to evaluate the physical and chemical-nutritional characteristics of 23 castanheira-do-gurguéia genotypes from natural occurrence areas of Piauí State southwestern savannah. A sample of 30 to 50 fruits per genotype was collected. The physical characteristics analyzed were: fruit mass, pericarp mass, fruit length, larger fruit thickness, fruit length/larger fruit thickness ratio, smaller fruit thickness, fruit length/smaller fruit thickness ratio, larger pericarp thickness, smaller pericarp thickness, longitudinal diameter of the pericarp cavity, vertical diameter of the pericarp cavity, almond mass, almond length, larger almond thickness, smaller almond thickness and almond length/larger almond thickness ratio. The following chemical-nutritional characteristics of almonds were analyzed: fat, crude protein, crude fiber, ash total carbohydrates, crude energy and minerals (P, K, Ca, Mg, Mn, Fe, Cu and Zn). The data were submitted to analysis of variance and genotypes means were compared by Scott-Knott’s test at 5%. There were differences among genotypes for all physical and chemical-nutritional characteristics evaluated, except Ca in the almonds. It was verified the presence of great phenotypic variability in the analyzed germplasm. The genotype G-3 is the most promising in terms of almond mass, almond length and larger almond thickness, and the genotypes G-7, G-10, G-13 and G-23 are the most promising in the chemical-nutritional composition.
Key words -Nut. Genetic vegetal. Savannah of Piauí.
Resumo - A castanheira-do-gurguéia é uma fruteira nativa com grande importância regional, cuja amêndoa apresenta sabor agradável e exploração ainda limitada. O objetivo desta pesquisa foi avaliar as características físicas e químico-nutricionais dos frutos de 23 genótipos, provenientes de áreas de ocorrência natural da espécie nos cerrados do Sudoeste piauiense. Foram coletados de 30 a 50 frutos por genótipo. As características físicas analisadas foram: massa do fruto, massa do pericarpo, comprimento do fruto, espessura maior do fruto, relação comprimento do fruto/espessura maior do fruto, espessura menor do fruto, relação comprimento do fruto/espessura menor do fruto, espessura maior do pericarpo, espessura menor do pericarpo, diâmetro longitudinal da cavidade do pericarpo, diâmetro vertical da cavidade do pericarpo, massa da amêndoa, comprimento da amêndoa, espessura maior da amêndoa, espessura menor da amêndoa e relação comprimento da amêndoa/espessura maior da amêndoa. As seguintes características químico-nutricionais da amêndoa foram analisadas: gordura, proteína bruta, fibra bruta, cinzas, carboidratos totais, energia bruta e minerais (P, K, Ca, Mg, Mn, Fe, Cu e Zn). Os dados foram submetidos à análise de variância e as médias dos genótipos foram comparadas pelo teste de agrupamento Scott-Knott a 5%. Houve diferenças entre os genótipos para todas as características físicas e químico-nutricionais avaliadas, com exceção do teor de Ca da amêndoa. Foi verificada a presença de variabilidade fenotípica no germoplasma analisado. O genótipo G-3 é o mais promissor em termos de massa, comprimento e espessura maior da amêndoa e os genótipos G-7, G-10, G-13 e G-23 os mais promissores em conteúdo químico-nutricional.
Palavras-chave -Noz. Genética vegetal. Cerrado piauiense. *Autor para correspondência
1Recebido para publicação 02/10/2010; aprovado em 03/10/2011
Parte da Dissertação de Mestrado da primeira autora
2Mestrado em Desenvolvimento e Meio Ambiente/MDMA/PRODEMA/TROPEN/Universidade Federal do Piauí, Campus Universitário Petrônio
Portela, Teresina-PI, Brasil, 64.049-550, [email protected]
3Embrapa Meio-Norte, Av. Duque de Caxias 5650, Teresina-PI, Brasil, 64.006-220, (in memoriam)
Material and methods
Study area
The research was carried out in three districts of Piauí’s Southwestern Mesoregion: Bom Jesus, Alvorada do Gurguéia and Palmeira do Piauí, with natural occurrence of castanheira-do-gurguéia. These districts are located in the Microregion of Alto Médio Gurguéia, and their vegetation is mostly formed by the savannah (woodland savannah and dense savannah).
The previous selection of the genotypes of castanheira-do-gurguéia was held in June 2008, when the plants had already well-developed fruits, while the fruits were collected in September 2008, the harvest peak month. Based on fruit production, 23 genotypes were selected and georeferenced (TAB. 1). A sample of 30 to 50 fruits per genotype was collected, depending on the availability of ripe fruit at the collection period. Once collected, fruits were packed in plastic bags, labeled and taken to the Plant Physiology Laboratory of EMBRAPA Mid-North, in Teresina, Piauí State, Brazil, where they were exposed to room temperature to dry out before starting physical measurements. The almond extraction was done manually, using a mechanical lathe, and for the physical measurements of the almond it was used a sample size of 10 almonds per genotype.
Physical characterization of fruits
Fruit physical measurements were done between October to December 2008 and the following characteristics were measured: fruit mass (FM), pericarp mass (PM), fruit length (FL), larger fruit thickness (LFT), smaller fruit thickness (SFT), FL/LFT ratio, FL/SFT ratio, larger pericarp thickness (LPT), smaller pericarp thickness (SPT), longitudinal diameter of the pericarp cavity (LDPC), vertical diameter of the pericarp cavity (VDPC), almond mass (AM), almond length (AL), larger almond thickness (LAT), smaller almond thickness (SAT) and AL/LAT ratio. A precision digital scale was used to do mass measurements. The measurements of length, thickness and diameter were done with a digital caliper.
After the physical measurements, the samples were dried at 60 ºC, for 24 hours, in a forced-air circulation oven, and then the almonds were grounded in a multiprocessor, packed in plastic bags, labeled and stocked up at room temperature until the beginning of the almond chemical-nutritional analyses.
Chemical-nutritional characterization of almonds
The chemical-nutritional analyses were accomplished at the Bromatology Laboratory of EMBRAPA Mid-North and at the Animal Nutrition Laboratory of the Federal University of Piauí, both in Teresina, Piauí State, from April to August 2009.
Introduction
Brazil is one of the greatest repositories of the world’s biodiversity, concentrating around 55000 species of superior plants, or 22% of the world’s total, many of which are endemic (SILVA; BATES, 2002). Regarding native fruit species, the Central Brazil and the Northeast savannahs represent the country’s second greatest genetic repository (RATTER; RIBEIRO, 1996).
Brazil’s Northeast region presents a great diversity of native fruits, many of which have a good prospects
for economic exploitation, such as hog plum (Spondias
mombinL.), “pequi” (Caryocar coriaceum Wittm.), “bacuri”
(Platonia insignis Mart.) and “baru” (Dipteryx alata Vog.),
among others. There is also that species group which, despite its use potential, is known only locally, in some areas of the Northeast. This is the case of the “castanheira-do-gurguéia” (Dipteryx lacunifera Ducke), a species of natural occurrence
in the savannah of the Southwest of Piauí State, where it is explored in an extractivist form by local’s peoples, helping to supplement the family income.
The “castanheira-do-gurguéia” belongs to the Leguminoseae-Papilionoideae family and to the genus
Dipteryx, which includes 14 species, all especially used as
medicinal plants. In Brazil, these species can be found in the Amazon, Northeast, and Center-Western regions. Some are found in Venezuela and others in Central America, more specifically in Costa Rica and Panama (DUCKE, 1948). In
turn, the speciesDipteryx lacuniferaDucke is found in Brazil’s
Mid-North region, comprised by the states of Maranhão and Piauí, with a large occurrence in Piauí’s Southwestern savannah. Vernacularly known as “garampara” and donkey’s nut, the almond of “castanha-do-gurguéia” is a good source of energy, carbohydrate, crude protein and crude fiber; and this
fact indicates, according to Carvalhoet al. (2008), that this
almond has potential use by the almond market.
However, the availability of information on this species is still scarce in the specialized literature (CARVALHO, 2005; CARVALHO, 2008; CARVALHO
et al., 2008; VIEIRA JÚNIOR et al., 2007), and it is
not enough to provide its sustainable management and use. Currently, it is exploited by the extractivism, with no reports on organized plantings. Thus, it is essential do researches that contribute to the increase of scientific knowledge about that species, and also to allow direct strategies favoring its conservation, advances in the domestication process, and its sustainable use.
Table 1 - Geographical location of the castanheira-do-gurguéia genotypes collected in Piauí’s southwestern savannah
C.E: Experimental Field; Pov.: Rural community
Genotypes Collection site District Altitude (m) Latitude Longitude
G-1 C. E. Embrapa Meio-Norte Alvorada-do-Gurguéia-PI 248 08º26’29’’ 43º52’19’’
G-2 C. E. Embrapa Meio-Norte Alvorada-do-Gurguéia-PI 251 08º26’29’’ 43º52’19’’
G-3 Pov. Pitombeira Bom Jesus-PI 328 09º16’14’’ 44º16’28’’
G-4 Pov. Pitombeira Bom Jesus-PI 339 09º16’17’’ 44º16’44’’
G-5 Pov. Pitombeira Bom Jesus-PI 323 09º16’18’’ 44º16’44’’
G-6 Pov. Pitombeira Bom Jesus-PI 369 09º15’58’’ 44º15’57’’
G-7 Pov. Pati Bom Jesus-PI 341 09º11’07’’ 44º14’34’’
G-8 Pov. Pati Bom Jesus-PI 329 09º12’03’’ 44º13’56’’
G-9 Pov. Pati Bom Jesus-PI 333 09º12’02’’ 44º13’57’’
G-10 Pov. Pati Bom Jesus-PI 335 09º12’25’’ 44º13’00’’
G-11 Pov. Pati Bom Jesus-PI 342 09º12’28’’ 44º12’60’’
G-12 Pov. Corrente Bom Jesus-PI 340 09º11’26’’ 44º32’04’’
G-13 Pov. São Gonçalo Bom Jesus-PI 308 09º10’29’’ 44º33’19’’
G-14 Pov. Estreito Bom Jesus-PI 323 09º09’45’’ 44º34’46’’
G-15 Pov. Vereda Seca Bom Jesus-PI 328 09º09’21’’ 44º35’31’’
G-16 Pov. Escalvado Bom Jesus-PI 341 09º09’07’’ 44º37’33’’
G-17 Pov. Pati Bom Jesus-PI 324 09º11’23’’ 44º14’14’’
G-18 Pov. SantaTeresa Bom Jesus-PI 340 09º12’32’’ 44º13’07’’
G-19 Pov. Porteiras Bom Jesus-PI 350 09º11’28’’ 44º13’24’’
G-20 Pov. Porteiras Bom Jesus-PI 334 09º11’31’’ 44º13’39’’
G-21 Pov. Porteiras Bom Jesus-PI 332 09º11’27’’ 44º13’43’’
G-22 Pov. Pati Bom Jesus-PI 332 09º11’33’’ 44º13’55’’
G-23 Pov. Boa Sorte Palmeira do Piauí-PI 293 08º42’40’’ 44º15’12’’
The chemical-nutritional characteristics of the almond analyzed were: fat, crude fiber, crude protein, ash, crude energy, total carbohydrate, and minerals (Ca, P, K, Mg, Cu, Mn, Zn and Fe). The mineral concentrations it were determined by atomic absorption spectrophotometry.
The total carbohydrate concentration it was obtained through the formula TC = 100 - (% crude protein + crude fiber + crude fat) and the crude energy was obtained by the formula: CE = crude protein (g) x 4 kcal + total carbohydrate (g) x 9 kcal + fat (g) x 4 kcal. All the concentrations it were determined by the methods described on the analytical guidelines of (IAL, 2005).
Data analysis
For physical characteristics, it was considered a completely randomized statistical design with 23 treatments (genotypes), in which fruits and kernels per genotype were used as replications. For chemical-nutritional characteristics, it was also considered a completely randomized statistical
design with 23 treatments (genotypes), but in this case with three replications per genotype of almonds.
Initially, it was performed residual analysis of the data with the aim of verifying the existence of differences and heterocedasticity of variances, adjustment of errors to the normal distribution, assumption of independence and additivity of the errors in the mathematical model.
Afterwards, the physical measurements and chemical-nutritional data were submitted to the variance analysis, with their means compared by Scott-Knott’s test, at 5% of significance.
Results and discussion
of the almond are presented in Table 2. The F test indicated significant differences among genotypes, evidencing the existence of genetic variability in the populations studied, as well as the perspective of genetic gain by selection for one or more of these characteristics. The coefficients of variation were mostly lower, evidencing precision in the measurements. With the exception of Ca, the F test also indicated significant differences of the mean squares for the chemical-nutritional characteristics of almonds, evidencing the presence of genetic variability those
Table 2 - Summary of the analysis of variance for physical characteristics of fruits and almonds, and for chemical-nutritional characteristics of almonds in 23 genotypes of castanheira-do-gurguéia
**Significant at 1% by F test. NSNo significant; MQ: mean square; FM: fruit mass; FL: fruit length; LFT: larger fruit thickness; SFT: smaller fruit
thickness; PM: pericarp mass; LDPC: longitudinal diameter of the pericarp cavity; VDPC: vertical diameter of the pericarp cavity; AM: almond mass; AL: almond length; LAT: larger almond thickness; SAT: smaller almond thickness
Characteristics MQ (genotypes) MQ (residue) Mean C.V. (%)
Physical characteristics of fruits and almonds
FM 307.09** 10.76 15.76 25.88
FL 159.46** 8.73 38.11 8.26
LFT 130.23** 5.39 33.78 8.09
Ratio FL/LFT 0.04** 0.01 1.13 3.97
SFT 77.14** 2.54 22.38 8.61
Ratio FL/SFT 0.24** 0.02 1.72 7.48
PM 285.62** 10.13 14.81 26.01
LDPC 86.49** 4.47 27.85 7.52
VDPC 27.50** 1.18 15.88 6.82
AM 0.74** 0.03 0.95 17.64
AL 49.27** 2.73 23.39 7.17
LAT 23.63** 1.28 13.49 8.50
SAT 5.78** 0.25 4.79 10.43
Ratio AL/LAT 0.16** 0.02 1.75 6.47
Chemical-nutritional characteristics of almonds
Ca 3180.19NS 2622.80 152.39 33.61
P 8692.44** 370.15 361.17 5.33
K 80391.37** 8092.74 939.42 9.58
Mg 4304.19** 470.07 171.86 12.62
Cu 0.57** 0.02 1.24 11.00
Mn 225.93** 2.28 9.47 15.96
Zn 1.32** 0.33 3.82 15.08
Fe 3.62** 0.40 4.92 12.80
Crude protein 5.52** 0.33 15.41 3.73
Fat 11.60** 3.38 45.63 4.03
Crude fiber 1.03** 0.19 4.68 9.37
Ash 0.17** 0.03 2.68 6.42
Total carbohydrate 12.74** 3.87 34.28 5.74
Crude energy 349.15** 111.64 552.68 1.91
characteristics among individuals and, therefore, the possibility to identify desirable individuals for using in future breeding programs in this species.
Table 3 - Fruit physical characteristics of 23 castanheira-do-gurguéia genotypes collected in the southwestern savannah of Piauí State
1Means followed by the same letter in columns do not differ from each other by the Scott-Knott’s test at 5%. FM: fruit mass; FL: fruit length; LFT: larger fruit
thickness; SFT: smaller fruit thickness; PM: pericarp mass; LDPC: longitudinal diameter of the pericarp cavity; VDPC: vertical diameter of the pericarp cavity Genotypes1 FM (g) FL (mm) LFT (mm) FL/LFT ratio SFT (mm) FL/SFT ratio PM (g) LDPC (mm) VDPC (mm)
G-1 18.40 c 37.96 d 35.97 c 1.05 h 23.87 c 1.60 f 17.26 c 26.73 c 15.29 c
G-2 20.28 b 41.44 b 37.97 b 1.09 g 24.12 c 1.72 d 18.75 b 28.71 b 17.34 b
G-3 20.18 b 37.90 d 37.03 b 1.02 i 25.70 a 1.48 h 18.95 b 30.01 b 17.96 b
G-4 15.05 d 36.15 e 32.86 e 1.10 f 22.65 d 1.60 f 13.87 d 26.83 c 15.46 c
G-5 20.23 b 39.75 c 35.85 c 1.11 f 24.50 b 1.62 f 18.87 b 28.89 b 18.37 a
G-6 11.14 e 32.84 g 30.31 f 1.08 g 20.98 e 1.59 f 10.35 e 23.95 d 13.62 e
G-7 16.98 d 40.35 c 35.23 c 1.14 e 21.18 e 1.92 b 16.02 d 30.27 b 17.29 b
G-8 11.26 e 37.12 e 30.59 f 1.21 b 20.25 f 1.83 c 10.59 e 28.55 b 13.83 e
G-9 15.37 d 36.43 e 32.03 e 1.14 e 23.06 d 1.58 f 14.64 d 23.34 d 13.44 e
G-10 8.43 f 31.92 g 28.77 g 1.11 f 17.33 h 1.86 c 7.62 f 25.10 c 15.97 c
G-11 12.24 e 38.65 d 32.07 e 1.21 b 20.32 f 1.91 b 11.20 e 31.98 a 17.62 b
G-12 10.08 e 35.43 f 29.73 f 1.19 c 19.81 f 1.79 c 9.37 e 26.42 c 14.59 d
G-13 8.86 f 33.29 g 27.94 g 1.19 c 17.63 h 1.89 b 8.38 f 25.43 c 15.00 c
G-14 15.86 d 35.60 f 32.12 e 1.11 f 23.07 d 1.54 g 15.02 d 27.25 c 15.02 c
G-15 15.48 d 39.90 c 34.09 d 1.17 d 22.90 d 1.74 d 14.80 d 30.79 b 16.98 b
G-16 20.16 b 44.30 a 39.58 a 1.12 f 25.12 b 1.76 d 18.99 b 33.66 a 17.76 b
G-17 22.49 a 41.96 b 37.41 b 1.12 f 25.64 a 1.64 f 21.56 a 32.46 a 19.07 a
G-18 8.43 f 33.54 g 29.89 f 1.12 f 19.05 g 1.76 d 7.41 f 25.66 c 16.25 c
G-19 12.38 e 40.94 b 32.10 e 1.27 a 19.97 f 2.05 a 11.55 e 29.38 b 15.09 c
G-20 18.43 c 42.52 b 36.23 c 1.17 d 23.12 d 1.84 c 17.65 c 29.76 b 15.88 c
G-21 11.55 e 34.83 f 31.30 e 1.11 f 20.42 f 1.71 e 10.85 e 25.99 c 15.48 c
G-22 6.36 g 30.30 h 28.03 g 1.08 g 18.76 g 1.61 f 5.76 g 22.71 d 13.35 e
G-23 12.36 e 37.14 e 32.24 e 1.15 e 20.61 e 1.80 c 11.49 e 26.30 c 14.54 d
Mean 14.55 37.54 33.13 1.13 21.85 1.73 13.63 27.85 15.88
CV(%) 25.88 8.26 8.09 3.97 8.61 7.48 26.01 7.52 6.82
Table 4 - Physical characteristics of almonds of 23 castanheira-do-gurguéia genotypes collected in the southwestern savannah of Piauí State
Genotypes1 AM (g) AL (mm) LAT (mm) SAT (mm) AL/LAT Ratio
G-1 1.13 d 23.37 c 13.55 d 5.58 b 2.45 c
G-2 1.45 b 24.79 b 15.16 c 6.34 a 2.31 d
G-3 1.66 a 27.02 a 17.10 a 5.66 b 2.37 d
G-4 1.14 d 24.19 b 14.66 c 5.87 b 2.36 d
G-5 1.33 c 24.97 b 15.76 b 5.52 b 2.35 d
G-6 0.77 f 20.73 d 12.15 e 5.14 c 2.40 d
G-7 0.93 e 25.86 a 14.41 c 3.80 e 2.85 a
G-8 0.76 f 23.09 c 12.49 e 4.68 d 2.69 b
G-9 0.75 f 21.21 d 12.32 e 4.97 c 2.46 c
G-10 0.81 f 22.28 c 14.56 c 4.18 d 2.38 d
G-11 1.05 d 24.40 b 12.97 d 5.57 b 2.63 b
G-12 0.80 f 22.39 c 11.59 f 4.86 c 2.75 b
genotypes G-22 and G-17 had the lowest and the greatest means, respectively. The genotypes G-16 (33.66 mm), G-17 (32.46 mm) and G-11 (31.98 mm) presented the largest means for the longitudinal diameter of the pericarp cavity (LDPC), while the genotypes G-17 (19.07 mm) and G-5 (18.37 mm) presented the largest means for the vertical diameter of the pericarp cavity (VDPC). For the remaining characteristics, the differences observed, although significant, were of small range.
The genotype G-3 exhibited the highest value for almond mass (AM), with 1.66 g, while the genotype G-13, with 0.57 g of AM, exhibited the lowest mean for this trait. The genotypes G-2 (1.45 g) and G-5 (1.33 g) are also interesting, especially from the standpoint of future use in
breeding programs of the species. Carvalhoet al. (2008),
working with almonds from a mixture of individuals, obtained 0.73 g of AM, a little smaller than the overall mean of 0.95 g obtained in this research. In general, there was the tendency that fruits with larger values of FM also had larger AM’s values (TAB. 5). The genotypes G-17, G-3, G-16 and G-7 showed the largest means of almond length (AL), while the genotype G-3 showed the largest mean for the larger almond thickness (LAT).
Estimates of phenotypic correlation coefficients among nine fruit physical characteristics are shown in Table 5. Most of these correlation coefficients were
positive and of high magnitude (rp> 0.70), indicating
that there should be no major problems in the selection process to improve agronomically important traits, such as FM. The highest phenotypic correlation was found between FM and smaller fruit thickness (SFT)
(rp= 0.97). FM showed high correlation coefficients
1Means followed by the same letter in columns do not differ from each other by the Scott-Knott’s test at 5%. AM: almond mass; AL: almond
length; LAT: larger almond thickness; SAT: smaller almond thickness
G-14 0.94 e 22.89 c 12.92 d 4.97 c 2.56 c
G-15 0.71 f 22.03 c 12.11 e 4.00 d 2.74 b
G-16 1.24 c 26.73 a 14.44 c 4.86 c 2.78 a
G-17 1.09 d 27.21 a 15.15 c 4.06 d 2.84 a
G-18 0.96 e 21.32 d 13.77 d 5.30 c 2.25 d
G-19 0.86 e 24.09 b 12.94 d 4.16 d 2.83 a
G-20 0.77 f 25.39 b 13.71 d 3.61 e 2.93 a
G-21 0.71 f 21.83 c 13.38 d 3.67 e 2.56 c
G-22 0.68 f 18.78 e 11.44 f 4.91 c 2.30 d
G-23 0.77 f 22.31 c 13.05 d 4.36 d 2.58 c
Mean 0.95 23.39 13.49 4.79 2.57
CV(%) 17.64 7.17 8.50 10.43 6.47
Continuação da Tabela 4
with most of the physical characteristics studied, indicating that it can be of great importance in the
selection process. Corrêa et al. (2008), in a study
with baru walnut, also obtained high phenotypic
correlations involving FM [rp= 0.83 between FM and
fruit length (FL); rp= 0.92 between FM and larger fruit
thickness (LFT); and rp= 0.81 between FM and SFT],
which confirms the importance of FM, especially when one has in mind indirect genetic gain by selection. In this research, high phenotypic correlations were also obtained between FL and larger fruit thickness (LFT)
(rp= 0.91); FL and AL (rp= 0.90); FL and longitudinal
diameter of the pericarp cavity (LDPC) (rp= 0.91); LFT
and SFT (rp= 0.93); LFT and AL (rp= 0.89); AM and
larger almond thickness (LAT) (rp=0.89); and FM and
AM (rp= 0.82). In the specific case of the FM and AM,
the high phenotypic correlation coefficient between them is an indication that it is possible to increase the AM by indirect selection for larger or heavier fruit. Relatively low negative correlations were found for FL
and smaller almond thickness (SAT) (rp= -0.17) and for
SAT and LDPC (rp= -0.23), indicating that larger fruits
tend to show less thicker almonds, and less thicker almonds tend to result in larger longitudinal pericarp cavities.
Table 5 - Estimates of the phenotypic correlation coefficients among physical characteristics of fruit and almond of 23 castanheira-do-gurguéia genotypes collected in the southwestern savannah of Piauí State
Characteristics FL LFT SFT AM AL LAT SAT LDPC VDPC
FM 0.85** 0.96** 0.97** 0.82** 0.87** 0.75** 0.33NS 0.77** 0.73**
FL 0.91** 0.76** 0.70** 0.90** 0.57* -0.17NS 0.91** 0.74**
LFT 0.93** 0.86** 0.89** 0.77** 0.39NS 0.80** 0.76**
SFT 0.79** 0.76** 0.68** 0.45NS 0.56* 0.58*
AM 0.77** 0.89** 0.73** 0.56* 0.80**
AL 0.84** 0.22NS 0.88** 0.84**
LAT 0.46NS 0.55* 0.82**
SAT -0.23NS 0.27NS
LDPC 0.84**
**,*Significant coefficients to 1% and 5% byt test, respectively. NSNo significant; FM: fruit mass; FL: fruit length; LFT: larger fruit thickness;
SFT: smaller fruit thickness; LDPC: longitudinal diameter of the pericarp cavity; VDPC: vertical diameter of the pericarp cavity; AM: almond mass; AL: almond length; LAT: larger almond thickness; SAT: smaller almond thickness
Table 6 - Chemical-nutritional characteristics of almonds of 23 castanheira-do-gurguéia genotypes collected in the southwestern savannah of Piauí State
1Means followed by the same letter in columns do not statistically differ from each other by the Scott-Knott’s grouping test at 5%
Genotypes1 Crude protein (%) Fat (%) Crude fiber (%) Ash (%) Total carbohydrate (%) Crude energy (kcal 100 g-1)
G-1 16.14 b 47.31 a 4.21 b 2.53 c 32.35 b 544.89 b
G-2 14.95 c 47.11 a 4.54 b 2.67 c 33.40 b 548.87 b
G-3 15.51 c 48.06 a 3.44 b 2.63 c 33.00 b 551.23 a
G-4 16.63 b 44.17 b 3.97 b 2.52 c 35.23 a 560.23 a
G-5 12.02 e 44.54 b 5.01 a 2.60 c 38.42 a 572.07 a
G-6 13.97 d 45.83 b 5.19 a 2.37 c 35.01 a 554.28 a
G-7 18.03 a 43.10 b 4.46 b 2.52 c 34.41 a 554.17 a
G-8 15.54 c 47.07 a 5.08 a 2.75 c 32.31 b 541.24 b
G-9 15.84 c 47.69 a 4.85 a 2.63 c 31.63 b 538.74 b
G-10 16.42 b 42.22 b 4.87 a 3.08 a 36.49 a 562.97 a
G-11 14.71 c 44.69 b 5.00 a 2.33 c 35.59 a 557.93 a
G-12 15.37 c 50.74 a 5.21 a 2.45 c 28.68 b 522.56 b
G-13 15.11 c 45.12 b 4.76 a 2.85 b 35.01 a 556.00 a
G-14 15.38 c 46.03 b 4.26 b 2.70 c 34.33 a 554.63 a
G-15 13.29 d 45.49 b 5.30 a 2.91 b 35.93 a 558.43 a
G-16 15.86 c 44.35 b 4.20 b 2.88 b 35.58 a 561.08 a
G-17 12.98 d 46.04 b 5.24 a 2.66 c 35.75 a 557.77 a
G-18 15.43 c 47.82 a 4.70 a 2.38 c 32.06 b 541.46 b
G-19 16.47 b 42.97 b 3.70 b 2.53 c 36.86 a 569.50 a
G-20 15.90 c 44.88 b 5.46 a 2.99 b 33.75 b 546.89 b
G-21 15.34 c 45.82 b 4.43 b 2.65 c 34.41 a 554.33 a
G-22 16.21 b 44.96 b 4.05 b 2.68 c 34.78 a 557.71 a
G-23 17.24 a 43.53 b 5.72 a 3.29 a 33.51 b 544.65 b
Mean 15.41 45.63 4.68 2.68 34.28 552.68
one reported by Carvalhoet al. (2008), also for the almond
of the castanheira-do-gurguéia, and lower than those obtained
by Takemotoet al. (2001) and Veraet al. (2009) for baru
walnut, whose means were 23.9% and 26.2%, respectively. However, in comparison to several other almonds one can consider castanha-do-gurguéia as a good source of proteins, presenting values higher than those reported by
Crepaldiet al. (2001) for licuri nut (11.5%); United States
Department of Agriculture (2007) and Oroet al. (2008)
for pecan nut (9.2-10.4%); United States Department of Agriculture (2007) for nutmeg (5.8%) and macadamia (7.9%); and equivalent to those obtained by (TABELA…, 2006) for Brazil nut (14.5%) and European walnut
(18.6%); Carvalho et al. (2008) for chichá nut (17,4%)
and sapucaia nut (18.5%), and by Souzaet al. (2008) also
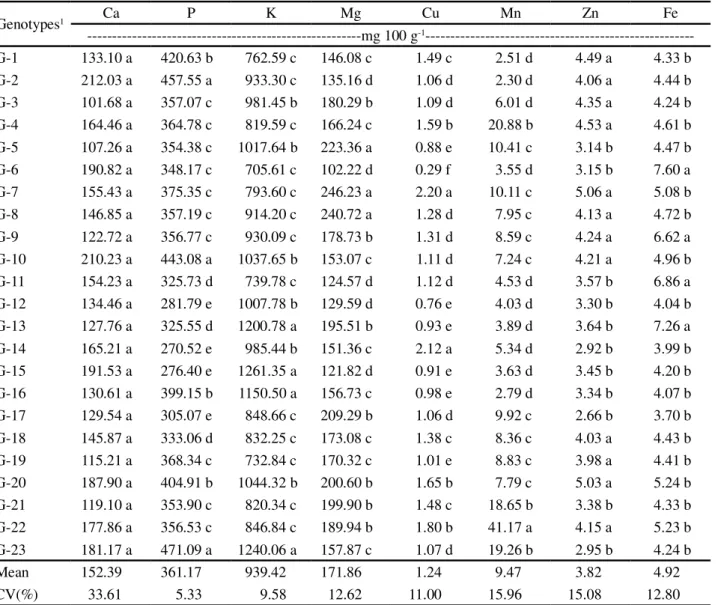
Table 7 -Mineral concentration in almonds of 23 castanheira-do-gurguéia genotypes collected in the southwestern savannah of Piauí State
1Means followed by the same letter in columns do not differ from each other by the Scott-Knott’s grouping test at 5%
Genotypes1 Ca P K Mg Cu Mn Zn Fe
---mg 100 g-1
---G-1 133.10 a 420.63 b 762.59 c 146.08 c 1.49 c 2.51 d 4.49 a 4.33 b
G-2 212.03 a 457.55 a 933.30 c 135.16 d 1.06 d 2.30 d 4.06 a 4.44 b
G-3 101.68 a 357.07 c 981.45 b 180.29 b 1.09 d 6.01 d 4.35 a 4.24 b
G-4 164.46 a 364.78 c 819.59 c 166.24 c 1.59 b 20.88 b 4.53 a 4.61 b
G-5 107.26 a 354.38 c 1017.64 b 223.36 a 0.88 e 10.41 c 3.14 b 4.47 b
G-6 190.82 a 348.17 c 705.61 c 102.22 d 0.29 f 3.55 d 3.15 b 7.60 a
G-7 155.43 a 375.35 c 793.60 c 246.23 a 2.20 a 10.11 c 5.06 a 5.08 b
G-8 146.85 a 357.19 c 914.20 c 240.72 a 1.28 d 7.95 c 4.13 a 4.72 b
G-9 122.72 a 356.77 c 930.09 c 178.73 b 1.31 d 8.59 c 4.24 a 6.62 a
G-10 210.23 a 443.08 a 1037.65 b 153.07 c 1.11 d 7.24 c 4.21 a 4.96 b
G-11 154.23 a 325.73 d 739.78 c 124.57 d 1.12 d 4.53 d 3.57 b 6.86 a
G-12 134.46 a 281.79 e 1007.78 b 129.59 d 0.76 e 4.03 d 3.30 b 4.04 b
G-13 127.76 a 325.55 d 1200.78 a 195.51 b 0.93 e 3.89 d 3.64 b 7.26 a
G-14 165.21 a 270.52 e 985.44 b 151.36 c 2.12 a 5.34 d 2.92 b 3.99 b
G-15 191.53 a 276.40 e 1261.35 a 121.82 d 0.91 e 3.63 d 3.45 b 4.20 b
G-16 130.61 a 399.15 b 1150.50 a 156.73 c 0.98 e 2.79 d 3.34 b 4.07 b
G-17 129.54 a 305.07 e 848.66 c 209.29 b 1.06 d 9.92 c 2.66 b 3.70 b
G-18 145.87 a 333.06 d 832.25 c 173.08 c 1.38 c 8.36 c 4.03 a 4.43 b
G-19 115.21 a 368.34 c 732.84 c 170.32 c 1.01 e 8.83 c 3.98 a 4.41 b
G-20 187.90 a 404.91 b 1044.32 b 200.60 b 1.65 b 7.79 c 5.03 a 5.24 b
G-21 119.10 a 353.90 c 820.34 c 199.90 b 1.48 c 18.65 b 3.38 b 4.33 b
G-22 177.86 a 356.53 c 846.84 c 189.94 b 1.80 b 41.17 a 4.15 a 5.23 b
G-23 181.17 a 471.09 a 1240.06 a 157.87 c 1.07 d 19.26 b 2.95 b 4.24 b
Mean 152.39 361.17 939.42 171.86 1.24 9.47 3.82 4.92
CV(%) 33.61 5.33 9.58 12.62 11.00 15.96 15.08 12.80
for sapucaia nut (19.6%). Only cashew nut (24.5%) (LIMA
et al., 2004), peanut (25.8-27.2%) (TABELA…, 2006;
UNITED STATES DEPARTMENT OF AGRICULTURE, 2007), European walnut (24.9%) (UNITED STATES DEPARTMENT OF AGRICULTURE, 2007) and pequi
almond (25.3%) (LIMAet al., 2007) are richer in protein
than the almond of the castanheira-do-gurguéia.
The fat concentration varied from 42.22% (G-10) to 50.74% (G-12), with a mean of 45.63%. In addition to genotype G-12, also presented high fat concentrations the genotypes G-3, G-18, G-1, G-2, G-8 and G-9, with means between 47% and 48% (TAB. 6). The mean fat concentration of 45.63% found in this work is a little
higher than that obtained by Carvalhoet al. (2008) also
and much higher than those obtained by Takemoto et
al. (2001) and Vera et al. (2009) for baru walnut, with
means of 38.2% and 33.3%, respectively; United States Department of Agriculture (2007) for nutmeg (36.3%),
and by Carvalhoet al. (2008) for chichá nut (27.7%).
This fat concentration is equivalent to those reported for cashew nut (47.7%) (TABELA..., 2006) and pistachio (44.4%) (UNITED STATES DEPARTMENT OF AGRICULTURE, 2007). However, it is much lower than those obtained for European walnut (57.0%), hazelnut (60.8%) and Brazil nut (63.5%-66.6%) (TABELA…, 2006; UNITED STATES DEPARTMENT OF AGRICULTURE, 2007), pecan nut (72.0%) and macadamia (75.5%-75.8%) (TABELA…, 2006; UNITED STATES DEPARTMENT OF AGRICULTURE, 2007). It is also much lower than the fat concentrations
obtained by Carvalho et al. (2008) and Souza et al.
(2008) for sapucaia nut (64.0% and 66.0% respectively). However, regarding the human consumption, lower fat concentration almonds are desirable and, in this case, the castanha-do-gurguéia is placed on an intermediate level, and its consumption is, in theory, healthier than Brazil nut and macadamia, for example. Moreover, with a mean fat concentration around 45%, the castanha-do-gurguéia has also a potential to be used as an alternative source of raw material for the biodiesel production.
The crude fiber concentration of the almond ranged from 3.44% to 5.72%, with a mean of 4.68%. It can be observed that over 50% of the genotypes showed mean concentrations of this nutrient higher than 4.7% (TAB. 6). On mean, the crude fiber concentration found
in this work is lower than that obtained by Carvalhoet
al. (2008) for the almond of the same species (6.1%);
Souza et al. (2008) for sapucaia nut (7.0%), and by
(TABELA.., 2006) for Brazil nut (7.9%). Nevertheless, it is higher than the mean concentration of 2.2%
obtained by Limaet al. (2007) for pequi almond.
As regards the ash concentration, it can be observed that there was a variation from 2.33% to 3.29%, being G-10 (3.08%) and G-23 (3.29%) the genotypes with the highest means, while the genotype G-11 had the lowest mean (TAB. 6). In general, comparing the ash mean concentration of the almonds (2.68%) found in this work, it can be seen that it is a little higher than
those obtained by Carvalho et al. (2008) also for the
castanha-do-gurguéia (2.5%); Lima et al. (2004) for
cashew nut (2.5%); (TABELA…, 2006) for peanut (2.2%) and European walnut (2.1%), and by the United States Department of Agriculture (2007) for hazelnut (2.3%) and nutmeg (2.3%), and it is much higher than the ash mean concentration for reported for macadamia (1.1%) and pecan nut (1.5%) (UNITED STATES DEPARTMENT OF AGRICULTURE, 2007). However, it is lower than
the ash mean concentrations reported by Carvalho et al.
(2008) for chichá nut (3.2%), and by Souzaet al. (2008)
and Carvalhoet al. (2008) for sapucaia nut (3.1 and 3.4%
respectively). Even so, the results found in this study indicate that the castanha-do-gurguéia is an important ash source as compared to other almonds.
Concerning the total carbohydrate concentration, there was variation from 28.68% (G-12) to 38.42% (G-5), with a mean of 34.28%. Fourteen from the 23 genotypes presented mean concentration of this nutrient equal to or higher than 34.33% and differed
from the other genotypes (TAB. 6). Carvalho et
al. (2008), working with mixtures of
castanha-do-gurguéia almonds, sapucaia nut and chichá nut, obtained, for the castanha-do-gurguéia, a mean value of total carbohydrate (36.2%) equivalent to the overall genotypes’s mean found in this work. Nevertheless, this author obtained a much higher mean concentration for chichá nut (45.1%) and a much lower value for sapucaia nut (11.1%). In (TABELA…, 2006), it is mentioned a mean concentration of 15.1% of carbohydrate for Brazil nut, which shows that the castanha-do-gurguéia is a reasonable source of this nutrient.
Fifteen of the 23 genotypes of castanheira-do-gurguéia studied presented mean energy concentrations equal to or
higher than 551.23 kcal 100 g-1, with values ranging from
522.56 to 572.07 kcal 100 g-1 and with mean of 552.68 kcal
100 g-1(TAB. 6). On mean the results obtained in this study
are lower than those achieved by Carvalho (2005) for almond
of the same species (578.5 kcal 100 g-1) and for sapucaia nut
(694.7 kcal 100 g-1). On the other hand, it is comparable to the
energy concentrations of other almond types, such as peanut
(544 kcal 100 g-1) (TABELA…, 2006) and licuri almond
(527.3 kcal 100 g-1) (CREPALDIet al., 2001), and higher than
that of chichá nut (499.2 kcal 100 g-1) (CARVALHO, 2005).
The P, K and Mg concentrations in the almond
ranged from 270.52 to 471.09 mg 100 g-1; from 705.61 to
1261.35 mg 100 g-1, and from 102.22 to 246.23 mg 100 g-1,
respectively. The genotypes G-23, G-2 and G-10 exhibited preponderance over the concentrations of P, while the genotypes G-15, G-23, G-13 and G-16 outperformed the others in the K concentration. The genotypes G-5, G-7 and G-8 exhibited the highest means for Mg (TAB. 7).
The mean concentrations for P (361.17 mg 100 g-1), K
(939.42 mg 100 g-1) and Mg (171.86 mg 100 g-1) obtained
in this study are higher than those reported for the baru
walnut (TAKEMOTOet al., 2001), macadamia (UNITED
STATES DEPARTMENT OF AGRICULTURE, 2007) and pecan nut (UNITED STATES DEPARTMENT OF AGRICULTURE, 2007). However, they are lower than
those reported by Souza et al. (2008) for sapucaia nut;
(TABELA…, 2006) for Brazil nut and by Morganoet al.
The results obtained in this work indicate that the castanha-do-gurguéia almond is very rich in K, especially
when compared to hazelnut (681.7-704.7 mg 100 g-1),
European walnut (291.9 mg 100 g-1), pecan nut
(433.4-554.4 mg 100 g-1), macadamia (228.1-422.6 mg 100 g-1)
(MORGANOet al., 2002), sapucaia nut (674.59 mg 100g-1)
(SOUZAet al., 2008) and pequi almond (452.07 mg 100g-1)
(OLIVEIRAet al., 2010). The genotype G-15 (1261.35 mg
100 g-1), specifically, seems greatly promising for using in
future genetic breeding programs, outperforming the mean concentrations reported for the majority of the almonds, as already cited.
Concerning the micronutrients concentration, there was also a significant variation among genotypes
(Cu: 0.29-2.20 mg 100 g-1; Mn: 2.30-41.17 mg 100 g-1;
Zn: 2.66-5.06 mg 100 g-1, and Fe 3.70-7.60 mg 100 g-1).
The genotypes G-7 and G-14 stood out for the Cu; the genotype G-22 stood out for the concentration of Mn, and the genotypes G-6, G-9, G-11 and G-13 had the highest means for the concentration of Fe. As for Zn, 12 of the 23 genotypes analyzed exhibited means higher than 3.98 mg
100 g-1(TAB. 7).
In general, the mean concentration of Cu (1.24
mg 100 g-1), Mn (9.47 mg 100 g-1), Zn (3.82 mg 100 g-1)
and Fe (4.92 mg 100 g-1) are lower than those obtained
by Carvalho (2005) for the almond of the same species
(1.9; 20.2; 6.6; and 7.8 mg 100 g-1, respectively). The
mean concentration of Zn was also lower than the mean
concentrations obtained for sapucaia nut (7.1 mg 100 g-1)
and chichá nut (12.7 mg 100 g-1) (CARVALHO, 2005),
and for baru walnut (4.1 mg 100 g-1) (TAKEMOTO et
al., 2001). Likewise, the mean Cu concentration was
lower than those obtained by Takemoto et al. (2001) and
by Veraet al. (2009) for baru walnut (1.45 mg 100 g-1and
1.67 mg 100 g-1 respectively), and by Souzaet al. (2008)
for sapucaia nut (3.04 mg 100 g-1). Whereas, the mean Mn
concentration is also lower than the mean concentration
obtained for sapucaia nut (18.1 mg 100 g-1) (CARVALHO,
2005). However, it is higher than the mean concentrations
reported by Veraet al. (2009) for baru walnut (5.72 mg
100 g-1); Carvalho (2005) for chichá nut (1.8 mg 100 g-1),
and by (TABELA…, 2006) for Brazil nut (1.10 mg 100
g-1). At last, the mean Fe concentration is still lower
than that reported by Veraet al. (2009) for baru walnut
(19.81 mg 100 g-1). Nevertheless, it was higher than
the mean concentration obtained by Takemoto et al.
(2001), also for baru walnut (4.24 mg 100 g-1).
Making a correlation between the results of the physical characteristics, especially AM, with those of the chemical-nutritional characteristics, it is observed that the genotypes G-3, G-13, G-23, G-10 and G-7 are important sources of genes for using in forthcoming genetic breeding programs of this species. The G-3 obtained the largest AM,
although it is not among the better performing genotypes in chemical-nutritional concentration and the others, by the more complete centesimal composition in mean terms.
Conclusions
1. In general, the genotypes of castanheira-do-gurguéia presented significant phenotypic variability for most of the physical and chemical-nutritional characteristics, indicating that this variability is important for using in future genetic breeding programs of the species; 2. The high phenotypic correlation estimate obtained
between fruit mass and almond mass indicates that it is possible to increase the almond size by the selection for larger fruit mass;
3. Genotypes with larger fruit length means do not result, necessarily, in larger smaller almond thickness means, as well as genotypes with larger smaller almond thickness do not result in larger longitudinal diameter of the pericarp cavity means;
4. The genotype G-3 is the most promising in terms of almond mass, almond length and larger almond thickness, and the genotypes 7, 10, 13 and G-23 are the most promising in the chemical-nutritional composition and, therefore, are important sources of genes that may be exploited in future breeding programs of the species.
Agradecimentos
À CAPES, pela bolsa concedida.
À Embrapa Meio-Norte e a Universidade Federal do Piauí - UFPI, pela possibilidade de realizar as análises físicas e químico-nutricionais.
Ao Dr. Valdomiro Aurélio Barbosa de Souza (in memoriam), pela orientação valiosa e pela iniciação no campo da pesquisa.
Ao Dr. Vidal de Freitas Mansano, pesquisador do Instituto de Pesquisas Jardim Botânico do Rio de Janeiro, pela identificação do material botânico.
References
CARVALHO, M. G. Barras de cereais com amêndoas de chichá, sapucaia e castanha-do-gurguéia, complementadas com casca de abacaxi. 2008. 92 f. Dissertação (Mestrado em Tecnologia de Alimentos) - Universidade Federal do Ceará, Ceará.
CARVALHO, M. G.et al. Avaliação dos parâmetros físicos e nutricionais de amêndoas de chichá, sapucaia e castanha-do-gurguéia.Revista Ciência Agronômica, v. 39, n. 04, p. 517-523, 2008.
CORRÊA, G. de C.et al. Determinações físicas em frutos e sementes de baru (Dipteryx alataVog.), cajuzinho (Anacardium othonianum Rizz.) e pequi (Caryocar brasilienseCamb.), visando melhoramento genético.Bioscience Journal, v. 24, n. 04, p. 42-47, 2008. CREPALDI, I. C. et al. Composição nutricional do fruto de licuri (Syagrus coronataMartius) Beccari). Revista Brasileira de Botânica, v. 24, n. 02, p.155-159, 2001.
DUCKE, A. As espécies brasileiras do gênero Coumarouna Aubl. ouDipteryxSchreb.Academia Brasileira de Ciências, v. 20, n. 01, p. 39-56, 1948.
INSTITUTO ADOLFO LUTZ (IAL). Métodos físico-químicos para análise de alimentos. 4. ed. São Paulo: IAL, 2005. 1015 p.
LIMA, A. C.; GARCIA, N. H. P.; LIMA, J. R. Obtenção e caracterização dos principais produtos do caju. Boletim do Centro de Pesquisa de Processamento de Alimentos, v. 22, n. 01, p. 133-144, 2004.
LIMA, A. de. et al. Composição química e compostos bioativos presentes na polpa e na amêndoa do pequi (Caryocar brasiliense Camb.).Revista Brasileira de Fruticultura, v. 29, n. 03, p. 695-698, 2007.
MORGANO, M. A.et al. Caracterização mineral de diferentes nozes. In: CONGRESSO BRASILEIRO DE CIÊNCIA E TECNOLOGIA DE ALIMENTOS, 18., 2002, Porto Alegre.
Anais...Porto Alegre: SBCTA, 2002. p. 3752-3755.
OLIVEIRA, M.E.B. deet al.Características químicas e físico-químicas de pequis da chapada do Araripe, Ceará. Revista Brasileira de Fruticultura, v. 32, n. 01, p. 114-125, 2010. ORO, T. et al. Evaluación de la calidad durante el almacenamiento de nueces Pecán [Carya illinoinensis (Wangenh.) C. Koch] acondicionadas en diferentes envases.
Grasas y Aceites, v. 59, n. 02, p. 132-138, 2008.
RATTER, J. A.; RIBEIRO, J. F. Biodiversity of the flora of the cerrado. In: SIMPÓSIO SOBRE O CERRADO, 8., Brasília.
Anais...Brasília: EMBRAPA-CPAC, 1996. p. 3-5.
SILVA, J. M. C. da.; BATES, J. M. Biogeographic patterns and conservation in the South American Cerrado: a tropical savanna hotspot.BioScience, v. 52, n. 03, p. 225-233, 2002.
SOUZA, V. A. B. et al. Características físicas de frutos e amêndoas e características químico-nutricionais de amêndoas de acessos de sapucaia.Revista Brasileira de Fruticultura, v. 30, n. 04, p. 946-952, 2008.
TABELA Brasileira de Composição de Alimentos. 2. ed. Campinas: NEPA-UNICAMP, 2006. 113 p.
TAKEMOTO, E. et al. Composição química da semente e do óleo de baru (Dipteryx alata Vog.) nativo do município de Pirenópolis, estado de Goiás. Revista do Instituto Adolfo Lutz, v. 60, n. 02, p. 113-117, 2001.
UNITED STATES DEPARTMENT OF AGRICULTURE (USDA). Agricultural Research Service. National Nutrient database for standard reference,Release 20, 2007. Disponível em: <http://www. ars.usda.gov/ba/bhnrc/ndl>. Acesso em: 20 jan. 2008.
VERA, R. et al. Características químicas de amêndoas de barueiros (Dipteryx alataVog.) de ocorrência natural no cerrado do estado de Goiás, Brasil.Revista Brasileira de Fruticultura, v. 31, n. 01, p. 112-118, 2009.