TCD
2, 341–382, 2008Changes of Wilkins Ice Shelf
M. Braun et al.
Title Page
Abstract Introduction
Conclusions References
Tables Figures
◭ ◮
◭ ◮
Back Close
Full Screen / Esc
Printer-friendly Version
Interactive Discussion
The Cryosphere Discuss., 2, 341–382, 2008 www.the-cryosphere-discuss.net/2/341/2008/ © Author(s) 2008. This work is distributed under the Creative Commons Attribution 3.0 License.
The Cryosphere Discussions
The Cryosphere Discussionsis the access reviewed discussion forum ofThe Cryosphere
Changes of Wilkins Ice Shelf over the past
15 years and inferences on its stability
M. Braun1, A. Humbert2, and A. Moll1
1
Center for Remote Sensing of Land Surfaces (ZFL), University of Bonn, Germany
2
Institute for Geophysics, University of Muenster, Germany
Received: 15 April 2008 – Accepted: 6 May 2008 – Published: 23 May 2008 Correspondence to: M. Braun ([email protected])
TCD
2, 341–382, 2008Changes of Wilkins Ice Shelf
M. Braun et al.
Title Page
Abstract Introduction
Conclusions References
Tables Figures
◭ ◮
◭ ◮
Back Close
Full Screen / Esc
Printer-friendly Version
Interactive Discussion Abstract
The Wilkins Ice Shelf is situated along the Antarctic Peninsula, a region where seven ice shelves disintegrated between 1995 and 2002. This study combines various remote sensing data sets over Wilkins Ice Shelf, with the aim to detect its present and near-past dynamics as well as recent changes. The survey includes structural mapping,
5
ERS-1/2 SAR interferometry and analysis of ICESat GLAS ice surface elevation data. Ice front retreat rates from 1986 to 2008 showed distinct break-up events, including a recent event in February 2008, where 40% of a bonding of the ice shelf to two islands broke off. Surface elevations have been used to study tidal effects, crack formation and to estimate the ice thickness over the floating area. The interferometric velocities cover
10
the south-eastern part of the ice shelf as well as major tributaries and reveal maximum inflow speeds of up to 330 ma−1. We show that drainage of melt ponds into crevasses were of no relevance for the break-up at Wilkins Ice Shelf. Buoyancy forces caused the rift formation before the break-up of February 2008. Additionally, the evolution of failure zones of the order of tenths of kilometres in length in pre-conditioned locations at ice
15
rises could be shown. Analysis of satellite image time series revealed that evolution and coalescence of failure zones coincides with major break-up events and is assumed to be triggered by them. Investigation of the current (April 2008) situation shows that about 38% at the northern Wilkins Ice Shelf is directly endangered, however, there is no visible signature that the remaining 8000 km2are at risk.
20
1 Introduction
On the Antarctic Peninsula, major climatological and glaciological changes have been observed in recent years. Glacier retreat along the west coast of the Antarctic Penin-sula has impressively been documented by Rau et al. (2003) and Cook et al. (2005). Pritchard and Vaughan (2007) recently also showed widespread acceleration of
tide-25
TCD
2, 341–382, 2008Changes of Wilkins Ice Shelf
M. Braun et al.
Title Page
Abstract Introduction
Conclusions References
Tables Figures
◭ ◮
◭ ◮
Back Close
Full Screen / Esc
Printer-friendly Version
Interactive Discussion
to a dynamic response to frontal thinning. Most spectacular was the break-up of vari-ous ice shelves in the region. In total 7 ice shelves have completely disintegrated: the Wordie Ice Shelf (Doake and Vaughan, 1991a; Vaughan and Doake, 1996), Mueller Ice Shelf (Ward, 1995) and Jones Ice Shelf (Fox and Vaughan, 2005) all located in Marguerite Bay and on the north-eastern Peninsula the Larsen Inlet (Skvarca, 1993),
5
the ice shelf in Prince Gustav Channel (Rott et al., 1996), the Larsen-A (Doake et al., 1998; Rott et al., 1998; Skvarca et al., 1999) and the Larsen-B Ice Shelf (Rott et al., 2002). Subsequent speed-up of inland ice masses after shelf ice break-up has been documented by remote sensing and field observations for most of these areas (de An-gelis and Skvarca, 2003; Rignot et al., 2004, 2005; Scambos et al., 2004). As a result
10
of this, the northern Antarctic Peninsula is now considered a contributor comparable to Alaskan glaciers to global sea level rise (Pritchard and Vaughan, 2007; Rignot and Thomas, 2002; Wingham et al., 2006; Shepherd and Wingham, 2007). Various au-thors report extraordinary warming rates on the Antarctic Peninsula of up to 3◦K since the 1950s (e.g. King, 1994; Harangozo et al., 1997; Comiso et al., 2000; Meredith and
15
King, 2005; Turner et al., 2005). King and Harangozo (1998) suggest that this is a result of an increase of northerly atmospheric circulation component over the Antarctic Peninsula. It coincides with findings by Turner et al. (1997) who report a 50% increase of the winter precipitation events compared to the 1950s. Recent estimates of the con-tribution of the Antarctic Peninsula glaciers to sea level rise by melt water indicate the
20
impact of two factors: warming rates as well as prolonged melting season (Vaughan, 2006; Morris and Mulvaney, 2004). Torinesi et al. (2003) computed positive trends of+0.5 days a−1 of mean melt duration from passive microwave satellite data (1980– 1999) over the Antarctic Peninsula. An updated time series (1987–2008) of Tedesco (2008) shows general negative trends in the same region.
25
TCD
2, 341–382, 2008Changes of Wilkins Ice Shelf
M. Braun et al.
Title Page
Abstract Introduction
Conclusions References
Tables Figures
◭ ◮
◭ ◮
Back Close
Full Screen / Esc
Printer-friendly Version
Interactive Discussion
and King, 2005). They attribute this to positive feedback mechanisms resulting from atmospheric warming and reduced rates of sea ice production in the western Antarctic Peninsula region. Concluding, we state that there are definite signs of extraordinary regional changes, which are, however, not yet giving a unique view on the processes.
Rising air temperatures and increased surface melting have frequently been
con-5
sidered as triggering parameters for ice shelf break-up and disintegration, although structural discontinuities and rheological criteria are also discussed (e.g. Glasser and Scambos, 2008; Vieli et al., 2007). The−9◦C annual isotherm is now being
consid-ered the limit for the existence of ice shelves (Morris and Vaughan, 2003; Vaughan et al., 2001), crossing the only two remaining large ice shelves on the western Antarctic
10
Peninsula: Wilkins and GeorgeVI ice shelves. If this postulation of the limit of viability of ice shelves is valid the Wilkins Ice Shelf (WIS) might be affected as already suggested by Doake and Vaughan (1991b). On the other hand Vaughan and Doake (1996) spec-ulated that WIS might first react with thickening due to increased accumulation.
In the classification scheme for ice shelves (Vaughan, 1998), WIS is associated to
15
Type G, which means that the dominant mass gain mechanism is surface accumula-tion, and the dominant mass loss mechanism is basal melting. Therefore, changes in ocean circulation and temperature represent another contribution to a possible insta-bility of the ice shelf. Furthermore, Type G ice shelves respond rapidly to changes in surface accumulation (Vaughan, 1998).
20
Vaughan et al. (1993) provided a first remote sensing based analysis of the WIS structure, where they conclude that it is expected to respond by normal calving. At that time there were no major changes in ice front positions detectable over the last 2 decades. In subsequent years Lucchita and Rosanova (1998) as well as Scambos et al. (2000) reported major break-up events.
25
TCD
2, 341–382, 2008Changes of Wilkins Ice Shelf
M. Braun et al.
Title Page
Abstract Introduction
Conclusions References
Tables Figures
◭ ◮
◭ ◮
Back Close
Full Screen / Esc
Printer-friendly Version
Interactive Discussion
ICESat tracks and particular emphasis is given to structures related to the previous and on-going break-up processes.
2 Previous knowledge on Wilkins Ice Shelf
WIS has a size of about 13 000 km2 and is confined by Alexander, Latady, Charcot and Rothschild Islands (Fig. 1). Very few in-situ measurements exist for WIS. Lewis
5
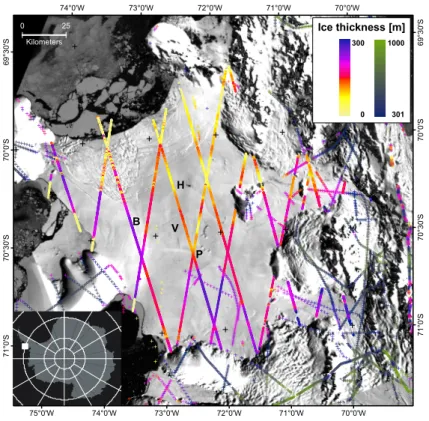
Snowfield is the dominating mass contributor of ice in the central part of the ice shelf. One of the largest tributary glaciers to WIS is Gilbert Glacier draining the northern part of Alexander Island. Ice from the Colbert Mountain Range drains into Schubert and Haydn Inlets. However, the outflow from these inlets into the central part is limited by numerous ice rises as visible in Fig. 2. The central part of the ice shelf is thus divided
10
into a thin northern part (50–150 m) and a thicker south-western part (170–270 m) that extends towards Latady and Charcot Islands (Fig. 3). This coincides with jumps of ice shelf elevation at the junction between the two inflowing ice masses in this area. In contrast, the inlet areas are considerably thicker: as much as 240 m in Haydn Inlet and 380 m in Schubert Inlet. A shallow hole, drilled in 1972, penetrated soaked snow
15
and found a water layer at 5.5 m (Swithinbank, 1988). Radio echo sounding data from the ice shelf (BEDMAP meta-database, Lythe, 2000) also indicate sea water (brine) infiltration, since in large parts of the ice shelf no return signal was captured. This can be understood from relatively large accumulation values: Peel (1982) has recorded 0.5±0.06 m a−1water equivalent (w.e.) for the central part of the ice shelf and Arthern
20
et al. (2006) determined accumulation rates of 0.37 to 0.54 m a−1 w.e. from satellite data. This leads together with a mean annual surface temperature above −9.0◦C to
a pore closure depth well below 100 m, allowing brine infiltration. Smith (1972) also reports that radio echo soundings (RES) records of ice thickness changed abruptly from 200 m to 50 m without a detectable change in surface elevation, which can only
25
be understood by sea-level brine infiltration.
experi-TCD
2, 341–382, 2008Changes of Wilkins Ice Shelf
M. Braun et al.
Title Page
Abstract Introduction
Conclusions References
Tables Figures
◭ ◮
◭ ◮
Back Close
Full Screen / Esc
Printer-friendly Version
Interactive Discussion
enced a positive trend in melt days of 1.05±0.95 days a−1(1977–1991), which
corre-sponds roughly to about 90 days per year (1991). This is the highest amount of all ice shelves on the Antarctic Peninsula. An updated time series (1987–2008) presented by Tedesco (2008) revealed a negative trend of around−0.4 days a−1.
Ice shelves like WIS are dominated by surface accumulation and basal melting (no
5
quantification exists so far) happen to have small horizontal velocities, which also holds true for the WIS as will be shown below. A single point measurement from the early 1970s (Vaughan et al., 1993) revealed a surface velocity of 59 m a−1in the central part of the ice shelf (see J8 in Fig. 1). In the same study, speeds from satellite feature tracking at few locations uncovered velocities from 30–90 m a−1.
10
Vaughan et al. (1993) performed a comprehensive remote sensing analysis includ-ing structural mappinclud-ing, ice dynamics, ice thickness’s and GEOSAT surface elevations. GEOSAT ice surface elevations were also investigated by Mantripp et al. (1992) and corrections to these elevationswere performed by Cooper and Hinton (1996), mention-ing that the most errors were introduced by topographic features and former published
15
slopes might be incorrect up to 18%, leading to overestimation of the width of features, particularly ridges in the ice.
In another remote sensing study, Lucchita and Rosanova (1998) inspected ice front changes. They report that no significant ice front changes had occurred prior to 1992. Scambos et al. (2003) detected a catastrophic-style break-up event in March 1998
20
leading to an area loss of about 1100 km2.
3 Survey
In order to improve the understanding of the dynamics and recent changes of WIS, elementary baseline data sets such as topography and ice thickness, the location of grounded areas, changes of frontal positions, structures including rifts, shear margins,
25
TCD
2, 341–382, 2008Changes of Wilkins Ice Shelf
M. Braun et al.
Title Page
Abstract Introduction
Conclusions References
Tables Figures
◭ ◮
◭ ◮
Back Close
Full Screen / Esc
Printer-friendly Version
Interactive Discussion
3.1 Image database
Over the last 22 years, a comprehensive collection of satellite images was compiled comprising multi-spectral imagery from Landsat TM and Terra ASTER sensors as well as cloud and illumination independent SAR imagery from the European Remote Sens-ing Satellites (ERS-1/2) and European Environmental Satellite (ENVISAT) missions,
5
operated by the European Space Agency (ESA).
The Landsat data set consists of the two scenes each acquired on 18 February 1986 (path 220, rows 109 and 110) and 27 January 1990 (path 221, rows 109 and 110). These data sets provided via the Geographic Information System Antarctica (Sievers and Bennat, 1989) were also used as spatial reference for all subsequent
10
rectifications. Various, nearly cloud-free stripes of the Terra ASTER sensor covering a period between 2001 and 2006 were assembled into a mosaic. For specific areas, complementary ASTER imagery from 2006, January 2008 and 28 February 2008 was georeferenced. The multi-spectral database was completed by a respective Landsat Image Mosaic of Antarctica (http://lima.usgs.gov) from the late 1990s beginning 2000
15
and concurrent MODIS imagery from 2002 to date from the online archive provided by National Snow and Ice Data Center (http://nsidc.org/data/).
A time series of high-resolution ERS-1/2 and ENVISAT SAR SLC imagery covering the northern ice front was compiled. Since 1991, at least one image per year was processed in order to map changes in ice front position. The time series was completed
20
with ENVISAT data during 2007 with particular emphasis on the connection between Latady and Charcot Island. For the monitoring of the break-up event in February 2008 a time series of ENVISAT Wide Swath Mode imagery (150 m spatial resolution) was acquired via the ESA ENVISAT Web File Server. Furthermore ALOS PALSAR fine beam imagery from July and November 2007 was processed in order to use the deeper
25
TCD
2, 341–382, 2008Changes of Wilkins Ice Shelf
M. Braun et al.
Title Page
Abstract Introduction
Conclusions References
Tables Figures
◭ ◮
◭ ◮
Back Close
Full Screen / Esc
Printer-friendly Version
Interactive Discussion
3.2 Interferometric velocities
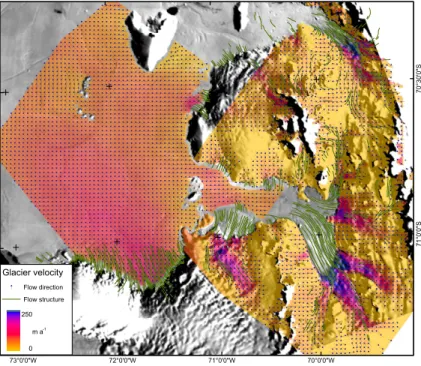
For the main tributary glaciers from Alexander Island and the Lewis Snowfield a surface velocity field (Fig. 2) was computed by differential SAR interferometry (DInSAR). ERS-1/2 tandem data from 23/24 and 28/29 October 1995 were combined for the analysis. The precision of the product is in the range of about 10 m a−1. The precision was
5
determined in rocky areas where the global solution of the phase unwrapping process should lead to zero velocities. The resulting flow field depicts the main tributaries and flow structure very well. The flow directions computed by DInSAR coincide well with the flow structures mapped from LANDSAT imagery. Highest velocities are recorded at the southern inflows to Schubert and Haydn Inlet with more than 300 m a−1
. The RES
10
data shows thickness values of more than 500 m for these areas (Fig. 3).
For WIS a 2-D surface velocity field (Fig. 2) has been computed by SAR interfer-ometry by combining ascending (8/11 March 1994) and descending (3/4 March 1996) viewing directions. Since no concurrent velocity measurements exist the only avail-able in-situ velocity (J8, 59 m a−1) from 1972 (Vaughan et al., 1993) had to be used
15
for phase-velocity conversion. Although this limits the precision of the absolute magni-tude of the velocities for the data set the resulting flow vectors are in good agreement with the flow lines mapped from Landsat imagery. On the ice shelf near Haendel Ice Piedmont, manual feature tracking using optical imagery from 1986, 1990 and 2001 revealed no significant changes in velocities. Compared to other ice shelves the WIS
20
is, as expected from its mass gain and loss mechanisms, an ice shelf with low ice velocities. The general pattern shows highest inflow from Lewis Snowfield with up to 180 m a−1and in the central part of the ice shelf velocities in the range of 50–100 m a−1. This in good agreement with the speeds found by Vaughan et al. (1993), which reports overall speeds of 30–90 m a−1that were detected through manual feature tracking. The
25
TCD
2, 341–382, 2008Changes of Wilkins Ice Shelf
M. Braun et al.
Title Page
Abstract Introduction
Conclusions References
Tables Figures
◭ ◮
◭ ◮
Back Close
Full Screen / Esc
Printer-friendly Version
Interactive Discussion
the interpretation that the ice rises restrict mass flow towards the ice shelf. Consider-ing the mass gain from the thick and fast tributary glaciers to Schubert Inlet it has to be assumed that main mass loss in the inlet areas occurs by basal melting. Figure 4 also reveals that there is almost no outflow from Haydn Inlet into the central part of the ice shelf. Furthermore, the velocity field depicts very well small-scale variations on the
5
ice shelf as can be seen from the perturbations induced by the small ice rises (e.g. downstream of Petrie Ice Rises, Fig. 3).
3.3 Topography
ICESat (Ice, Cloud, and Land Elevation Satellite) GLAS (Geoscience Laser Altimeter System) ice surface elevation data (applied satellite and geophysical corrections, no
10
tidal corrections) from the operation periods 2A, 2B, 3A, 3B, 3D, 3E, 3F, 3G and 3H (26 September to 18 November 2003, 25 February to 21 March 2004, 6 October to 5 November 2004, 21 February to 23 March 2005, 24 October to 23 November 2005, 24 February to 27 March 2006, 24 May to 26 June 2006, 2 to 21 November 2006, 12 March to 14 April 2007, respectively) were used to study ice shelf surface elevation changes.
15
Elevations are transformed from the Topex/Poseidon ellipsoid to the OSU91A geoid, so that the given elevations are freeboard heights. In order to eliminate differences in the track positions at the various operation times of the ICESat GLAS instrument in our analysis along track, we define a box around the ice shelf area and calculate the intersection between the track (assumed to be linear) and the right margin of the box.
20
This gives one “base” point per track per operation period, from which distances are calculated.
In order to estimate the vertical motion between the operation periods, the surface elevation data has been sorted into bins of 200 m width along the track. The binsize has been chosen to be slightly larger than the mean distance between data points,
25
TCD
2, 341–382, 2008Changes of Wilkins Ice Shelf
M. Braun et al.
Title Page
Abstract Introduction
Conclusions References
Tables Figures
◭ ◮
◭ ◮
Back Close
Full Screen / Esc
Printer-friendly Version
Interactive Discussion
values are averaged.
Since no tidal measurements were ever performed on the WIS, differences between the ICESat GLAS surface elevations at different operation periods open for the first time the opportunity to determine the range of tidal displacement of the WIS. Histograms of the difference in elevation of all tracks reveal a maximum tidal range of 1.2 m. As we do
5
not know if the data acquisitions took place during any high and/or low tides this value may only represent the lower limit of the tidal range.
3.4 Ice thickness
In order to compare ice thicknesses measured in radio echo soundings with an ice thickness computed from the surface elevation, we have to assume a mean density.
10
Doake (1984) determined the mean ice density in areas of surface melt on GeorgeVI Ice Shelf and found it to be 915 kg m−3(contrasting to 884 kg m−3in areas without sur-face melt). Zotikov and others (1980) found the density of marine ice to be 927 kg m−3. We assume that even in the case of brine infiltration the effect of salinity is rather small and thus we assume a mean ice density across the ice shelf of 915 kg m−3. In
hydro-15
static equilibrium the ice thicknessH is derived from the surface elevationhfrom
H = ρsw
ρsw−ρice ·h (1)
whereρsw denotes the density of sea water (1027 kg m−3) andρice the mean density of ice.
Figure 4 displays the radio echo sounding ice thickness data obtained in 1966/67,
20
1969/70, 1971/72 and 1974/75 by the British Antarctic Survey. References to the field campaigns can be found in the BEDMAP database and Lythe et al. (2000).
In general, the ice thickness computed from freeboard heights under the assump-tions made above agree well with ice thickness measured in the RES campaigns from 1969 to 1975. This statement rises and falls of course with the assumption made
TCD
2, 341–382, 2008Changes of Wilkins Ice Shelf
M. Braun et al.
Title Page
Abstract Introduction
Conclusions References
Tables Figures
◭ ◮
◭ ◮
Back Close
Full Screen / Esc
Printer-friendly Version
Interactive Discussion
about the ice densities, so that no differences on the order of a few meters could be determined based on these estimations.
3.5 Structural mapping
3.5.1 Ice front position
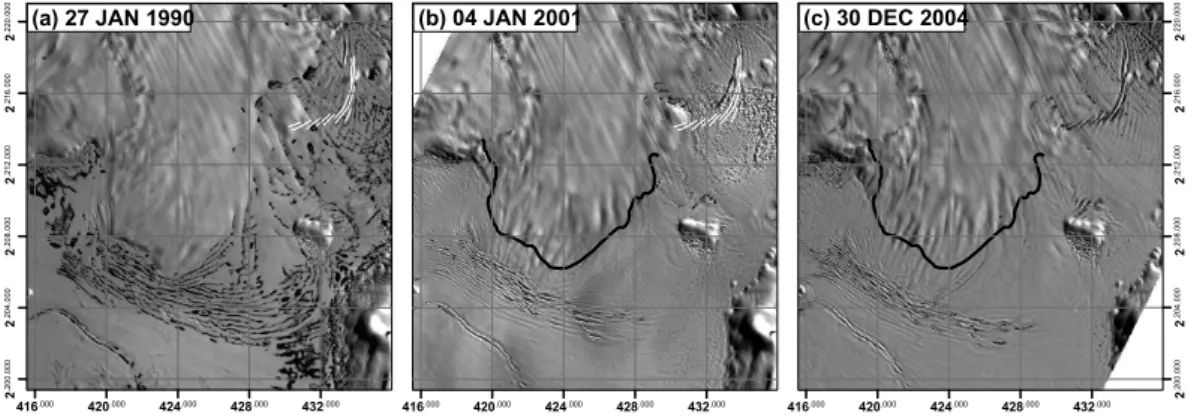
WIS has experienced mass loss in discontinuous calving/break-up events separated
5
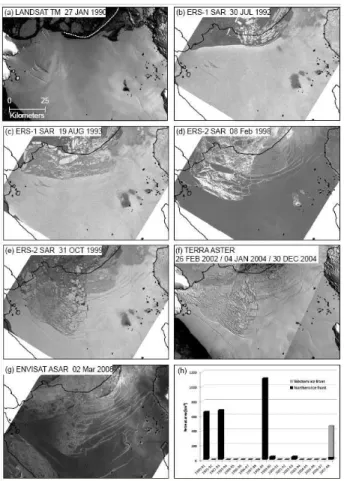
by stable years. For the period 1990 to present more than 30 images have been used to detect the ice front positions. Figure 4 displays the ice front positions from selected years. From this continuous record we address only time-spans when signif-icant area change was observed. The northern ice front lost 655 km2 between 1990
and 1991. Deducting this from the value of 796 km2 (1974 to 1992) given by
Luc-10
chitta and Rosanova (1998) an area loss of 140 km2 has occurred between 1974 and 1990. In 1993, another break-up event took place, separating 680 km2. This result is in reasonable agreement with the 564 km2 found by Lucchitta and Rosanova (1998). The largest observed calving event (1112 km2) started in beginning of February 1998 and the changes are quite visible in Fig. 4c–e showing imagery before during and
af-15
ter the event. The area compares well to the loss of 1098 km2 given by Scambos et al. (2000) for March 1998. Further minor calving of 88 km2 (October 1999–February
2001), 49 km2 (November 2002–January 2003) and 38 km2 (February 2008–March
2008) could be observed at the northern ice front. Between January 1990 and Febru-ary 2008 the western ice front between Charcot and Latady Island lost 288 km2(Fig. 4).
20
Major iceberg calving between October 1999 and 2002 can be observed from a com-parison of ASTER and various ERS-2 SAR imagery. However, due to lack of complete coverage of the entire ice front no quantification has been possible so far. Changes on the south-western ice front between Latady Island and Lewis Snowfield amount to 196 km2 between 1990 and 2004. WIS is hence an ice shelf that experiences no
con-25
TCD
2, 341–382, 2008Changes of Wilkins Ice Shelf
M. Braun et al.
Title Page
Abstract Introduction
Conclusions References
Tables Figures
◭ ◮
◭ ◮
Back Close
Full Screen / Esc
Printer-friendly Version
Interactive Discussion
Lucchita and Rosanova (1998) discussed the possibility of a retreat due to minimal extent of sea ice along the northern ice front. MODIS images from 2002 to 2007 showed that the area covered with likely multi-year sea ice, or fast ice, remains the same. However, beyond the fast ice edge, the sound is found to be free of sea ice in some of the years.
5
From here on, the total area of the ice shelf is assumed to same following the Febru-ary 2008 break-up event, which is about 13 000 km2(excluding ice rises and islands). The later break-up event (425 km2 until 24 March 2008) is discussed by Braun and Humbert (2008)1and will also be taken up in Sect. 4.2.
3.5.2 Particularities of WIS
10
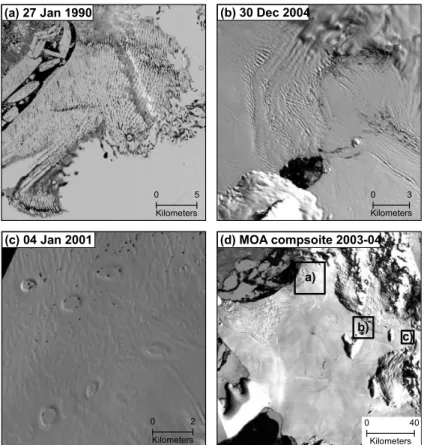
We illustrate the most peculiar areas we found in visible imagery in Fig. 5. The subset in Fig. 5a shows a zone of intense surface melting at the northern ice front. This area is covered by melt ponds that are interconnected. The size of the area was about 395 km2 (1990). The structure of these features indicates that dust blown-out by predominant northerly winds from the rocks of Rothschild Island may alter surface albedo and hence
15
lead to this persistent pattern. Another area with intensive surface melt features exists on Haydn Inlet and the tributary glaciers from Alexander Island show similar patterns as it is also reported from George VI Ice Shelf (Smith et al., 2007).
We also detected zones with a high density of dolines, shown in Fig. 5b. Dolines are round, hollowed depressions with horizontal dimensions in the order of a few hundred
20
meters. Bindschadler et al. (2002) found the dolines on the Larsen Ice Shelf to occur almost only in floating areas and solely in combination with melt ponds. In contrast to them, we could find a field of dolines outside a melt area. However, the two most promi-nent areas with melt pools are doline-studded as well. For the years 2004–2006 we found 122 dolines with widths ranging from 207 to 2188 m, with most of them between
25
1
TCD
2, 341–382, 2008Changes of Wilkins Ice Shelf
M. Braun et al.
Title Page
Abstract Introduction
Conclusions References
Tables Figures
◭ ◮
◭ ◮
Back Close
Full Screen / Esc
Printer-friendly Version
Interactive Discussion
200 and 800 m width. From the Landsat image from 1990 we could detect 107 dolines with widths varying from 186 to 1445 m and again most of them have a width of 200 to 800 m.
Figure 5c displays an area of 15 km2 open water between Dorsey Island and the adjacent coast of Mozart Ice Piedmont. Open ocean in this form is only rarely found on
5
ice shelves, and only where massive, fast flowing ice streams enter the ice shelf. Here, the presence of a large ice rise acts to support the formation of open water.
We detected a plastic zone that is likely formed by an ice rumple. The Burgess Ice Rise (area of 0.073 km2, see Fig. 1, 6a, denoted as B), although named ice rise, is presumably an ice rumple as visible imagery reveals. Ice rumples differ from ice
10
rises as the ice flows across them and the strain energy is relieved predominantly by recrystallisation. Recrystallisation leads to the formation of a downstream plastic zone, which we found not to be intersected by rifts and thus we conclude that it is not a failure zone that weakens the ice shelf. The zone is, however crossed by kinks formed by ice front deflection. These kinks are detectable in visible and SAR imagery (see arrows in
15
Fig. 6a) and the analysis of ICESat surface elevation data revealed an elevation change of only 0.5 m in these kinks.
The location of the downstream plastic zone is coincident with the eastern margin of the triangular-shaped area that broke offin the 1998 event. Thus, the plastic zone stopped further break-up and stabilized the ice front. The prolongation of this zone
20
downstream of B is indicated by black lines in Fig. 6a.
Two types of fracturing exist in ice shelves: mode 1 cracks, where the crack surfaces move apart. This crack mode originates from tensile stress and if often evident on ice shelves that exhibit crevasses parallel to the ice front. Contrastingly, mode 2 cracks are formed from shear stress and lead to crack surfaces sliding past each other
(shear-25
TCD
2, 341–382, 2008Changes of Wilkins Ice Shelf
M. Braun et al.
Title Page
Abstract Introduction
Conclusions References
Tables Figures
◭ ◮
◭ ◮
Back Close
Full Screen / Esc
Printer-friendly Version
Interactive Discussion
Figure 6b displays an ENVISAT ASAR image from 5 August 2007 of the eastern part of the northern ice front, where a glacier is draining from the Mozart Ice Piedmont into the ice shelf. Shear rifts mapped in the Landsat image from 1990 are displayed in blue colour. Those rifts moved with the ice flow downstream and experienced tensile stress, which is verified by their new shape in form of a wing crack.
5
Furthermore, the 1990 image shows short rifts originating from tensile stress act-ing on the ice front, which are shown as green lines. Those rifts are prolonged by subsequent break-up events.
The upper part of Fig. 6b shows a dark zone with melt-ponds (see also Fig. 5a). Rift propagation is hindered there by a region of high compressive stress in the vicinity
10
of Rothschild Island. Since regions of high compressive stress are known to contain crack propagation (Gross and Seelig, 2006), we suggest that this is the reason for the persistence of this area against fracturing.
WIS exhibits in the centre a dark area, which was formerly identified by Lucchita and Rosanova (1998) as a melt pool (see Fig. 1, “H”). They also report that the size has not
15
changed between the 1990 Landsat and the 1992 ERS image. Swithinbank (1988) saw this feature present already in a Landsat image from 1979. ASTER images disclose that this is not a melt-pond, but cracks that cut vertically through the entire ice shelf. The crack faces, that are moving slightly apart, are causing this small area of open ocean. The open water is surrounded by ice with lower SAR backscatter (in either L- or
20
C-Band), which we attribute to different material properties to the surrounding frozen firn, possibly caused by presence of liquid water or bare ice. The size of the open water surface is 3820 m2, in a total area of surface melt of 41 km2. In Fig. 6c we show an ALOS PALSAR image of this area superimposed on the Landsat scene from 27 January 1990.
25
TCD
2, 341–382, 2008Changes of Wilkins Ice Shelf
M. Braun et al.
Title Page
Abstract Introduction
Conclusions References
Tables Figures
◭ ◮
◭ ◮
Back Close
Full Screen / Esc
Printer-friendly Version
Interactive Discussion
(see Fig. 1), the right one to the inflow from Gilbert Glacier. The two dark elongated shades demarcate shear margins (mode2 cracks). The formation of open water is caused by two shear margins joining at a location of a set of small ice rises. The already damaged ice structure, easily allows the formation of a through-crack.
Crack propagation toward the ice front is further promoted by previously formed rifts
5
at ice rises. The crack is now meandering along the large rifts east of the open water. Those rifts were formed by break-up events at the ice front, not by ordinary flow divide around ice rises. In the 1990 image, i.e. before the first recorded break-up event, those rifts were only the width of the ice rises, which is the reason, why the size of the open water area remained constant and the crack did not propagate fast towards the ice
10
front. Since we know that the crack is going through the entire ice shelf depth at its origin, we expect that this holds true for the tail of the crack as well. In connection with the February 2008 break-up event, the rift west of the open water (white dotted line in Fig. 6c) connected with a rift on the stripe between Charcot and Latady Islands (white line in Fig. 6a). Thus, there is now a continuous rift connection from Charcot Island to
15
the open water area, leaving a large part of the northern ice shelf at risk.
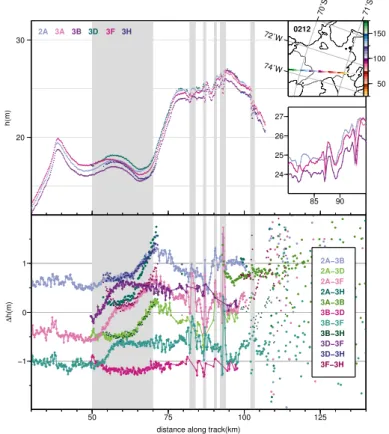
3.5.3 Variability along a horizontal profile
We have chosen laser track 0212 for a detailed study, since this track exemplifies a variety of conditions. The track crosses a region of compressive stress at the margin of Latady Island and a zone of considerable ice thickness contrasts (feature “F” in
20
Vaughan et al., 1993).
The upper panel of Fig. 7 displays the surface elevations along the track for several GLAS operation periods. The position of the track can be seen in the upper inset. The lower panel shows the differences in surface elevations for various laser operation periods, as they resulted from binning. As can be seen in the upper panel of Fig. 7, the
25
TCD
2, 341–382, 2008Changes of Wilkins Ice Shelf
M. Braun et al.
Title Page
Abstract Introduction
Conclusions References
Tables Figures
◭ ◮
◭ ◮
Back Close
Full Screen / Esc
Printer-friendly Version
Interactive Discussion
which results from upfolding of ice towards Latady Island.
The grey shaded area between 50 to 70 km distance along track depicts an area where the ice shelf is not floating freely, since the differences in elevations are not a pure tidal movement.
To the north of this zone, we could observe formation a depression and deepening
5
of rifts along this track on five distinct locations, which are all marked in grey in Fig. 7 (small stripes). The rift deepening was determined relative to the mean difference surface elevations for three laser operation periods 2A (5 November 2003), 3B (10 March 2005) and 3F (12 June 2006).
The first observed deepening in the region is at a distance of 82–83 km along the
10
track. There, a rather wide structure than a sharp rift, developed. The surface eleva-tion showed in November 2003 and March 2005 a small hill, which is transferred to a depression in June 2006. The difference is about 0.7 m.
A rift originating at Vere Ice Rise (Fig. 1, denoted as V) is extending into the track location at a distance of 87 km along the track. In radar and visible imagery the rift is
15
yet not detectable with the available spatial resolution or because it is tapped. Here, the laser altimeter is the only remote sensing tool to detect surface structures. The rift is deepening there 0.5 m between November 2003 and March 2005 and another 0.6 m in the period from March 2005 to June 2006.
At a distance of 90 km along track a surface difference of about 0.4 m between
20
November 2003 and March 2005 could be detected. There, the track is parallel to the wavy surface structure and since there is not a concise rift shape in the elevation profile, we assume that either a flow unit moved into the track.
The grey stripe at 93 km distance along track could be assigned to the tail of the older rift on the connection between Latady and Charcot Island. This rift is deepening
25
there about 0.6 m from November 2003 to March 2005 and 1.6 m from March 2005 to June 2006.
TCD
2, 341–382, 2008Changes of Wilkins Ice Shelf
M. Braun et al.
Title Page
Abstract Introduction
Conclusions References
Tables Figures
◭ ◮
◭ ◮
Back Close
Full Screen / Esc
Printer-friendly Version
Interactive Discussion
Latady Island, moving northwards. We infer that this is not a rift formation or deepening, but a normal movement of the flow unit into the trace of the track.
Since one cannot convert the differences at singular observation times to annual rates, we will not discuss trends in rift deepening here. All rift deepenings discussed above were not related to a major break-up event and are thus a sign of a continuous
5
process on quasi-static timescales.
Bassis et al. (2008) investigated the rift propagation on a prominent rift on Amery Ice Shelf. They found, that the rift propagation neither depended on wind, nor on tides and not even on a tsunami and that the rift propagation is instead driven by internal glaciological stress. This is in good agreement with our findings for continuous rift
10
deepening.
3.5.4 Advance of Gilbert Glacier
Gilbert Glacier is one of the most prominent tributaries of WIS. It drains the northern mountain ranges of Alexander Island towards the south (Fig. 1). Near WIS, the glacier is split by a bedrock outcrop into two tongues, one ending in Haydn Inlet, one ending
15
north of the open water area described in Sect. 3.5.2 and Fig. 5. The southern terminus position of Gilbert Glacier is well marked by shading effects and a pattern of pressure ridges emphasised by intersected melt water ponds (Fig. 8a). As can be see in the subsequent time steps of this figure, the pressure ridges have been considerably relo-cated by an advance of the Gilbert Glacier tongue into Haydn Inlet. Between 1990 and
20
2001, the main tongue advanced by about 1.3 km and until 2004 the advance amounts to almost 2 km, indicating an acceleration of this process. Interestingly, a closer ana-lysis reveals that particularly the southern tongue advanced and that the pronounced shear margin of the northern tongue is relocated northwest by approximately 1.9 km due to the massive inflow. The pronounced bend of this shear margin is changed and
25
TCD
2, 341–382, 2008Changes of Wilkins Ice Shelf
M. Braun et al.
Title Page
Abstract Introduction
Conclusions References
Tables Figures
◭ ◮
◭ ◮
Back Close
Full Screen / Esc
Printer-friendly Version
Interactive Discussion
the advance.
4 Discussion
4.1 Evolution of failure zones
In general, nuclei for the evolution of failure zones are ice rises and shear margins. The latter is under-represented on the WIS and will thus not be discussed further in
5
the following.
Ice rises are small areas where the floating ice shelf is grounded. Depending on their size, they have typically a dome-like surface topography. They divide the ice flow and thus they induce general lower ice flow speeds. The WIS has an extremely large number of ice rises: namely 172, most of them are small, with a width<2 km. Upstream
10
of ice rises the ice is piled up and the surface is upfolded. Visible imagery of the lee-side discloses that the ice shelf is more crevassed, for some ice rises even filled with a melange of ice. Double-differenced interferograms (not shown here) demonstrate that the grounding line of the ice rise at this location has either no fringe belt at all or a very narrow fringe belt and thus indicating that no hinge zone is developed.
15
Ice rises were for a long time supposed to stabilize ice shelves, as they act as pinning points (e.g. Hughes, 1983) when they are located at the ice front. Modelling studies of the Ross Ice Shelf have shown that the ice rises are able to form flow units and, depending on their distance to the grounding line decouple flow and form inactive flow zones (Humbert et al., 2005). Modelling studies of the Brunt Ice Shelf revealed a strong
20
effect of a cluster of small ice rises (McDonald Ice Rumples) at the ice front on the ice flow direction of the whole ice shelf (Humbert and Pritchard, 2006) and furthermore, they are known to control the evolution of the ice front (Simmons, 1986).
Ice rises are, on the other hand, also a well known feature for formation of failure zones, like the rifts formed when the ice flow divides around them. In these areas,
25
TCD
2, 341–382, 2008Changes of Wilkins Ice Shelf
M. Braun et al.
Title Page
Abstract Introduction
Conclusions References
Tables Figures
◭ ◮
◭ ◮
Back Close
Full Screen / Esc
Printer-friendly Version
Interactive Discussion
the rifts is normally in the order of the size of the ice rise itself. In the 1990 Landsat image, most of the ice rises were accompanied by such small rifts.
As ice shelves spread out towards the ice front the stress regime is in most parts a tensile stress regime rather than a bending stress regime. Thus, the previously formed rifts in the vicinity of ice rises, which are supposed never to heal completely,
5
experience the tensile stress and ordinary calving occurs. This happens on time quasi-static periods, which is of the order of the surrounding flow speed and thus meters per year.
Contrastingly, we also observed drastic rift extension in coherence with break-up events. The February 2008 break-up event revealed that the time scale on which this
10
evolution of failure zones is happening is not quasi-static, but on the order of hours, and thus redistribution of load and load alteration is not the cause. We can thus infer, that since the process occurs on dynamic time scales, wave propagation caused by the break-up itself is the cause for the abrupt evolution of failure zones.
This fast evolution of failure zones is a second component that adds to the slow
15
component described in Sect. 3.5.3.
Hence, ice rises are, in the absence of a compressive stress zone that hinders rift propagation, a destabilising factor. WIS is however not representative for ice shelves in general, since an absolutely unusual large number of ice rises exist there. Thus, our findings do apply to ice shelves with similar conditions only. One example was to
20
be found in the eastern Pine Island Bay (Uenzelmann-Neben et al., 2007), where ice retreat since the Last Glacial Maximum uncovered a highly uneven sea-floor with many small islands. This area of high ice rise density has disintegrated completely.
4.2 Stabilizing connection to confining islands
In Fig. 9 we focus on a sensitive area that connects the central ice shelf to the Charcot
25
TCD
2, 341–382, 2008Changes of Wilkins Ice Shelf
M. Braun et al.
Title Page
Abstract Introduction
Conclusions References
Tables Figures
◭ ◮
◭ ◮
Back Close
Full Screen / Esc
Printer-friendly Version
Interactive Discussion
more than 20 km wide before the first rifts appear. The major break-up event in 1998 reduced the connection considerably and a major rift formed at an ice rise in front of Charcot Island. Moreover, the western ice front was also subject to calving leaving a rifted connection of about 18 km width. Two ICESat GLAS tracks are superimposed in panel (b) and the respective elevation profiles are shown in Fig. 9d. The depth of the
5
rifts is clearly captured by the laser altimeter. The grey bars mark the position where a new rift formed in 2007, depicted very well in the ALOS PALSAR image (Fig. 9c). The small subset highlights the sensitive connection to Charcot Island where numerous small rifts have formed. This stripe-shaped connection is formed by 200 to 250 m thick ice as can be seen in Fig. 3. In RES surveys, this area did not have return
10
signals, which indicates that there is brine infiltration across the whole ice connection. A discussion about the buoyancy forces that lead to the rift formation is given by Braun and Humbert (2008)1, thus we only briefly discuss this issue here. The rift propagation occurs with Raleigh wave speed and hence took place in a time scale of minutes.
The recent break-up event starting on 28 February 2008 is shown in Fig. 9e. Several
15
blocks broke out at the ice shelf front near, but not directly at Charcot Island. The ASTER subset shows that additional longitudinal rifts have formed. Until 29 February, almost the entire ice towards the rift from 2007 was lost, and until 7 March an area of about 425 km2broke offleaving only a very narrow connection of about 6km width to Charcot Island. This connection is rifted by the 1998 event and also exhibits already
20
small rifts where it is tied to the ice rise in front of Charcot Island.
The uncalibrated thermal MODIS image from 28 July 2007 (available athttp://nsidc. org/data/iceshelves images/wilkins.html) shows significant temperature differences be-tween the rifts (formed in 1998) and the undamaged surrounding ice. This can only be understood when warm ocean water fills the rift up to sea level. We can exclude heat
25
TCD
2, 341–382, 2008Changes of Wilkins Ice Shelf
M. Braun et al.
Title Page
Abstract Introduction
Conclusions References
Tables Figures
◭ ◮
◭ ◮
Back Close
Full Screen / Esc
Printer-friendly Version
Interactive Discussion
accomplish a connection to the ocean. Intruding sea water has a higher temperature than the surrounding ice and will heat up the bulk ice mass at the sides of the rifts, and hence further weaken the mechanical strength of the ice.
It is remarkable that the 1998 break-up event also started at the stripe between Charcot and Latady Islands. The ice was there in the 1980s was comparably thick
5
(GEOSAT data, Vaughan et al., 1993). There, inflow from Charcot Island caused shear-mode cracks. Those cracks existed by 1990, but the situation remained nevertheless stable for several years. We speculate that basal melting has thinned the boundaries and thereby emerging bending stresses from buoyancy forces were also the cause for the 1998 break-up.
10
4.3 Changes of WIS in the past 15 years and its conceivable reasons
Since 1990, WIS has undergone disturbing changes. In 1990 the central area did not have any alarming rifts. The only detectable weak zone was the open water area (H in Fig. 1). In 1993/94, rift formation started to advance at the northern ice front. Today, the central area is intersected with rifts in the order of tenths of kilometres in length,
15
which have already coalesced.
The sections above showed that we have identified nuclei for failure zones like ice rises and shear zones and additionally rift formation by buoyancy forces. We conclude that the evolution of failure zones is connected with break-up events and the break-up events themselves are connected to the pre-conditioning by failure zones. Thus, we
20
infer that the WIS has experienced a sequence cascade of failures, which is continuing to progress.
We aim to assess all considerable causes for the changes and exclude first those which to current knowledge did not contribute:
– The inflow from inlets was always inhibited by ice rises that block the outflow into
25
TCD
2, 341–382, 2008Changes of Wilkins Ice Shelf
M. Braun et al.
Title Page
Abstract Introduction
Conclusions References
Tables Figures
◭ ◮
◭ ◮
Back Close
Full Screen / Esc
Printer-friendly Version
Interactive Discussion – There is so far no evidence for a considerable change in surface accumulation
pattern or magnitude.
– Changes in inflow: although we found in Sect. 3.5.4 an area where changes in glacier inflow are significant, their effect on the central ice shelf is insignificant, because it affects one inlet and we discussed above that the inlets are play only
5
a minor role in the dynamics of the central ice shelf. Manual feature tracking revealed that the interferometric flow field of the central ice shelf seems to remain valid. Hence, we infer, that changes in the inflow are unlikely the explanation for today’s situation of WIS.
– Although we know that the number of degree days has increased, we see that
10
the area of melt ponds remained the same since 1986. Melt ponds aroused sus-picion to cause ice shelf disintegration in combination with preexisting crevasses (Scambos et al., 2003). Most of the melt-pond area (395 km2) at the northern ice front still exists. We infer that the existence and formation of melt ponds is not re-sponsible for the changes and even more, that melt-pond drainage into crevasses
15
played no role in all break-up events on WIS.
The following factors cannot be excluded and thus, might have led to changes of WIS in the past decade:
– Increased basal melting: WIS is particularly sensitive to changes in basal melt rates, as it is thin and mass gain is not dominated by glacier inflow, but rather by
20
in situ accumulation. Today, the widely rifted area in the central ice shelf is also an area of low surface elevations and therefore, thin ice thickness. Dinniman and Klinck (2004) have shown the potential of warm water masses to flow across con-tinental shelf break. Bathymetry of the Bellinghausen Sea (Bolmer et al., 2004) demonstrate a trough between Latady and Charcot Island, and a continental shelf
25
TCD
2, 341–382, 2008Changes of Wilkins Ice Shelf
M. Braun et al.
Title Page
Abstract Introduction
Conclusions References
Tables Figures
◭ ◮
◭ ◮
Back Close
Full Screen / Esc
Printer-friendly Version
Interactive Discussion
melt rates would thus be a plausible explanation for the observed changes. A proof is, however, impossible without detailed analysis of variations in the mass balance. Since the required datasets are not available for the late 1980s and early 1990s, such an analysis is not accomplishable.
– Exceeding of a critical limit in material parameters: The complete area covered by
5
today’s failure zones, showed evidence for brine infiltration in radio echo sound-ings. Furthermore, brine infiltration in combination with large surface accumu-lation form an ice mass that does likely not consist of pure meteoric ice but an ice matrix with brine pockets. Its high surface temperature suggests the WIS consists mainly of warm ice. The tensile strength of polycrystalline ice rises by
10
approximately 25% upon decreasing temperature from−5◦C to−20◦C, Schulson
(1999). Both factors, salinity and temperature, are known in sea ice to determine the mechanical strength (e.g. Weeks and Ackley, 1982). We infer that both fac-tors also contribute to the mechanical strength of WIS as well. Thus, it has to be considered, that rising water temperatures led to an increased temperature of
15
the bulk ice mass and that the mechanical strength fell below a threshold, easing crack formation. Temperature dependent fracture toughness has also previously been proposed by Vaughan and Doake (1996) as a possible reason for ice shelf disintegration.
Unfortunately, these are only speculative ideas of what exactly WIS has experienced,
20
since there are too few observed variables accessible over the last 15 years. This exemplifies the need for continuous acquisition of at least a basic set of glaciological variables, including ice thickness, speeds, surface accumulation, temperatures and oceanic variables that allow verifying or falsifying assertions and establishing general statements.
TCD
2, 341–382, 2008Changes of Wilkins Ice Shelf
M. Braun et al.
Title Page
Abstract Introduction
Conclusions References
Tables Figures
◭ ◮
◭ ◮
Back Close
Full Screen / Esc
Printer-friendly Version
Interactive Discussion
4.4 Fate of WIS
Currently, the largest threat for WIS is the coalescence of the existing rifts on the con-nection between Charcot and Latady Islands, with the rift north of Vere Ice Rise (Fig. 6, white dotted line) with the crack of the open water at “H”. The distance of the tail from the crack at “H” to the southernmost rift parallel to the ice front is only 2.8 km. If this
5
connection is formed, the remaining area of the stripe between Charcot and Latady Island are considered to collapse, leading to a total loss of about 2100 km2.
A rift east of Petrie Ice Rises (slightly visible in Fig. 6c below the left, long black ar-row), indicates a worst case scenario. A possible future equilibrium line could be a line between Latady Island, Petrie Ice Rises, Dorsey Island and Mozart Ice Piedmont, and
10
thus leaving about 8000 km2of the 13 000 km2intact. There are to date no indications for further area loss.
Despite the arising question from when on the terminology disintegration of ice shelves is adaptive, disintegration is a process leading inescapably to non-existence of the ice shelf. The sequence cascade of failures we have observed can be assumed to
15
be one of the processes of disintegration.
5 Conclusions
This study revealed that WIS has undergone significant change in the past two decades. The central part of WIS is today intersected by long rifts that are formed in pre-conditioned failure zones around ice rises. The evolution of the rifts could be
20
followed by means of multi-temporal satellite image analysis to break-up events at the ice front.
The recent break-up has left only a very narrow; already fractured connection in a sensitive area that is stabilizing the northern part of the ice shelf. Furthermore, a new rift connection formed between already existing fractures, crossing almost the entire
25
TCD
2, 341–382, 2008Changes of Wilkins Ice Shelf
M. Braun et al.
Title Page
Abstract Introduction
Conclusions References
Tables Figures
◭ ◮
◭ ◮
Back Close
Full Screen / Esc
Printer-friendly Version
Interactive Discussion
at most another 5000 km2 of the 13 000 km2 of WIS, are at risk if this connection to Charcot Island will be lost.
We show that the evolution of failure zones has two components: continuous length-ening and deeplength-ening caused by tensile stress (small scale variations) and discon-tinuous, fast development caused by break-up events (large scale variations). The
5
evolution of failure zones can be contained by zones of high compressive stresses. Buoyancy forces were responsible for rift formation before the recent break-up in end of February 2008. We infer, accumulation of bending stresses from buoyancy forces, e.g. by enhanced basal melting at ice fronts or coalescing flow units, is a considerable factor for ice shelf break-up, in particular because of the short timescales of its sudden
10
release.
We found evidence that pre-conditioning of the ice shelf by failure zones, that occur at ice rises, and triggered by break-up events, are leading to a sequence cascade of failure. This can be assumed to be one of the processes of ice shelf disintegration.
This study points out the importance of an investigation of the material condition of
15
the ice of WIS, like the fracture toughness and viscosity. This is of particular relevance, since the WIS consists of a bulk mass of warm ice, might be prone to fracturing more than others. Further remote sensing analysis should address kinematics of the ice shelf and its tributaries as well as their possible variations, in particular for areas where such information is not available so far. Any in-situ measurements (e.g. basal melt
20
rates, density, accumulation, velocities) would considerably support further integrated remote sensing analysis as well would do a better understanding of ocean circulation and its changes in that part of the Antarctic Peninsula. It is beyond doubts that moni-toring WIS and its tributaries in near future is worthwhile and will certainly bring further understanding of the mechanisms leading to ice shelf break-up.
25
TCD
2, 341–382, 2008Changes of Wilkins Ice Shelf
M. Braun et al.
Title Page
Abstract Introduction
Conclusions References
Tables Figures
◭ ◮
◭ ◮
Back Close
Full Screen / Esc
Printer-friendly Version
Interactive Discussion
the changed dynamic state.
Acknowledgements. M. Braun and A. Humbert acknowledge support by the German Research
Council under grants BR 2105/4-1-3 and HU 1570/2-1. Data for this study was provided under ESA IPY AO 4032, AOALO 3575 and CryoSat AO 1274. The authors would like to thank NSIDC ICESAT & NASA Cryosphere Program for making the ICESat releases available and
5
Christopher A. Shuman for support and discussion.
We wish to thank Dietmar Gross and Ralf Mueller (Darmstadt University of Technology) for use-ful discussions on fracture mechanics and rift formation. We would like to thank Heinz Bennat and J ¨orn Sievers (Bundesamt f ¨ur Kartographie und Geod ¨asie) for making Landsat imagery of the Geographic Information System of Antarctica available.
10
References
Arendt, A. A., Echelmeyer, K. A,. Harrison, W. D., Lingle, C. S., and Valentine, V. B.: Rapid wastage of Alaska glaciers and their contribution to rising sea level, Science, 297, 382–386, 2002.
Arthern, R. J., Winebrenner, D. P., and Vaughan, D. G.: Antarctic snow accumulation mapped
15
using polarization of 4.3-cm wavelength microwave emission, J. Geophys. Res., 111, D06107, doi:10.1029/2004JD005667, 2006.
Bassis, J. N., Fricker, H. A., Coleman, R., and Minster, J.-B.: An investigation into the forces that drive ice-shelf rift propagation on the Amery Ice Shelf, East Antarctica, J. Glaciol., 54(184), 17–27, 2008.
20
Bindschadler, R., Scambos, T. A., Rott, H., Skvarca, P., and Vornberger, P.: Ice dolines on Larsen Ice Shelf, Antarctica, Ann. Glac., 34, 283–290, 2002.
Bolmer, S. T., Beardsley, R. C., Pudsey, C., Morris, P., Wiebe, P., Hofmann, E., Anderson, J., and Maldonado, A.: A High-Resolution Bathymetry Map of Marguerite Bay and adjacent Western Antarctic Peninsula Shelf Southern Ocean GLOBEC Program, W.H.O.I Technical
25
Report WHOI-2004-02, 2004.
Comiso, J. C.: Variability and trends in Antarctic surface temperatures from in situ and satellite infrared measurements, J. Climate, 13, 1674–1696, 2000.
TCD
2, 341–382, 2008Changes of Wilkins Ice Shelf
M. Braun et al.
Title Page
Abstract Introduction
Conclusions References
Tables Figures
◭ ◮
◭ ◮
Back Close
Full Screen / Esc
Printer-friendly Version
Interactive Discussion
Cooper, A. P. R. and Hinton, J. C.: Correction of satellite radar altimeter data on ice-covered surfaces in Antarctica using an integrated Geographical Information System, Int. J. Rem. Sens., 17(7), 1367–1376, 1996.
De Angelis, H. and Skvarca, P.: Glacier surge after ice shelf collapse, Science, 299, 1560– 1562, 2003.
5
Dinniman, M. S. and Klinck, J. M.: A model study of circulation and cross-shelf exchange on the west Antarctic Peninsula continental shelf, Deep Sea Res. II, 51, 2003–2022, 2004. Doake, C. S. M.: Ice-shelf densities from a comparison of radio echo and seismic soundings,
Ann. Glaciol., 5, 47–50, 1984.
Doake, C. S. M. and Vaughan, D. G.: Breakup of Wordie Ice Shelf, Antarctica, IAHS Publ., 208,
10
161–165, 1991a.
Doake, C. S. M. and Vaughan, D. G.: Rapid disintegration of the Wordie Ice Shelf in response to atmospheric warming, Nature, 350(6316), 328–330, 1991b.
Doake, C. S. M., Corr, H. F. J., Rott, H., Skvarca, P., and Young, N. W.: Breakup and conditions for stability of the northern Larsen Ice Shelf, Antarctica, Nature, 391, 778–780, 1998.
15
Fox, A. J. and Vaughan, D. G.: The retreat of Jones Ice Shelf, Antarctic peninsula, J. Glaciol., 51(175), 555–560, 2005.
Glasser, N. F. and Scambos, T. A.: A structural glaciological analysis of the 2002 Larsen B ice shelf collapse, J. Glaciol., 54(184), 3–16, 2008.
Gross, D. and Seelig, T.: Fracture Mechanics: With an Introduction to Micromechanics,
20
Springer, Berlin, 327 p., 2006.
Harangozo, S. A., Colwell, S. R., and King, J. C.: An analysis of a 34-year air temperature record from Fossil Bluff(71′′S, SSOW), Antarctica, Ant. Sci., 9(3), 355–363, 1997.
Hughes, T.: On the Disintegration of ice shelves, J. Glaciol., 29(101), 98–117, 1983.
Humbert, A., Greve, R., and Hutter, K.: Parameter sensitivity studies for the ice flow of the
25
Ross Ice Shelf, Antarctica, J. Geophys. Res., 110(F4), F04022, doi:10.1029/2004JF000170, 2005.
Humbert, A. and Pritchard, H.: Numerical simulations of the ice flow dynamics of the Brunt Ice Shelf – Stancomb Wills Ice Tongue System, FRISP report 17, 85–97, 2006.
King, J. C.: Recent climate variability in the vicinity of the Antarctic Peninsula, Int. J. Climate,
30
14, 357–369, 1994.
TCD
2, 341–382, 2008Changes of Wilkins Ice Shelf
M. Braun et al.
Title Page
Abstract Introduction
Conclusions References
Tables Figures
◭ ◮
◭ ◮
Back Close
Full Screen / Esc
Printer-friendly Version
Interactive Discussion
Lucchita, B. K. and Rosanova, C. E.: Retreat of northern margins of GeorgeVI and Wilkins Ice Shelves, Antarctic Peninsula, Ann. Glaciol., 27, 41–46, 1998.
Lythe, M. B., Vaughan, D. G., and the BEDMAP Consortium: BEDMAP – bed topography of the Antarctic. 1:10,000,000 scale man. BAS (Misc) 9, Cambridge, British Antarctic Survey, 2000.
5
Mantripp, D. R., Ridley, J. K., and Rapley, C. G.: Antarctic map from the Geosat Radar Altimeter Geodetic Mission, Earth Observ. Quart., 37–38, 6–10, 1992.
Meredith, M. P. and King, J. C.: Climate change in the ocean to the west of the Antarctic Peninsula during the second half of the 20th century, Geophys. Res. Lett., 32, L19604, doi:10.1029/2005GL024042, 2005.
10
Morris, E. M. and Mulvaney, R.: Recent variations in surface mass balance of the Antarctic Peninsula ice sheet, J. Glaciol., 50(169), 257–267, 2004.
Morris, E. M. and Vaughan, D. G.: Spatial and temporal variation of surface temperature on the Antarctic Peninsula and the limit of viability of ice shelves, Ant. Res. Ser., 79, 61–68, 2003. Peel, D. A. and Clausen, H. B.: Oxygen isotope and total beta-radioactivity measuremens on
15
10m ice cores from the Antarctic Peninsula, J. Glaciol., 28(98), 43–55, 1982.
Pritchard, H. D. and Vaughan, D. G.: Widespread acceleration of tidewater glaciers on the Antarctic Peninsula, J. Geophys. Res., 112, 1–10, F03S29, doi:10.1029/2006JF000597, 2007.
Rau, F., Mauz, F., de Angelis, H., Ja ˜na, R., Arigony Neto, J., Skvarca, P., Vogt, S., Saurer, H.,
20
and Gossmann, H.: Variations of glacier frontal positions on the northern Antarctic Peninsula, Ann. Glaciol., 39, 525–530, 2003.
Ridley, J.: Surface melting on Antarctic Peninsula ice shelves detected by passive microwave sensors, Geophys. Res. Lett., 20(23), 2639–2642, 1993.
Rignot, E. and Thomas, R. H.: Mass balance of polar ice sheets, Science, 297(5586), 1502–
25
1506, 2002.
Rignot, E., Braaten, D., Gogineni, S. P., Krabill, W. B., and McConnell, J. R.: Rapid ice discharge from southeast Greenland glaciers, Geophys. Res. Lett., 31, L10401, doi:10.1029/2004GL019474, 2004.
Rignot, E., Casassa, G., Gogineni, S., Kanagaratnam, P., Krabill, W., Pritchard, H., Rivera,
30
TCD
2, 341–382, 2008Changes of Wilkins Ice Shelf
M. Braun et al.
Title Page
Abstract Introduction
Conclusions References
Tables Figures
◭ ◮
◭ ◮
Back Close
Full Screen / Esc
Printer-friendly Version
Interactive Discussion
Rott, H., Skvarca, P., and Nagler, T.: Rapid collapse of northern Larsen Ice Shelf, Antarctica, Science, 271(5250), 788–792, 1996.
Rott, H., Rack, W., Nagler, T., and Skvarca, P.: Climatically induced retreat and collapse of northern Larsen Ice Shelf, Antarctic Peninsula, Ann. Glaciol., 27, 86–92, 1998.
Rott, H., Rack, W., Skvarca, P., and Angelis, H. D.: Northern Larsen Ice Shelf, Antarctica:
5
further retreat after collapse, Ann. Glaciol., 34, 277–282, 2002.
Scambos, T., Hulbe, C., Fahnestock, M., and Bohlander, J.: The link between climate warming and break-up of ice shelves in the Antarctic Peninsula, J. Glaciol., 46, 516–530, 2000. Scambos, T., Hulbe, C., and Fahnestock, M.: Climate-induced ice shelf disintegration in the
Antarctic Peninsula, in: Antarctic Peninsula climate variability: historical and
paleoenviron-10
mental perspectives, Ant. Res. Ser., 79, 79–92, 2003.
Scambos, T. A., Bohlander, J. A., Shuman, C. A., and Skvarca, P.: Glacier acceleration and thinning after ice shelf collapse in the Larsen-B embayment, Antarctica, Geophys Res. Lett., 31, 1–4, 2004.
Schulson, E. M.: The Structure and Mechanical Behavior of Ice, J. Mater., 51, 21–27, 1999.
15
Shabtaie, S. and Bentley, C. R.: Tabular Icebergs: Implications from geophysical studies of ice shelves, J. Glaciol., 28(100), 413–430, 1982.
Shepherd, A. and Wingham, D.: Recent sea-level contributions of the Antarctic and Greenland ice sheets, Science, 315, 1529–1532, 2007.
Shepherd, A., Wingham, D., Payne, T., and Skvarca, P.: Larsen Ice Shelf Has Progressively
20
Thinned, Science, 302(5646), 856–859, doi:10.1126/science.1089768, 2003.
Simmons, D. A.: Flow of the Brunt Ice Shelf, Antarctica, derived from Landsat images, 1974– 1985, J. Glaciol., 32(111), 252–254, 1986.
Sievers, J. and Bennat, H.: Reference systems of maps and geographic information systems of Antarctica, Ant. Sci., 1, 351–362, 1989.
25
Skvarca, P.: Fast recession of the northern Larsen Ice Shelf monitored by space images, Ann. Glaciol., 17, 317–321, 1993.
Skvarca, P., Rack, W., Rott, H., and Ibarz ´abal y Don ´angelo, T.: Evidence of recent climatic warming on the eastern Antarctic Peninsula, Ann. Glaciol., 27, 628–632, 1999.
Smith, B. M. E.: Airborne radio echo sounding of glaciers in the Antarctic Peninsula, Br. Antarct.
30
Surv. Sci. Rep., 72, 1972.
TCD
2, 341–382, 2008Changes of Wilkins Ice Shelf
M. Braun et al.
Title Page
Abstract Introduction
Conclusions References
Tables Figures
◭ ◮
◭ ◮
Back Close
Full Screen / Esc
Printer-friendly Version
Interactive Discussion
2007.
Swithinbank, C.: Satellite image atlas of glaciers of the world: Antarctica, US Geol. Sur. Pro. Pap. 1386-B, 1988.
Tedesco, M.: Updated 2008 surface snowmelt trends in Antarctica, Eos Trans., 89(13), 126, 2008.
5
Torinesi, O., Fily, M., and Genthon, C.: Interannual variability and trend of the Antarctic ice sheet summer melting period from 20 years of spaceborne microwave data, J. Climate, 16, 1047–1060, 2003.
Turner, J., Colwell, C. R., and Harangozo, S.: Variability of precipitation over the western Antarc-tic Peninsula from synopAntarc-tic observations, J. Geophys. Res., 102(D12), 13 999–14 007, 1997.
10
Turner, J., Colwell, S. R., Marshall, G. J., and Lachlan-Cope, T. A.: Antarctic Climate Change During the last 50 Years, Int. J. Climatol., 25, 279–294, 2005.
Uenzelmann-Neben, G., Gohl, K., Larter, R. D., and Schl ¨uter, P.: Differences in ice retreat across Pine Island Bay, West Antarctica, since the Last Glacial Maximum: Indications from multichannel seismic reflection data, US Geological Survey and The National Acadamies;
15
USGS OF-2007-1047, Short Research Paper 084, doi:10.3133/of2007-1047.srp084, 2007. Vaughan, D. G., Mantrupp, D. R., Sievers, J., and Doake, C. S. M.: A synthesis of remote
sensing data on Wilkins Ice Shelf, Antarctica, Ann. Glaciol., 17, 211–218, 1993.
Vaughan, D. G. and Doake, C. S. M.: Recent atmospheric warming and retreat of ice shelves on the Antarctic Peninsula, Nature, 379, 328–331, 1996.
20
Vaughan, D. G.: A new classification scheme for ice shelves based on mechanisms of mass gain and loss, Pol. Rec., 34(188), 56–58, 1998.
Vaughan, D. G., Marshall, G. J., Connolley, W. M., King, J. C., and Mulvaney, R.: Devil in the Detail, Science, 293(5536), 1777–1779, 2001.
Vaughan, D.: Recent trends in melting conditions on the Antarctic Peninsula and their
impli-25
cations for ice-sheet mass balance and sea level, Arctic, Ant. Alp. Res., 38(1), 147–152, 2006.
Vieli, A., Payne, A. J., Shepherd, A., and Du, Z.: Causes of pre-collapse changes of the Larsen B ice shelf: numerical modelling and assimilation of satellite observations, Earth Planet. Sci. Lett., 259, 297–306, 2007.
30
Ward, C. G.: Mapping ice front changes of M ¨uller Ice Shelf, Antarctic Peninsula, Antarctic Sci., 7(2), 197–198, 1995.
Mono-TCD
2, 341–382, 2008Changes of Wilkins Ice Shelf
M. Braun et al.
Title Page
Abstract Introduction
Conclusions References
Tables Figures
◭ ◮
◭ ◮
Back Close
Full Screen / Esc
Printer-friendly Version
Interactive Discussion
graphs, 82-1, 1982.
Wingham, D., Shepherd, A., Muir, A., and Marshall, G. J.: Mass balance of the Antarctic ice sheet, Philos. Trans. R. Soc., Ser. A, 364, doi:10.1098/rsta.2006.1792, 2006.
Zwally, H. J., Giovinetto, M. B., Li, J., Cornejo, H. G., Beckley, M. A., Brenner, A. C., Saba, J. L., and Yi, D.: Mass changes of the Greenland and Antarctic ice sheets and shelves and
5
contributions to sea level rise: 1992–2002, J. Glaciol., 51, 509–527, 2005.