Atlas Journal of Biology 3 (2): 224–235, 2015 doi: 10.5147/ajb.2015.0137
Atlas J
our
nal of
Biolog
y - ISSN 2158-9151. Published By Atlas Publishing
, LP (www
.atlas-publishing
.org)
Genetic Mapping of QTL Associated with Seed Macronutrients
Accumulation in ‘MD 96-5722’ by ‘Spencer’ Recombinant
In-bred Lines of Soybean
Nacer Bellaloui
1, Laila Khandaker
2, Masum Akond
2, Stella K. Kantartzi
3, Khalid Meksem
3,
Al-emu Mengistu
4, David A Lightfoot
3, and My Abdelmajid Kassem
2*1
Crop Genetics Research Unit, Agricultural Research Service, U.S. Department of Agriculture, 141 Experiment
Station Road, P.O. Box 345, Stoneville, MS, USA;
2Plant Genomics and Biotechnology Lab, Department of
Biological Sciences, Fayetteville State University, Fayetteville, NC, USA;
3Department of Plant, Soil and
Agri-cultural Systems, Southern Illinois University, Carbondale, IL, USA;
4Crop Genetics Research Unit, USDA-ARS,
Jackson, TN, USA;
5Current Address: The School of Arts and Sciences, American University of Ras Al Khaimah,
Ras Al Khaimah, P.O. Box 10021, UAE.
Received: February 7, 2015 / Accepted: March 15, 2015
__________________________________________________
* Corresponding author: [email protected]
Abstract
Research of quantitative trait loci (QTL) for macronutrient ac-cumulation in soybean seed is limited. Therefore, the objec-tive of this research was to identify QTL related to macronutri-ents (N, C, S, P, K, Ca, and Mg) in seeds in 92 F5:7 recombinant inbred lines (RILs) developed from a cross between MD 96-5722 (MD) and Spencer using a total 5,376 Single Nucleotide Polymorphism (SNP) markers. A genetic linkage map based on SNP markers was constructed using the Illumina Ininium SoySNP6K BeadChip Array. The RILs were genotyped using 537 polymorphic, reliably segregating SNP markers. A total of 8 QTL for K (qPOT001-qPOT008) were identiied on LGs D1b (Chr 1), N (Chr 3), A1 (Chr 5), O (Chr 10), F (Chr 13), B2 (Chr 14), and J (Chr 16). Four QTL for Mg (qMAG001-qMAG004) were identiied on LGs N (Chr 3), A1 (Chr 5), J (Chr 16), and G (Chr 18). One QTL for P (qPHO001), one for C on LG J (Chr 16), one for N (qNIT001) and S (qSUL001) on the same LG J (Chr 16), and one QTL for Ca (qCAL001) on LG G (Chr 18). K and Mg QTL were clustered together on LG A1 (Chr 5) with a peak position of 9.50 cM and LOD support interval of 8.50-9.50 cM. Similar observation was noticed for P, K, Mg, C, N, and S, where the QTL were clustered on LG J (Chr 16) with peak position of 11 cM for K, P, and S, and 10
Introduction
Macronutrients such as N, C, S, P, K, Mg, and Ca are essential for plant growth, development, and production, and their dei -ciency in soil leads to yield loss, disease infection, and poor seed quality. Metabolic and physiological roles of these nutrients were well documented (Mengel and Kirkby, 1982; Barker and
This is an Open Access article distributed under the terms of the Creative Commons Attribution License
(http://creativecom-cM for C and N, and 12 (http://creativecom-cM for Mg. The LOD support inter-vals for all these clustered QTL were between 8.90 and 12.30 cM. The QTL clustering of these nutrients suggests possible common physiological and genetic relationships, suggest-ing possible similar metabolic processes and pathways for these nutrients. The inverse relationships between N:S ratio and all nutrients suggest possible use of N:S ratio as a mea-sure for higher nutrients accumulation in seed. Since most of QTL identiied in this study were not previously reported, this research will further help breeders to improve nutrient ac-cumulation in seeds and contribute to our understanding of the physiological and genetic bases of seed nutrition quality.
Atlas J
our
nal of
Biolog
y - ISSN 2158-9151. Published By Atlas Publishing
, LP (www
.atlas-publishing
.org)
225
Pilbeam, 2007; Marschner, 2012). For example, N is involved in protein synthesis and protein storage, nucleic acid (DNA and RNA), phytohormones, co-enzymes, and energy transfer systems. Sulfur is involved in enzymes, co-enzymes, S-containing amino acids such as cysteine and methionine (two amino acids that are deicient in soybean cultivars). Phosphorus role in plants includes its involvement in cell membrane, lipid synthesis, energy trans-fer as ATP and NADP-H, and phosphorylation reactions, nucleic acids (DNA and RNA), carbohydrate metabolism, and nutrient active uptake processes. Magnesium is important for chlorophyll molecule, osmoregulation, cell development, activation of ATPase and enzyme molecules (Balke and Hodges, 1975), activation of ribulose bisphosphate carboxylase (Lilley and Walker, 1975), and CO2 assimilation and carbohydrate production. Calcium is an important mineral for membrane permeability, cell structure, cell membrane integrity, and stabilization. Calcium deiciency leads to a leaky and impaired membrane (Marinos, 1962; Van Steveninck, 1965). It has a role in germination and growth of pollen, cell nucleus matrix (Wunderlich, 1978), interaction with protein bound-membrane enzymes to make Ca-protein. The process of Ca-protein complex formation is regulated by cellu-lar lux of Ca. Potassium is essential for osmoregulation, stomatal closure, carbohydrate movement, nutrient mobility and uptake, photorespiration and CO2 ixation, activation of enzymes, trans -location and mobilization of stored metabolites, and ATPase ac-tivity stimulation.
Macronutrient accumulation in seeds determines the nutrition-al vnutrition-alue of seeds. For example, the major storage form for P in seeds of plants is myo-inositol-1,2,3,4,5,6-hexakisphosphate (IP6, or phytic acid), and this compound often chelates metal ions such as Ca, Mn, Zn, and Fe (Raboy, 1997), and the relationship between the accumulation of P in seed and minerals such as Ca, Mg, Fe, Mn, Cu is not well known. Calcium in seeds determines the quality of soyfoods such as tofu, natto, and miso (Mullin and Xu, 2001; Zhang et al., 2009). The accumulation of nutrients in seed involves complex physiological and metabolic process starting from their uptake through translocation and distribution, to their movement from leaves to seed. In spite of the enormous efforts devoted to plant nutrition research, mechanisms control-ling the movement of nutrients within plants and from leaves to seeds are still not well understood. This is due to a complex process of nutrient metabolism that are affected by several bi-otic and abibi-otic stress factors such as drought, heat, disease, and nutrients levels in the soil and their availability. Therefore, understanding the physiological and genetic bases of nutrients accumulation in seeds and genetic factor controlling the accu-mulation of nutrients in seeds is critical for breeding selection for higher seed nutrition qualities.
Mapping QTL on the genome is becoming increasingly im-portant in modern breeding programs through marker-assisted selection (MAS) and gene discovery (Price, 2006). There are many successful examples of using QTL to facilitate crop culti-var development, especially for disease resistance (Beaver and Osorno, 2009; Swarbrick et al., 2009) and quality improvement (Blair et al., 2009; Sabouri, 2009). However, information on ge-netic mapping for macronutrients accumulation in seeds is scares (Zhang et al., 2009), and what is available deals with other
species such as seed P QTL in Andean bean (Cichy et al., 2009); K QTL related to K eficiency in wheat (Kong et al., 2013); nutri -ents QTL in Arabidopsis (Chardon et al., 2014); QTL associated with P in seed in mungbean (Sompong et al., 2012); QTL relat-ed to P in serelat-ed in common bean (Blair et al., 2009); QTL in serelat-ed minerals in Brassica napus) (Ding et al., 2010) mostly deals with macronutrients and their status in soybean leaves, shoot, or roots, but not in seeds. For example, QTL of P nutrition in relation to root morphology and physiology have been reported (Beebe et al., 2006; Li et al., 2007; Chen et al., 2009; Cichy et al., 2009; Li et al., 2009). Liang et al. (2010), using a population of 106 F9 recombinant inbred lines (RILs) derived from a cross between BD2 and BX10 and 296 simple sequence repeat (SSR) markers, found a total of 31 QTL controlling root traits and P eficiency in soybean. Among them 13 QTL were found for root traits and 18 for P eficiency parameters. Yuste‑Lisbona et al. (2014) stud -ied the epistatic QTL using a population of 185 RILs of a cross involved an adapted common bean (PMB0225 parent) and an exotic nuña bean (PHA1037 parent), and they found 59 QTL on all linkage groups (LGs), 18 of them had individual additive effects, 27 had epistatic effects, and 14 had both effects. It was also found that the detected QTL explained from 8 to 68 % and 2 to 15 % of the additive and epistatic effects, respectively.
Zhang et al. (2009) studied QTL associated with seed calcium content (hardness) in 178 F2:3 and 157 F2:4 lines derived from a cross of SS-516 (low calcium) x Camp (high calcium) using 148 simple sequence repeat markers (SSR). They found four QTL (Ca 1, Ca 2, Ca 3, and Ca 4) on LGs A2, I, and M, identiied by both single-marker analysis and composite-interval mapping, and found that the QTL accounted for 10.7%, 16.3%, 14.9%, and 9.7% of calcium content variation, respectively. Hard seeds do not absorb water during the soaking process and cause prob-lems for soybean sprouting and natto manufacturing (Mullin and Xu, 2001) and hard seed determine soyfoods texture (Trumbull, 1992). Studying Ca levels in seeds determines the quality of tofu, natto, and miso, which make up nearly 90% of the food quality soybean market (Maughan et al., 2000). Also, it was found that Ca in the seed coat to be positively correlated with water absorption (Saio et al., 1973; Saio, 1976). Three QTL for calcium uptake were identiied and accounted for 51.8% of the phenotypic variation, and 3 survivorship QTL were found to explain 78% of the calcium uptake (Lexer et al., 2003).
Atlas J
our
nal of
Biolog
y - ISSN 2158-9151. Published By Atlas Publishing
, LP (www
.atlas-publishing
.org)
Materials and Methods
Plant Material and Growth Conditions
A recombinant inbred lines (RILs) population of 92 F5:7 was developed by a cross between MD 96-5722 (MD) and Spencer to obtain phenotypic and genotypic data. The cross was made in 2004 by Southern Illinois University at Carbondale (SIUC) Breeding Program and advanced to the F5:7 generation by sin-gle‑pod descent method. Soybean lines were grown in a ield at Fayetteville State University (FSU) campus, Fayetteville, NC in 2012 with row spaces of 25 cm and seeding rate of 160,000 seeds ha-1. No fertilizers were added to soil and no insecticide
applications were made. The soybean population was devel-oped as previously reported by Akond et al. (2013). Soybean seed were collected at maturity (R8) for macronutrient (N, C, S, P, K, Mg, P, and Ca) quantiication as described below.
Phosphorus Measurement
The concentrations of P in seeds were determined at seed maturity (R8). Phosphorus concentration was measured spectro-photometrically using the yellow phosphor-vanado-molybdate complex according to Cavell (1955). Briely, a dried ground seed sample of 2 g was ashed to completely destroy organic matter, and after ashing, 10 ml of 6 M HCl was added and the sample was placed in a water bath to evaporate the solution to dryness. After drying, 2 ml of 36% v/v HCl were added; the sample was boiled under the heat. Then, 10 ml of distilled water was added, and the solution was then boiled for a few seconds, transferred to a 50‑mL volumetric lask, diluted to 50 mL with distilled water, and iltered. A volume of 2 ml of iltrate was irst discarded and the remainder was kept for P analysis. A volume of 5 ml of 5 M HCl and 5 ml of ammonium molybdate–ammo-nium metavanadate reagent were added to 5 ml of the iltrate, and the solution was diluted with distilled water to 50 ml. The solution was then allowed to stand for 30 minutes before mea-surement. Ammonium molybdate–ammonium metavanadate was made by dissolving 25 g of ammonium molybdate and 1.25 g of ammonium metavanadate in 500 ml of distilled water. The standard curve was made from P standard solutions (0–50 μg ml-1 of P) using dihydrogen orthophosphates. Phosphorus
con-centrations were determined using a Beckman Coulter DU 800 spectrophotometer at 400 nm.
Seed Minerals, N, S, and C Analysis
Seed samples were collected at maturity stage (R8) and were analyzed for minerals, N, S, and C by digesting 0.6 g of dried, ground plant materials in HNO3 in a microwave diges-tion system. Samples were ground using a Laboratory Mill 3600 (Perten, Springield, IL USA), and the concentration of K, Ca, Mg was determined using inductively coupled plasma spectrometry at (?)The University of Georgia’s Soil, Plant, and Water Labora-tory, Athens, GA, and detailed by Bellaloui et al., 2011, 2014. For N, C, and S measurements, a 0.25 g ground-dried sample was combusted in an oxygen atmosphere at 1350 ºC,
convert-ing elemental N, S, and C into N2, SO2, and CO2, respectively. These gases were then passed through infrared cells and N, S, and C are determined by an elemental analyzer using thermal conductivity cells (LECOCNS-2000 elemental analyzer, LECO Corporation, St. Joseph, MI USA) at The University of Georgia’s Soil, Plant, and Water Laboratory, Athens, GA, as detailed by Bellaloui et al. (2011, 2014).
Genetic Map Construction and QTL Identiication
The genetic linkage map of the MD 96-5722 by Spencer was constructed using SoySNP6K Illumina Ininium BeadChip array (Akond et al., 2013) and used to identify QTL for seed macro-nutrients quantiication. The RILs were genotyped using 5,376 Single Nucleotide Polymorphism (SNP) markers using the Illu-mina Ininium SoySNP6K BeadChip array (Akond et al., 2013). A genetic linkage map was constructed based on 537 poly-morphic SNP markers (Akond et al., 2013). The analysis of QTL was conducted using the Composite Interval Mapping (CIM) of WinQTLCart 2.5 (http://statgen.ncsu.edu/qtlcart/WQTLCart. htm) (Wang et al., 2014). The Model 6 with four parameters for forward and backward stepwise regression, 10 cM window size, 1 cM step size and ive control markers were selected for run -ning WinQTLCart (Wang et al., 2014). Permutations of 1,000 were used as threshold. Analysis of Means (CV, maximum and minimum values, and SD) were carried out using Proc Means in SAS. Coeficient of correlation was conducted by SAS using PROC REG.
Results and Discussion
Variation and Correlations
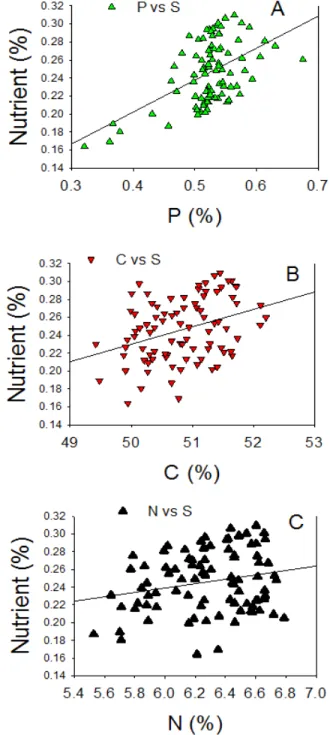
The range of variations of nutrient accumulation in seeds in the population is dependent on the nutrient type (Table 1). The lowest coeficient of variation was noticed for C and N, and the highest was in Ca and S, K, Mg (Table 1). The concentrations of nutrients in MD parent fell within the range of the population lines. However, for the parent Spencer, the nutrient accumula-tion of Ca, K, Mg, and P fell within the range of the populaaccumula-tion lines, but N, C, and S did not. Minerals (Ca, K, Mg, and P) were signiicantly (P<0.0001) correlated compared with non‑minerals (C, N, and S) (Table 2), and the pattern of this correlation was positive either for minerals or non-minerals (Figures 1 and 2).
RILs Parents
Nutrient Mean SD Minimum Maximum Differences (%)
CV MD Spencer
Ca 0.39 0.06 0.23 0.56 143.5 14.13 0.54 0.53 K 1.77 0.19 1.12 2.17 93.8 10.73 1.58 1.56 Mg 0.25 0.03 0.16 0.33 106.3 10.33 0.26 0.25 P 0.52 0.05 0.32 0.68 112.5 9.86 0.60 0.63 C 50.84 0.63 49.4 52.20 5.63 1.24 49.22 49.2 N 6.29 0.31 5.53 6.79 22.8 4.92 6.74 6.82 S 0.25 0.03 0.16 0.31 93.8 14.09 0.29 0.33
Table 1. Mean, standard deviation (SD), minimum and maximum values
of macronutrient concentrations, and coeficient of variation (CV) of
227
Figure 1. Patterns of correlation between seed macronutrient and Ca (A), K (B), and Mg (C) concentrations in a population of 92 F5:7 recombinant inbred lines (RILs).
Atlas J
our
nal of
Biolog
y - ISSN 2158-9151. Published By Atlas Publishing
, LP (www
.atlas-publishing
.org)
Figure 2. Patterns of correlation between seed macronutrient and P (A), C (B), and N (C) concentrations in a population of 92 F5:7 recombinant inbred lines (RILs).
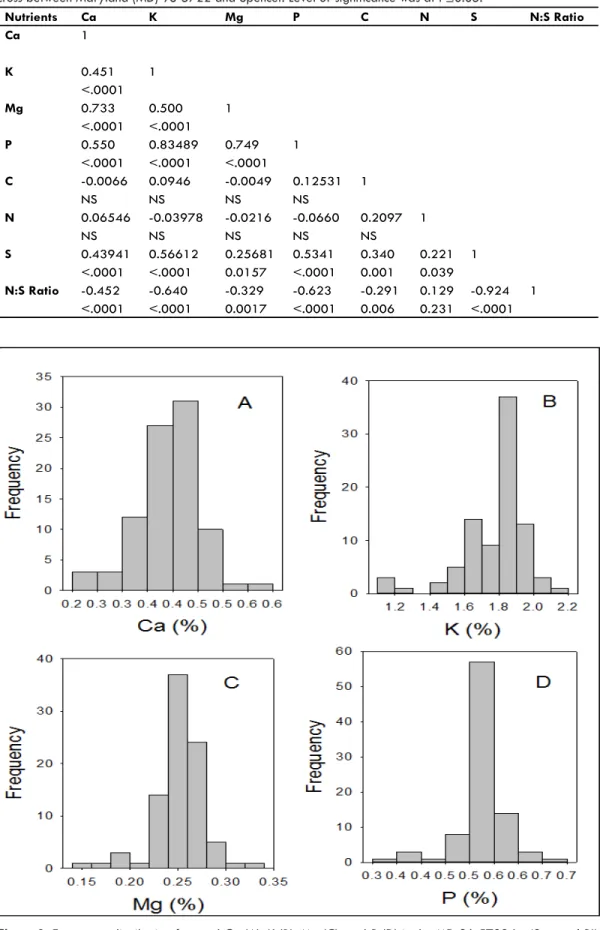
Frequency distribution showed, generally, a normal distribu-tion (Figures 3, 4). The wide range of nutrient concentradistribu-tions in seeds of individual lines was expected as the accumulation of nutrients in seed was reported to be affected by genotype dif-ferences (White and Broadley, 2009; Bellaloui et al., 2011), and could be due to the uptake, transport, accumulation, and distribution of nutrients within the plant. The wide range of nutri-ent accumulation would give breeders an opportunity to select for more eficient genotypes for macronutrients. The differences of coeficient of variation between nutrients in the population
indicated the different level of sensitivity of each nutrient to intrinsic and extrinsic factors.
Atlas J
our
nal of
Biolog
y - ISSN 2158-9151. Published By Atlas Publishing
, LP (www
.atlas-publishing
.org)
Table 2. Correlation between seed nutrient concentrations in 92 F5:7 recombinant inbred lines developed from a
cross between Maryland (MD) 96‑5722 and Spencer. Level of signiicance was at P≤0.05.
Figure 3. Frequency distribution for seed Ca (A), K (B), Mg (C), and P (D) in the MD 96-5722 by ‘Spencer’ RIL population in soybean.
Nutrients Ca K Mg P C N S N:S Ratio
Ca 1
K 0.451 1
<.0001
Mg 0.733 0.500 1
<.0001 <.0001
P 0.550 0.83489 0.749 1
<.0001 <.0001 <.0001
C -0.0066 0.0946 -0.0049 0.12531 1
NS NS NS NS
N 0.06546 -0.03978 -0.0216 -0.0660 0.2097 1
NS NS NS NS NS
S 0.43941 0.56612 0.25681 0.5341 0.340 0.221 1
<.0001 <.0001 0.0157 <.0001 0.001 0.039
N:S Ratio -0.452 -0.640 -0.329 -0.623 -0.291 0.129 -0.924 1
Atlas J
our
nal of
Biolog
y - ISSN 2158-9151. Published By Atlas Publishing
, LP (www
.atlas-publishing
.org)
229
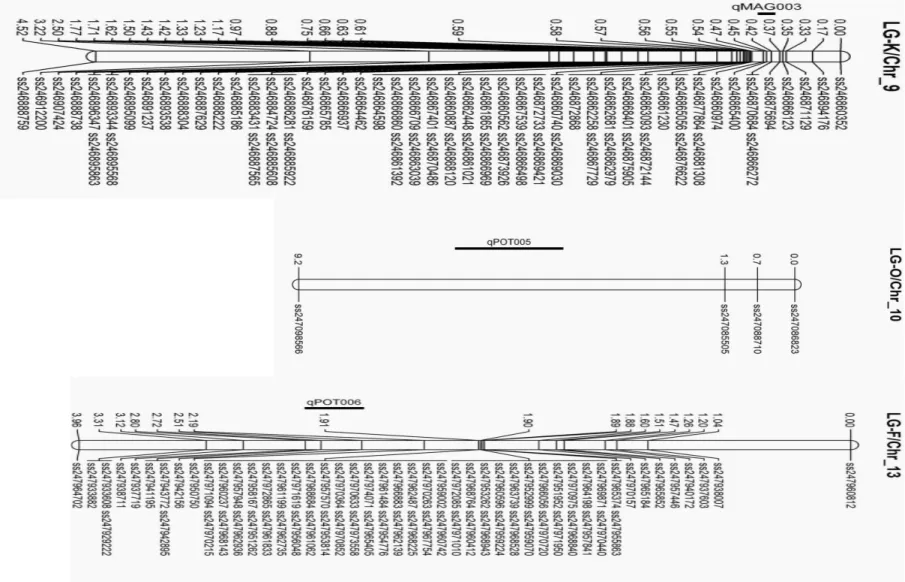
on LG A1 (Chr 5) with a peak position 9.50 cM and LOD sup-port interval of 8.50-9.50 cM. Similar observation was noticed for P, K, Mg, C, N, S where the QTL were clustered on LG J (Chr 16) with peak position of 11 cM for K, P, and S, and 10 cM for C and N, and 12 cM for Mg. The LOD support intervals for all these QTL were between 8.90-12.30 cM (Table 3).
The identiication of QTL for macronutrients is very limited, and almost non-existent for nutrient accumulation in soybean seed. Most of the researchers identiied QTL associated with leaves, roots, and shoot, but very few on seeds. Searching GRIN Soybean base, it was found that Zhang et al. (2009) detected four QTL for seed calcium (Ca 1-Ca 4) on A2, I, M with the optimum position of 16.4 on A2; 9.2 cM on I; 96.7 on M, and 92.7cM on M, with the position of laking markers on the consen -sus map positioned at 116.3-154.11 cM on A2; 36.59-46.22 cM on I; 5.6–1.0 cM on M; and 75.6–1.0 cM on M. For example, Li et al. (2005) found two QTL for leaf P in soybean on LGs F at genomic map position between 11.37-16.08 and 0-3.86 cM. Liang et al. (2010) found 7 QTL associated with shoot and root P in soybean on LGs D2, B1, and F; Specht et al. (2001) found 5 QTL related to carbon isotope for drought tolerance in soy-bean on LGs C2, D2, F, and L; and Panthee et al. (2004), using
a population of 101 F6:8 recombinant inbred lines (RIL), found 17 QTL for soybean seed N on LGs A2, B2, D1b, E, G, M, D1a, and G. They found 3 QTL on LGs A2, 2 on B2, 2 on D1b, 5 on E, 3 on G, 1 on M, and 1 on D1a. They found that phenotypic varia-tion explained by an individual QTL ranged from 5 to 11.6% and concluded that these QTL and markers associated with them may be useful for soybean seed protein improvement. The QTL reported by Panthee et al. (2004) were detected at develop-ing stages of seeds (7 QTL were detected at R5; 3 QTL at R6 stage; and 7 QTL at R7 stage). In the current study, one QTL was detected on LG J (Chr 16) and it is different from those reported by Panthee et al. (2004) and Ramamurthy et al. (2014) as QTL found by Panthee et al. were detected at R5, R6, R7 stages, which characterize developing seeds and not mature seed at R8 stage at which the full seed‑ill and seed physiological maturity was reached. In addition, the QTL for N, reported here, was found clustered with S, Ca, P, C, Mg, and K, suggesting close re-lationships between these nutrients and N. The close relationship between these minerals was relected with the highly signiicant positive correlation (Table 2) as the increase pattern indicated the increase of one nutrients leads to the increase in the other (Figures 1, 2). The QTL clustering of these nutrients suggests simi-lar physiological and metabolic processes. Ramamurthy et al. (2014) found 2 QTL for S on LG J (16) and LG G (Chr 18). We detected one QTL for S on LG J (Chr 16) at a peak position of 11.00 cM with LOD support interval of 9.90-11.10 cM and marker interval of ss248983974- ss248977568. The current QTL for S could be different from that detected by Ramamurthy et al. (2014) as the peak position of their QTL was 66.3 cM.
Zhang et al. (2009) found twenty-two markers on 8 LGs as-sociated with seed Ca content among which six markers on each of LGs A2 and I, 3 markers on LG L, 2 markers on each of LGs B1 and M, and 1 marker on each of LGs D2, F, and G, and one marker on each of LGs D2, I, and M. They reported that the QTL found in this study can be considered as preliminary research on MAS for low Ca content in natto soybean breeding. We were able to detect one Ca QTL on LG G (Chr 18) with a peak posi-tion of 13.20, interval posiposi-tion of 10.70-15.60 cM, and mark-ers intervals of ss249715368- ss249830195. This QTL was not previously reported as Zhang et al. (2009) detected four QTL for seed calcium (Ca 1-Ca 4) on A2, I, M with the optimum po-sition of 16.4 on A2; 9.2 cM on I; 96.7 on M, and 92.7cM on M, with the position of laking markers on the consensus map of 116.3-154.11 cM on A2; 36.59-46.22 cM on I; 5.6–1.0 on M, and 75.6–1.0 on M. Also, we were able to detect four QTL for Mg on LGs N, A, J, and G, which were different from those reported by Ramamurthy et al. (2014), who found one QTL on LG N (Chr 3). Therefore, the current reported QTL for Mg are new indings. Potassium QTL were previously reported by Rama -murthy et al. (2014) who found four QTL on LGs C1, E, J, and G. We detected 8 QTL for seed K on 7 LGs (D1b, N, A1, O, F, B2, and J). Except for QTL on LG J, the rest of QTL were not previ-ously reported, contributing to our understanding of the genetic bases of seed K nutrition. One C QTL was detected in the current research on LG J (Chr 16) with peak position of 10.00 cM and LOD support interval of 9.00-10.00 cM and marker interval of ss248983974- ss248977568. No seed C QTL were previously Figure 4. Frequency distribution for seed C (A), N (B), and S (C)
reported, hence the current QTL is new inding. It must be not -ed here 4 QTL associat-ed with C isotopes relat-ed to drought trait and water eficiency use were reported (Specht et al., 2001). No QTL for seed K, Mg, or S were found in Soybean Base (http://www.soybase.org/search/). Recently, Rama-murthy et al. (2014) identiied QTL for seed mineral concen -trations in three soybean recombinant inbred line mapping populations derived from crossing Williams 82 × DSR-173, Williams 82 × NKS19-90 and Williams 82 × Vinton 81. Us-ing a joint linkage map from these populations, Ramamurthy et (2014) detected forty QTL for 18 traits including seed Mg, S, K, Ca, N:S; one QTL for Mg on Chr 3, two for S on Chr 16 and 18, two for K on Chr 4, 15, 16, and 18, one for Ca on Chr 6, two for N on Chr 14, 15, 16, and 18, and three for N:S on Chr 16, 20, and 3. They found an inverse relation-ship between N:S ratio and most nutrients, and suggested that the N:S ratio can be used as an indirect measure of seed mineral concentration in soybean breeding programs. Our inding agreed with Ramamurthy et al. (2014) in that we found an inverse relationship (correlation) between N:S ratio and all nutrients investigated (Table 2), and QTL detected in
the current research for seed nutrients were different from theirs for the reasons previously explained above. Genetic mapping for P was reported by King et al. (2013), who identiied candi -date gene(s) involved in phosphate metabolism and transport, and P accumulation in soybean seed. They were able to identify one putative QTL region on Chr 12, and this region contained a phosphate transporter gene. Also, they identiied two additional suggestive QTL on Chr 7 and 17, with Chr 7 having both a phos-phate transport gene and a ZIP transporter gene in the region of the QTL. King et al. (2013) reported, using combined total P QTL, 6 QTL on LGs O (Chr 10), G (Chr 18), I (Chr 20), M (Chr 7), H (Chr12), D2 (17). We were able to identify one QTL for seed P accumulation on LG J (Chr 16) that was not previously reported, suggesting that the current P QTL is a new inding. No QTL for seed K, Mg, P, and S were reported in soybean Base (http://www.soybase.org/search/), indicating further research is needed in the area of genetic mapping for seed mineral nutri-tion (King et al., 2013; Ramamurthy et al., 2014).
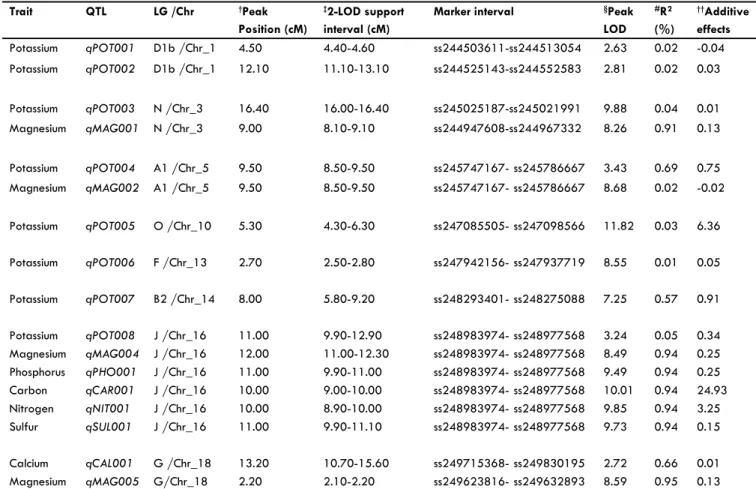
Trait QTL LG /Chr †Peak
Position (cM)
‡2-LOD support
interval (cM)
Marker interval §Peak
LOD
#R2
(%)
††Additive
effects
Potassium qPOT001 D1b /Chr_1 4.50 4.40-4.60 ss244503611-ss244513054 2.63 0.02 -0.04
Potassium qPOT002 D1b /Chr_1 12.10 11.10-13.10 ss244525143-ss244552583 2.81 0.02 0.03
Potassium qPOT003 N /Chr_3 16.40 16.00-16.40 ss245025187-ss245021991 9.88 0.04 0.01 Magnesium qMAG001 N /Chr_3 9.00 8.10-9.10 ss244947608-ss244967332 8.26 0.91 0.13
Potassium qPOT004 A1 /Chr_5 9.50 8.50-9.50 ss245747167- ss245786667 3.43 0.69 0.75 Magnesium qMAG002 A1 /Chr_5 9.50 8.50-9.50 ss245747167- ss245786667 8.68 0.02 -0.02
Potassium qPOT005 O /Chr_10 5.30 4.30-6.30 ss247085505- ss247098566 11.82 0.03 6.36
Potassium qPOT006 F /Chr_13 2.70 2.50-2.80 ss247942156- ss247937719 8.55 0.01 0.05
Potassium qPOT007 B2 /Chr_14 8.00 5.80-9.20 ss248293401- ss248275088 7.25 0.57 0.91
Potassium qPOT008 J /Chr_16 11.00 9.90-12.90 ss248983974- ss248977568 3.24 0.05 0.34 Magnesium qMAG004 J /Chr_16 12.00 11.00-12.30 ss248983974- ss248977568 8.49 0.94 0.25 Phosphorus qPHO001 J /Chr_16 11.00 9.90-11.00 ss248983974- ss248977568 9.49 0.94 0.25 Carbon qCAR001 J /Chr_16 10.00 9.00-10.00 ss248983974- ss248977568 10.01 0.94 24.93 Nitrogen qNIT001 J /Chr_16 10.00 8.90-10.00 ss248983974- ss248977568 9.85 0.94 3.25 Sulfur qSUL001 J /Chr_16 11.00 9.90-11.10 ss248983974- ss248977568 9.73 0.94 0.15
Calcium qCAL001 G /Chr_18 13.20 10.70-15.60 ss249715368- ss249830195 2.72 0.66 0.01 Magnesium qMAG005 G/Chr_18 2.20 2.10-2.20 ss249623816- ss249632893 8.59 0.95 0.13
†Position of peak LOD value on composite maps described previously (Coles et al., 2010);‡The positions that define the two LOD intervals around the position of peak likelihood for the QTL; §The log of odds (LOD) value at the position of peak likelihood of the QTL; #R2estimates the proportion of RIL mean variance (%) explained by the detected QTL; †† A positive number in additive effect of the QTL indicates that the allele for susceptibility was derived from the line indicated and a negative number means that the allele for resistance was derived from the line indicated.
Table 3. Chromosomal locations and parameters associated with the quantitative trait loci (QTL) for seed mineral accumulation in 92 F5:7 re-combinant inbred lines developed from a cross between MD 96-5722 and Spencer.
Atlas J
our
nal of
Biolog
y - ISSN 2158-9151. Published By Atlas Publishing
, LP (www
.atlas-publishing
Atlas Journal of Biology - ISSN 2158-9151. Published By Atlas Publishing, LP (www.atlas-publishing.org)
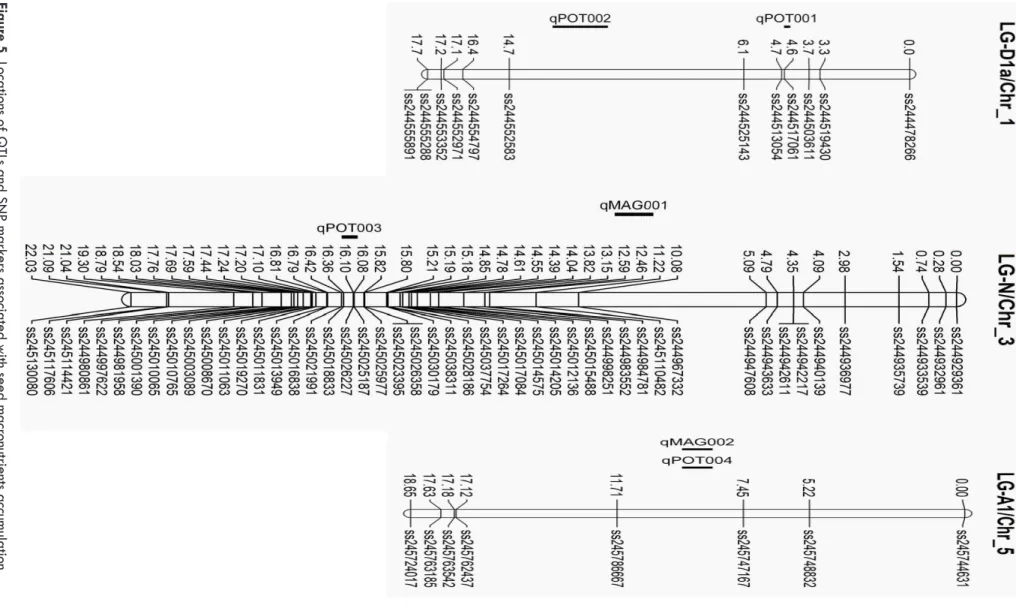
Figur
e 5.
Locations of
Q
TLs and SNP mar
kers associated with seed macr
onutrients accum
ulation.
Atlas Journal of Biology - ISSN 2158-9151. Published By Atlas Publishing, LP (www.atlas-publishing.org)
Figur
e 5.
Continued.
Figur
e 5.
Continued.
Atlas Journal of Biology - ISSN 2158-9151. Published By Atlas Publishing, LP (www.atlas-publishing.org)
Conclusions
Most of the research conducted on the genetic mapping for plant nutrition was associated with leaves, roots, or shoot, but not on nutrient accumulation in seeds. Our current research con-tributes to the limited available information (King et al., 2013; Ramamurthy et al., 2014) on genetic mapping of nutrient ac-cumulation in soybean seeds. The current research showed that several QTL for macronutrients were detected. The genetic anal-yses resulted in 8 QTL for K (qPOT001-qPOT008), four QTL for Mg (qMAG001-qMAG004), one QTL for P (qPHO001), one QTL for N (qNIT001), one QTL for S (qSUL001), and one QTL for C (qCAL001). Most of these QTL are new, contributing to the previously reported QTL. QTL clustering between K and Mg, and between P, K, Mg, C, N, and S indicates physiological and genetic relationships between these nutrients, suggesting pos-sible similar metabolic processes. Information obtained from this research would help breeders to select for higher seed mineral quality, and physiologist to further understand the physiological and genetics based of seed mineral accumulation.
Acknowledgements
The authors would like to thank the Department of Defense (DoD) for funding this work through the grant# W911NF-11-1-0178 to MAK and SK. Many thanks to Pam Ratcliff and the rest of undergraduate and graduate students crew for taking care of plants in the greenhouse and the ield. We also thank Sandra Mosley at USDA-ARS, Stoneville, MS, for lab assistance on nutri-ent analysis. This research was partially funded by United States Department of Agriculture, Agricultural Research Service proj-ect number 6402-21220-012-00D. Mention of trade names or commercial products in this publication is solely for the purpose of providing speciic information and does not imply recom -mendation or endorsement by the Unites States Department of Agriculture (USDA). USDA is an equal opportunity provider and employer.
References
Balke NE and TK Hodges (1975) Plasma Membrane Adenosine Triphos-phatase of Oat Roots: Activation and Inhibition by Mg2+ and ATP. Plant Physiol 55: 83–86.
Barker AV, and DJ Pilbeam (2007) Handbook of Plant Nutrition. Boca Raton, FL, CRC Press, pp. 19-199.
Beaver JS and JM Osorno (2009) Achievements and Limitations of Con-temporary Common Bean Breeding Using Conventional and Molecu-lar Approaches. Euphytica 168: 145–175.
Beebe SE, M Rojas‑Pierce, XL Yan, MW Blair, F Pedraza, F Munoz, J
Tohme, and JP Lynch (2006) Quantitative Trait Loci for Root Ar-chitecture Traits Correlated with Phosphorus Acquisition in Common Bean. Crop Sci 46: 413–423.
Bentsink L, K Yuan, M Koornneef, and D Vreugdenhil (2003) The Ge -netics of Phytate and Phosphate Accumulation in Seeds and Leaves of Arabidopsis thaliana, Using Natural Variation. Theor Appl Genet 106: 1234–1243.
Bilyeu KD, P Zeng, P Coello, ZJ Zhang, HB Krishnan, A Bailey, PR Beuselinck, and JC Polacco (2008) Quantitative Conversion of
Phy-tate to Inorganic Phosphorus in Soybean Seeds Expressing a Bacte-rial Phytase. Plant Physiol 146: 468–477.
Blair MW, TA Sandoval, GV Caldas, SE Beebe, and MI Paez (2009) Quantitative Trait Locus Analysis of Seed Phosphorus and Seed Phy-tate Content in a Recombinant Inbred Line Population of Common Bean. Crop Sci 49 : 237–246.
Broadley MR, JP Hammond, and GJ King (2008) Shoot Calcium and Magnesium Cncentrations Differ Between Subtaxa, are Highly Heri-table, and Associate with Potentially Pleiotropic Loci in Brassica ol-eracea. Plant Physiol 146: 1707–1720.
Chardon F, S Jasinski, M Durandet, A Lécureuil, F Soulay, M Bedu, P Guerche, C Masclaux-Daubresse (2014) QTL Meta-Analysis in Ara-bidopsis Reveals an Interaction Between Leaf Senescence and Re-source Allocation to Seeds. J Exp Bot, Advance Access Published on April 25.
Chen JY, L Xu, YL Cai, and J Xu (2009) Identiication of QTLs for Phos
-phorus Utilization Eficiency in Maize (Zea mays L.) Across P Levels. Euphytica 167: 245–252.
Cichy KA, MW Blair, CHG Mendoza, SS Snapp, and JD Kelly (2009a) QTL Analysis of Root Architecture Traits and Low Phosphorus Toler-ance in an Andean Bean Population. Crop Sci 49: 59–68.
Cichy KA, GV Caldas, SS Snapp, and MW Blair (2009b) QTL Analysis of Seed Iron, Zinc, and Phosphorus Levels in an Andean Bean Popu-lation. Crop Sci 49: 1742–1750.
Correll DL (1998) The Role of Phosphorus in the Eutrophication of Re-ceiving Waters: A Review. J Environ Qual 27: 261–266.
Ding G, M Yang, Y Hu, Y Liao, L Shi, F Xu, J Meng (2010) Quanti -tative Trait Loci Affecting Seed Mineral Concentrations in Brassica napus Grown with Contrasting Phosphorus Supplies. Ann Bot 105: 1221–1234.
Garcia‑Oliveira AL, L Tan, Y Fu, and C Sun (2009) Genetic Identiica -tion of Quantitative Trait Loci for Contents of Mineral Nutrients in Rice Grain. JIPB 51: 84–92.
Ghandilyan A, L Barboza, S Tisne´, C Granier, M Raymond, M
Koorn-neef, H Schat, MG Aarts (2009a) Genetic Analysis Identiies Quan -titative Trait Loci Controlling Rosette Mineral Concentrations in Ara-bidopsis thaliana Under Drought. New Phytol 184: 180–192. Ghandilyan A, N Ilk, C Hanhart, M Mbengue, L Barboza, H Schat, M
Koornneef, M El-Lithy, D Vreugdenhil, M Reymond, and MGM Aarts (2009b) A Strong Effect of Growth Medium and Organ Type
on the Identiication of QTLs for Phytate and Mineral Concentra -tions in Three Arabidopsis thaliana RIL Populations. J Exp Bot 60: 1409–1425.
Hammond JP, MR Broadley, PJ White, GJ King, HC Bowen, R Hayden
et al (2009) Shoot Yield Drives Phosphorus use Eficiency in Brassica pleracea and Correlates with Root Architecture Traits. J Exp Bot 60: 1953–1968.
Harada H and RA Leigh (2006) Genetic Mapping of Natural Variation in Potassium Concentrations in Shoots of Arabidopsis thaliana. J Exp Bot 57: 953–960.
Kong FM, Y Guo, X Liang, CH Wu, YY Wang, Y Zhao, and S Li (2013) Potassium (K) Effects and QTL Mapping for K Eficiency Traits at
Seedling and Adult Stages in Wheat. Plant Soil 373: 877–892. Lexer C, ME Welch, JL Durphy, and LH Rieseberg (2003) Natural
Selec-tion for Salt Tolerance Quantitative Trait Loci (QTLs) in Wild
Sun-lower Hybrids: Implications for the Origin of Helianthus paradoxus, a Diploid Hybrid Species. Mol Ecol 12: 1225–1235.
Li YD, YJ Wang, YP Tong, JG Gao, JS Zhang, SY Chen, (2005) QTL Mapping of Phosphorus Deiciency Tolerance in Soybean (Glycine max L. Merr.). Euphytica 142: 137–142.
Li ZX, ZF Ni, and HR Peng (2007) Molecular Mapping of QTLs for
Root Response to Phosphorus Deiciency at Seedling Stage in Wheat
Atlas J
our
nal of
Biolog
y - ISSN 2158-9151. Published By Atlas Publishing
, LP (www
.atlas-publishing
Atlas J
our
nal of
Biolog
y - ISSN 2158-9151. Published By Atlas Publishing
, LP (www
.atlas-publishing
.org)
(Triticum aestivum L.). P Natl Acad Sci 17: 1177–1184.
Liang Q, X Cheng, M Mei, X Yan, and H Liao (2010) QTL Analysis of Root Traits as Related to Phosphorus Eficiency in Soybean. Ann Bot
106: 223–234.
Lilley RM and DA Walker (1975) Carbon Dioxide Assimilation by Leaves, Isolated Chloroplasts, and Ribulose Bisphosphate Carbox-ylase from Spinach. Plant Physiol 55: 1087-1092.
Liu J, J Yang, R Li, L Shi, C Zhang, Y Long, F Xu, and J Meng (2009)
Analysis of Genetic Factors that Control Shoot Mineral Concentra-tions in Rapeseed (Brassica napus) in Different Boron Environments. Plant Soil 320: 255–266.
Lott JNA, I Ockenden, V Raboy, and GD Batten (2000) Phytic Acid and Phosphorus in Crop Seeds and Fruits: A Global Estimate. Seed Sci Res 10: 11–33.
Loudet O, V Saliba-Colombani, C Camilleri, F Calenge, V Gaudon, A Koprivova, KA North, S Kopriva, F Daniel-Vedele. (2007) Natural Variation for Sulfate Content in Arabidopsis thaliana is Highly Con-trolled by APR2. Nat Genet 39: 896–900.
Marinos NG (1962) Studies on Suhmicroscopic Aspects of Mineral
De-iciencies. Calcium Deiciency in the Shoot Apex of Barley. Am J Bot
49: 834–841.
Maughan PJ, MA Saghai Maroof, and GR Buss (2000) Identiication of
quantitative trait loci controlling sucrose content in soybean (Glycine max) Mol Breeding 6: 105–111.
Maupin LM, ML Rosso, C Shang, and KM Rainey (2011) Genotype X Environment Interaction and Stability of Phosphorus Concentration in
Two Soybean Germplasm Sources with Modiied Phosphorus Com -position. Crop Sci 51: 1518–1524.
Mullin WJ, and W Xu (2001) Study of Soybean Seed Coat Components and their Relationship to Water Absorption. J Agric Food Chem 49: 5331–5335.
Panthee DR, VR Pantalone, CE Sams, AM Saxton, RR West, and WE Ray-ford (2004) Genomic Regions Governing Soybean Seed Nitrogen Accumulation. JAOCS 81: 77-81.
Payne KA, HC Bowen, JP Hammond, CR Hampton, JR Lynn, A Mead et al. (2004) Natural Genetic Variation in Caesium (Cs) Accumulation by Arabidopsis thaliana. New Phytol 162: 535–548.
Peleg Z, I Cakmak, L Ozturk, A Yazici, Y Jun, H Budak, AB Korol, T Fahima, and Y Saranga (2009) Quantitative Trait Loci Conferring
Grain Mineral Nutrient Concentrations in Durum Wheat×Wild Em-mer Wheat RIL Population. Theor Appl Genet 119: 353–369. Price AH (2006) Believe it or Not, QTLs are Accurate! Trends Plant Sci
11: 213–216.
Raboy V (1997) Accumulation and Storage of Phosphate and Minerals. In: BA Larkins and IK Vasil (Eds) Cellular and Molecular Biology of Plant Seed Development. Dordrecht, Kluwer Academic Publishers, pp. 441–477.
Raboy V (2001) Seeds for a Better Future: ‘‘Low Phytate’’ Grains Help to Overcome Malnutrition and Reduce Pollution. Trends Plant Sci 6: 458–462.
Ramamurthy RK, J Jedlicka, GL Graef, and BM Waters (2014)
Iden-tiication of New QTLs for Seed Mineral, Cysteine, and Methionine
Concentrations in Soybean [Glycine Max (L.) Merr.]. Mol Breeding 34: 431–445.
Saio K (1976) Soybean Resistant to Water Absorption. Cereal Food World 21:168–173.
Saio K, K Arai, and T Watanabe (1973) Fine Structure of Soybean
Seed Coat and its Changes on Cooking. Cereal Sci Today 18: 197– 201.
Sankaran R, T Huguet, and M Grusak (2009) Identiication of QTL
Affecting Seed Mineral Concentrations and Content in the Model Legume Medicago Truncatula. Theor Appl Genet 119: 241–253. Schlemmer U, H Muller, and KD Jany (1995) The Degradation of Phytic
Acid in Legumes Prepared by Different Methods. Eur J Clin Nutr 49 (Suppl 3): S207–S210.
Sharpley AN, and PJA Withers (1994) The Environmentally-Sound Management of Agricultural Phosphorus. Fert Res 39: 133–146. Sompong U, P Somta, V Raboy, and P Srinives (2012) Mapping of
Quantitative Trait Loci for Phytic Acid and Phosphorus Contents in Seed and Seedling of Mungbean (Vigna radiata (L.) Wilczek). Breed Sci 62: 87–92.
Trumbull C (1992) Relationships Between Soybean Components and Tofu Texture. J Food Quality 15: 53–66.
Tsao GT, Y Zheng, J Lu, and CS Gong (1997) Adsorption of Heavy
Metal Ions by Immobilized Phytic Acid. Appl Biochem Biotech 63– 65: 731–741.
Vance CP, C Uhde-Stone, and DL Allan (2003) Phosphorus Acquisition and Use: Critical Adaptations by Plants for Securing a Nonrenew-able Resource. New Phytol 157: 423–447.
Van Steveninck RFM (1965) The Signiicance of Calcium on the Appar -ent Permeability of Cell Membranes and the Effects of Substitution with Other Divalent Ions. Physiol Plant 18: 54-69.
Vreugdenhil D, MGM Aarts, M Koornneef, H Nelissen, and WHO Ernst (2004) Natural Variation and QTL Analysis for Cationic Mineral Content in Seeds of Arabidopsis thaliana. Plant Cell Environ 27: 828–839.
Waters BM and MA Grusak (2008a) Quantitative Trait Locus Mapping for Seed Mineral Concentrations in Two Arabidopsis Thaliana Recom-binant Inbred Populations. New Phytol 179: 1033–1047.
White PJ (2005) Calcium. In: Plant Nutritional Genomics, MR Broadley and P J White (Eds), Oxford, Blackwell, pp. 66–86.
White PJ, JP Hammond, GJ King, HC Bowen, RM Hayden, MC Meacham, WP Spracklen, and MR Broadley (2010) Genetic Analysis of
Po-tassium Use Eficiency in Brassica oleracea. Ann Bot-London 105: 1199–1210.
Wu J, YX Yuan, XW Zhang, J Zhao, X Song, Y Li, X Li, R Sun, M
Koornneef, and MGM Aarts (2008) Mapping QTLs for Mineral Accumulation and Shoot Dry Biomass Under Different Zn Nutritional Conditions in Chinese Cabbage (Brassica rapa L. Ssp. pekinensis). Plant Soil 310: 25–40.
Wunderlich F (1978) The Nucleus Matrix: Dynamic Protein Structure in Cell Nucleus. Nature Rdsch 31: 282–288.
Yan XL, P Wu, HQ Ling, GH Xu, FS Xu, and QF Zhang (2006) Plant
Nutriomics in China: An Overview. Ann Bot-London 98: 473–482.
Yuste‑Lisbona FJ, AM Gonzalez, C Capel, M Garcia‑Alcazar, J Ca -pel, AM De Ron, R Lozano, M Santalla (2014) Genetic Analysis of Single-Locus and Epistatic QTLs for Seed Traits in an Adapted × Nuna RIL Population of Common Bean (Phaseolus vulgaris L.). Theor Appl Genet 127: 897–912.
Zhao J, DL Jamar, P Lou, Y Wang, J Wu,X Wang , G Bonnema, M
Koornneef, and D Vreugdenhil (2008) Quantitative Trait Loci Anal-ysis of Phytate and Phosphate Concentrations in Seeds and Leaves of Brassica rapa. Plant Cell Environ 31: 887–900.