Atlas Journal of Biology 2016, pp. 267–273 doi: 10.5147/ajb.2016.0140
Atlas J
our
nal of
Biolog
y - ISSN 2158-9151. Published By Atlas Publishing
, LP (www
.atlas-publishing
.org)
Inluence of Drought Stress on Several Root Traits and their
Correlation with Seed Protein and Oil Contents in Soybean
Ambrocio Zenis
1, Stella Kantartzi
2, Khalid Meksem
2, and My Abdelmajid Kassem
1*1
Plant Genetics, Genomics, and Biotechnology Lab, Department of Biological Sciences, Fayetteville State
Uni-versity, Fayetteville, NC 28301, USA;
2Department of Plant, Soil, and Agricultural Systems, Southern Illinois
University, Carbondale, IL 62901, USA.
Received: May 2, 2016 / Accepted: June 3, 2016
__________________________________________________
* Corresponding author: [email protected]
Abstract
The important crop soybean [Glycine max (L.) Merr.] is cul
-tivated worldwide and the US is its number one exporter. However, farmers face many challenges in cultivating soy
-beans, including drought and diseases that reduce yields drastically. The root system is very important for plants, in
-cluding crops, because it receives water and minerals from the soil so that the plant/crop can photosynthesize, grow, and increase its yield. The objective of this study was to grow the ‘MD 96-5722’ by ‘Spencer’ recombinant inbred line (RIL) population (n=86) in the greenhouse under normal (Group I) and drought stress (Group II) conditions, and compare the root length (RL), root surface area (RSA), average root diam
-eter (ARD), and average root volume (ARV) in the two groups of plants. WhinRhizo software was used to measure the root traits and SPSSTM was used to evaluate population perfor
-mance under normal and drought conditions. JMPTM was used to compare the root traits under normal and drought conditions, and to analyze the correlation between root traits, protein and oil contents. The results showed that there is a huge variation in these traits among the parents ‘MD 96-5722’ and ‘Spencer’, and among their RILs. For Group I plants, the RL of parents and RILs ranged from 20.67 cm to 2,327.88 cm; the RSA ranged from 4.57 cm2 to 1,176.79 cm2;
the ARD ranged from 0.38 mm to 4.04 mm; and the ARV ranged from 0.08 cm3 to 47.34 cm3. For Group II plants, the
RL of parents and RILs ranged from 15.70 cm to 3,562.42 cm; the RSA ranged from 4.15 cm2 to 829.72 cm2; the ARD
ranged from 0.24 mm to 5.74 mm; and the ARV ranged from 0.03 cm3 to 23.67 cm3. It is clear from the results that Group
Introduction
Soybean [Glycine max (L.) Merr.] is a Leguminosae crop grown for its oil, proteins, isolavones, and other bioactive compounds. It also widely used in the food industry and as a biofuel (Rosenthal et al., 2001; Kinney and Clemente, 2005).
According to USDA, North Carolina planted soybeans in 1.82 Million acres and produced 57.3 Million Bushels for a total of $487 Million in 2015 (USDA, 2015). In North Carolina, soybean production amount was 31 million bushels from 1.4 million acres and a total value of $174 million (NCSUCE, 2015). Soybeans are usually planted in early soybean production system (ESPS)
This is an Open Access article distributed under the terms of the Creative Commons Attribution License
(http://creativecom-I plants have higher means of RL [572.58 cm vs. 537.33 cm], RSA [201.20 cm2 vs. 165.50 cm2], ARD [3.96 mm vs. 1.45
mm], and ARV [6.31 cm3 vs. 5.61 cm3] compared to Group II
plants which demonstrates that drought-stressed plants have reduced overall plant growth and development. However, statistically, these differences were not signiicant; therefore, further studies with several replicates should be conducted both in the greenhouse and the ield in order to determine the effects of drought stress on the ‘MD 96-5722’ by ‘Spencer’ RILs. Moreover, studies of quantitative trait loci (QTL) map
-ping of the root traits studied here are underway to genetically map QTL for these root traits in this soybean RIL population.
our
nal of
Biolog
y - ISSN 2158-9151. Published By Atlas Publishing
, LP (www
.atlas-publishing
.org)
(April) or conventional soybean production system (CSPS, May-June) across the US (Bowers, 1995; Taylor et al., 2005; Ouertani et al., 2011). Soybean plants grown in ESPS have increased yield and are drought-tolerant compared to plants grown in CSPS (Taylor et al., 2005; Ouertani et al., 2011).
Plant breeders and researchers are trying to develop culti-vars that are resistant to diseases and drought stress. Drought stress reduces the ability of roots to absorb water and nutrients from the soil and it has been demonstrated that plants with vig-orous and extensive root systems are able to cope with drought and become water deicit-tolerant (WDT) (Pandey et al., 1984; Benjamin and Nielsen, 2006; Reubens et al., 2006). During drought stress seasons, plants usually change the distribution of their roots and grow them deeper to absorb water and miner-als as a mechanism of drought tolerance (Pandey et al., 1984; Benjamin and Nielsen, 2006). In another study, drought-stressed soybean plants have a sharp decrease in their photosynthetic rates, leaf water potentials, starch concentration, and leaf su-crose contents, and pod growth (Liu et al., 2004).
Defending themselves against drought stress, soybean plants close their stomata to escape dehydration but the overall pho-tosynthetic rate is reduced by limiting CO2 intake (via stomata), causing a reduced metabolism that might be reversible with enough supply or availability (Kramer et al., 1995; Specht et al., 2001; Flexas and Medrano, 2002; Liu et al., 2004; Greg-ory, 2006; Mastrodomenico et al., 2013). The reduced photo-synthetic rate has a drastic effect on reducing grain yield. The physiological effects of drought can be estimated by measuring the leaf relative water contents (RWC), root architecture, and reactive oxygen species (ROS) (Hunt et al., 1987; Reddy et al., 2004; Chiante et al., 2006; Reubens et al., 2006; Miller et al., 2010; Comas et al., 2013). During seed ill and pod develop -ment stages, soybean plants, like other crops, need an adequate supply of water and any drought stress will decrease devel-opmental and physiological functions that will lead to high de-creased seed yields (Kadhem et al., 1985; Kramer et al., 1995; Chiante et al., 2006; Comas et al., 2013).
To withstand drought stress, soybean plants and other legumes use several important mechanisms. Among these are growing extensive root systems, water use eficiency, and high eficient nitrogen ixation (Nunberg et al., 2006; Mastrodomenico et al., 2013; Hussain et al., 2014). It is known that drought-stressed plants tend to grow extensive root systems with continuous elon-gation at low root water potentials (Westgate and Boyer, 1985; Kramer et al., 1995; Bing et al., 2005; Nunberg et al., 2006; Mastrodomenico et al., 2013; Hussain et al., 2014).
The objectives of this study are to (1) grow the ‘MD 96-5722’ by ‘Spencer’ recombinant inbred line population (n=86) of soy-bean under drought stress in the greenhouse, study the inluence of drought stress on several root traits such as root length (RL), root surface area (RSA), average root diameter (ARD), and av-erage root volume (ARV), and (2) investigate the correlation be-tween root trait measurements, protein and oil contents of ‘MD 96-5722’ by ‘Spencer’.
Materials and Methods
Plant Material
In this study, the ‘MD 96-5722’ by ‘Spencer’ recombinant in-bred line (RIL) population (n=86) of soybean was used (Akond et al., 2013). These seeds were obtained at the National Soy-bean Research Laboratory (NSRL) in 2006 from Dr. Kantart-zi. The parents of ‘MD 96-5722’ were from a cross between KS4644 and ‘Corsica’ KS4694, whose parents were ‘Shermon and Toano’. ‘Spencer’ came from the crossings between A75-305022 by ‘Century’ (Akond et al., 2013).
Experimental Conditions
The experiment was performed during 2013 (June 2013 to September 2013) in a Greenhouse at Fayetteville State Uni-versity, Fayetteville, North Carolina. Four seeds of parents, ‘MD 96-5722’, ‘Spencer’, and each RIL (n=86; n is the population size) were sown at 1.5–2.0 inches deep in 2-gallon pots (20.32 x 17.78 cm) illed with potting soil of organic material (Miracle Grow potting mix) under daylight temperatures of 24–34o C. The pots were set on a brown sheet, avoiding water capillar-ity from the bottom. The pots were divided into two groups, a control group (n=86) for normal growth and a treatment group (n=86) for drought conditions. The treatment group would un-dergo drought stress during the entire growth development. First week, normal watering was given to each seedling, 3.76 liters of water. Control group would receive normal watering throughout the whole study or when needed. Treatment group was submit-ted through intense drought stress for two weeks after normal watering. Afterwards, watering the plants at least once a week and at 1.5 liters of water.
Root Extraction Method
After eight weeks of planting, roots were carefully extracted from the pots one by one, placed inside a tray illed with wa -ter and washed by hand. La-ter, the roots were left to dry and have just enough moisture in order to separate the lateral roots from the primary root. Roots were separated by using a plastic transparent wrap, the wraps texture allowed for lateral roots to separate easily without damaging the root and minimizing loss of ine lateral roots. Afterwards, to preserve the roots, they were placed inside Ziploc bags and placed in a refrigerator for later analysis. Several root traits such as root length (RL), root surface area (RSA), average root diameter (ARD), and average root volume (ARV) were measured.
Protein and Oil Contents Quantiication
Atlas J
our
nal of
Biolog
y - ISSN 2158-9151. Published By Atlas Publishing
, LP (www
.atlas-publishing
.org)
Root Trait Analysis
The root traits root length (RL), root surface area (RSA), aver-age root diameter (ARD), and averaver-age root volume (ARV) were measured in both groups (Control and Experimental Groups) using an Epson Scanner and the WhinRhizo software Package 3.10 version (Regent Instruments Inc. Quebec, Canada). The im-ages were visualized and root data analyzed using the Epson Scanner and the WhinRhizo software. Root traits analyzed were root length (RL), root surface area (RSA), average root diameter (ARD), and average root volume (ARV).
Statistical Analysis
A distribution chart was constructed based on the differ-ences in root trait measurements in (RIL) population. SPSSTM statistical software package was used to evaluate population performance under normal and drought conditions. The evalu-ation was based on mean differences, estimevalu-ation of variance and descriptive comparisons. JMPTM was used to compare the root length (RL), root surface area (RSA), and average root di-ameter (ARD) and average root volume (ARV) under normal and drought conditions. Also, JMPTM statistical software package was used to analyze the correlation between root traits, protein and oil content. Recombinant inbred lines of the parents were also compared along with the RILs evaluation. T-Test and Pear-son correlations were performed to compare the root traits in plants grown in the two conditions and between the root traits and protein and oil contents.
Results and Discussion
Comparison of Root Traits Data
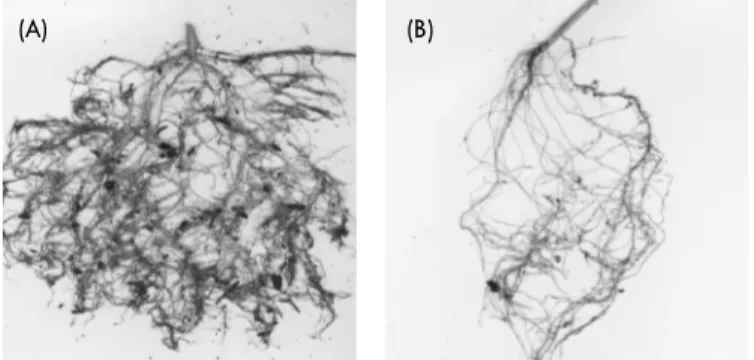
Examples of scanned images of the root system of RIL 2 un-der normal water regime and drought stress are shown in Figure 1. Measurements of root length (RL), root surface area (RSA), average root diameter (ARD), and average root volume (ARV) of ‘MD 96-5722 by ‘Spencer’ recombinant inbred lines root sys-tems under normal (Group I) and drought (Group II) growth con-ditions have been recorded.
For control plants (Group I), the root length (RL) of parents
and RILs ranged from 20.67 cm (RIL 63) to 2,327.88 cm (RIL 2); the root surface area (RSA) parents and RILs ranged from 4.57 cm2 (RIL 41) to 1,176.79 cm2 (RIL 2); the average root diameter
of parents and RILs ranged from 0.38 mm (RIL 80) to 4.04 mm (RIL 43); and the average root volume (ARV) of parents and RILs ranged from 0.08 cm3 (RIL 41) to 47.34 cm3 (RIL 2).
For drought-stressed plants (Group II), the root length (RL) of parents and RILs ranged from 15.70 cm (RIL 80) to 3,562.42 cm (MD, 2,497.9 cm for RIL 87); the root surface area (RSA) par-ents and RILs ranged from 4.15 cm2 (RIL 46) to 829.72 cm2 (MD,
669.62 cm2 for RIL 87); the average root diameter of parents
and RILs ranged from 0.24 mm (RIL 7) to 5.74 mm (RIL 80); and the average root volume (ARV) of parents and RILs ranged from 0.03 cm3 (RIL 46) to 23.67 cm3 (RIL 32).
Our results showed that both RL, RSA, ARD, and ARD have been signiicantly reduced by drought stress which is in agree -ment with several studies reporting the inluence of drought on root traits (Xiong et al., 2006, Pandey and Shukla 2015). For example, Xiong et al. (2006) reported that drought stress re-duced signiicantly lateral root growth in Arabidopsis thaliana as a mechanism of drought adaptation (Xiong et al., 2006). Ga-ray and Wilhelm (1982) studies the effect of drought stress on root traits of two soybean isolines of ‘Harosoy’ (Harosoy normal (HN) and Harosoy dense (HD)) and found that the root systems have been concentrated in the upper 0.15 m of the soil. How-ever, after one month of drought stress, the root systems were denser at 0.90-1.2 m layer of the soil which means that the root system grew deeper into the soil to pump more water and mineral (Garay and Wilhelm, 1982). However, another study reported effect of drought stress on root distribution (Benjamin and Nielsen, 2006).
Statistical Data Analysis
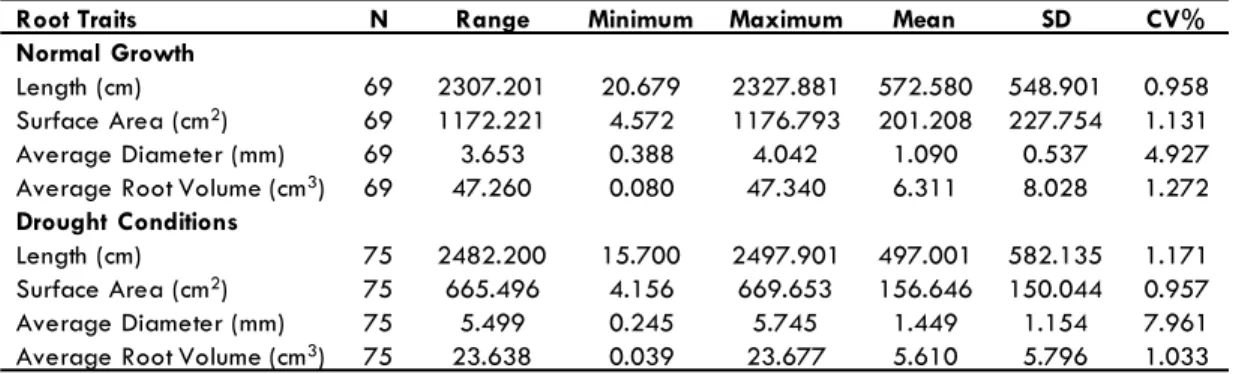
Root traits data for the two groups (Control plants – Group I and Drought Stressed plants – Group II) were analyzed for the mean values, standard deviation, range, and coeficient of variation and the results are shown in Table 1.
In Group I plants (normal water conditions), the mean of the average of root length (RL) was 572.58 cm with a coeficient of variance of (CV) of 0.95; the mean of the average of root sur-face area (RSA) was 201.20 cm2 with a coeficient of variance
of (CV) of 1.13; the mean of the average root diameter (ARD) was 3.96 cm with a coeficient of variance of (CV) of 6.01; and the mean of the average root volume (ARV) was 6.3 cm3 with a coeficient of variance of (CV) of 8.02 (Table 1).
In Group II plants (water stress conditions), the mean of the average of root length (RL) was 537.33 cm with a coeficient of variance of (CV) of 1.25; the mean of the average of root surface area (RSA) was 165.5 cm2 with a coeficient of variance
of (CV) of 1.01; the mean of the average root diameter (ARD) was 1.45 cm with a coeficient of variance of (CV) of 7.89; and the mean of the average root volume (ARV) was 5.6 cm3 with a coeficient of variance of (CV) of 1.03 (Table 1).
It is clear from the results that Group I plants have higher means of root length (RL) [572.58 cm vs. 537.33 cm], root sur-face area (RSA) [201.20 cm2 vs. 165.50 cm2], average root
di-(A) (B)
our
nal of
Biolog
y - ISSN 2158-9151. Published By Atlas Publishing
, LP (www
.atlas-publishing
.org)
ameter (ARD) [3.96 mm vs. 1.45 mm], and average root volume (ARV) [6.31 cm3 vs. 5.61 cm3] compared to Group II plants (Table
1) which demonstrate that drought-stressed plants have reduced overall plant growth and development.
A paired-samples t-Test shown in Table 2 was used to dem-onstrate whether there was a signiicant mean difference of root measurements (RL, RSA, ARD, ARV) between normal and drought growth in ‘MD 96-5722’ by ‘Spencer’ population planted under greenhouse conditions. Levels of root trait measurements for root length elicited a difference of 58.60821 (95% Conidence Inter -val (CI), -167.15727 to 284.37370) cm when comparing normal and drought growth conditions, t (61) = .519, p > .005. The comparison for root surface area (cm2) displayed a difference
of 42.32496 (95% CI, -34.88817 to 119.53809) and a t (61) = 1.096, p > .005. The average root diameter in comparison
showed a difference of -.30523 (95% CI, -.63563 to .02518) mm and t (61) = -1.847, p < .005. Last, when comparing aver-age root volume, the measurements demonstrated a difference of 1.06339 (95% CI, -1.56043 to 3.68721) cm3 with a t (61) = .810, p > .005. There is no signiicant difference between root length, root surface area, and average root volume. However, there was statistical difference between normal and drought growth conditions for average root diameter. A paired statistic test was used to determine the different effects between two experimental conditions for each of the four root traits. In (Table 2), results indicate a decrease for root measurements of length (cm) (529.14 -77.299), surface area (cm2) (167.59- 20.069),
root volume (cm3) (5.66- 0.719), and an increase in average
diameter (1.42-0.140). In normal growth conditions there was a slight increase in measurements in length (587.75-72.141),
Root Traits N Range Minimum Maximum Mean SD CV%
Normal Growth
Length (cm) 69 2307.201 20.679 2327.881 572.580 548.901 0.958
Surface Area (cm2) 69 1172.221 4.572 1176.793 201.208 227.754 1.131
Average Diameter (mm) 69 3.653 0.388 4.042 1.090 0.537 4.927
Average Root Volume (cm3) 69 47.260 0.080 47.340 6.311 8.028 1.272
Drought Conditions
Length (cm) 75 2482.200 15.700 2497.901 497.001 582.135 1.171
Surface Area (cm2) 75 665.496 4.156 669.653 156.646 150.044 0.957
Average Diameter (mm) 75 5.499 0.245 5.745 1.449 1.154 7.961
Average Root Volume (cm3) 75 23.638 0.039 23.677 5.610 5.796 1.033
Table 1. Comparison of root trait measurements of ‘MD 96-5722 by ‘Spencer’ RILs under normal growth conditions and drought. N: Population size (69 plants in group I and 75 plants in groups II survived among 86 planted plants in total).
Root Traits Mean N SD
Pair 1 Length-Normal 587.753 62 568.043
Length-Drought 529.145 62 608.654
Pair 2 Surface Area-Normal 209.915 62 235.000
Surface Area-Drought 167.590 62 158.028
Pair 3 Average Diameter-Normal 1.112 62 .556
Average Diameter-Drought 1.417 62 1.105
Pair 4 Volume-Normal 6.726 62 8.351
Volume-Drought 5.663 62 5.660
Table 2. T-Test showing summary of paired statistics for the two ex-perimental conditions for each of the four root traits listed. For each condition we display the mean, number of participants (N), the stan-dard deviation and stanstan-dard error. N: Population size.
Root Traits N Correlation Significance Level Pair 1 Length (Normal)-Length
(Drought)
62 -.141 .276
Pair 2 Surface Area (Normal) & Surface Area (Drought)
62 -.165 .200
Pair 3 Average Diameter (Normal) & Average Diameter (Drought)
62 -.131 .310
Pair 4 Volume (Normal) & Volume (Drought)
62 -.053 .685
Atlas J
our
nal of
Biolog
y - ISSN 2158-9151. Published By Atlas Publishing
, LP (www
.atlas-publishing
.org)
surface area (209.91-29.845), volume (6.73-1.060) and a decrease in average diameter (1.11-.071). A paired sample correlation test was used to determine the signiicance between the two conditions and the root traits demonstrated no correla-tion between RL, RSA, ARD, and ARV under drought and normal conditions. There is no correlation when compared to parents of RIL (Tables 3 and 4).
In a recent study, Fenta et al. (2014) studied three soybean cultivars: A drought-sensitive (A5409RG), a drought-tolerant (‘Jackson’), and an intermediate drought-tolerant cultivar (‘Prima 2000’). They found that Prima 2000 outperformed the other cultivars under drought stress with the highest grain yield, shoot biomass, and nodules. They also found a positive correlation be-tween nodule size and seed yield and shoot biomass in both con-trol and water stressed plants (Fenta et al., 2014). In general, drought stress is a negative environmental condition affecting soybean production, growth and development (Garay and Wil -helm, 1982; Benjamin and Nielsen, 2006; Du et al., 2009; Fenta et al., 2014). This demonstrates that the carefully chosen root traits can be used to screen for drought tolerance in soybean. Increasing water deicit tolerance (WDT) increases agricultural plant productivity. Since the roots are the main organs for water and minerals uptake, they play a vital role in agricultural plant productivity. Water stress or water deicit (WD) also decreases shoot biomass, leaf cuticular waxes, seed yield, nitrogen ixa -tion, and seed development (Purcell and King, 1996; Serraj et al., 1999; Kim et al., 2007). Root systems are reported to be critical to cope with WD and increase yield. For example, deep and dense roots with high abilities of penetration and branching into the soil help rice plants to be drought tolerant (Pandey and Shukla, 2015).
Correlation Between Root Traits and Seed Protein and Oil Contents
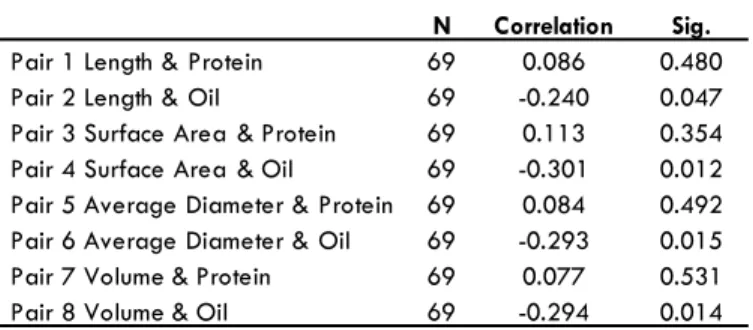
A Pearson correlations test was done between roots traits of Group I (normal) and Group II (drought), protein and oil content as shown in Table 5 and Table 6. The frequency distribution charts for all root traits showed different measurement distri-butions. In Group I plants, a positive correlation was observed between all root traits studied (RL, RSA, ARD, and ARV) and seed protein content while a negative correlation was observed between all these root traits and seed oil content (Table 5). In
Group II plants, a negative correlation was observed between RL, RSA, and ARV and seed protein content while a positive correlation was observed between ARD and protein content. A negative correlation was observed between RL, RSA, and ARV and seed oil content while a positive correlation was observed between ARD and seed oil content (Table 6).
Several studies reported correlations between shoot traits and protein and oil contents in soybean (Johnson et al., 1955; Mansur et al., 1995; SoyBase, 2016); however, studies report-ing correlations between root traits and protein or oil contents are non-existent our knowledge to date.
In conclusion, we have demonstrated that water deicit de -creased RL, RSA, and ARV but not ARD in soybean. It is very im-portant to understand the root architecture and root traits under WD to be able to increase seed yield, seed quality, and crop productivity which will enhance the development of WDT variet
-Root Traits Mean SD Std.
Error Mean
95% Confidence Interval of the
Difference
t df Sig.
Lower Upper
Pair 1 Length (Normal) – Length (Drought)
58.608 889.006 112.903 -167.157 284.373 .519 61 .606
Pair 2 Surface Area (Normal) – Surface Area (Drought)
42.324 304.045 38.613 -34.888 119.538 1.096 61 .277
Pair 3 Average Diameter (Normal) – Average Diameter (Drought)
-.305 1.301 .165 -.635 .025 -1.847 61 .070
Pair 4 Volume (Normal) – Volume (Drought)
1.063 10.331 1.312 -1.560 3.687 .810 61 .421
Table 4. Paired Samples Test. The Pearson correlation between the two conditions, whether the difference between the means of the two conditions was large enough not to result, and last, 95% conidence interval was calculated. Sig.: signiicance level.
N Correlation Sig.
Pair 1 Length & Protein 69 0.086 0.480
Pair 2 Length & Oil 69 -0.240 0.047
Pair 3 Surface Area & Protein 69 0.113 0.354
Pair 4 Surface Area & Oil 69 -0.301 0.012
Pair 5 Average Diameter & Protein 69 0.084 0.492 Pair 6 Average Diameter & Oil 69 -0.293 0.015
Pair 7 Volume & Protein 69 0.077 0.531
Pair 8 Volume & Oil 69 -0.294 0.014
Table 5. The Pearson correlation between root traits from Group I (nor-mal growth), protein and oil content. Sig.: signiicance level.
N Correlation Sig.
Pair 1 Length & Protein 75 -0.225 0.052
Pair 2 Length & Oil 75 0.221 0.057
Pair 3 Surface Area & Protein 75 -0.304 0.008
Pair 4 Surface Area & Oil 75 0.246 0.034
Pair 5 Average Diameter & Protein 75 0.029 0.804 Pair 6 Average Diameter & Oil 75 -0.026 0.827
Pair 7 Volume & Protein 75 -0.233 0.044
Pair 8 Volume & Oil 75 0.148 0.204
our
nal of
Biolog
y - ISSN 2158-9151. Published By Atlas Publishing
, LP (www
.atlas-publishing
.org)
ies and ensure food security.
Acknowledgments
The authors would like to thank the Department of Defense (DOD) for funding this work through the grant# W911NF-11-1-0178 to M.A.K and S.K. We thank Ms. Pam Ratcliff and the rest of the undergrad students’ crew at FSU for taking care of the plants in the greenhouse and ield, and Dr. Nacer Bellaloui at USDA-ARS, Stoneville, MS, for protein and oil analysis.
References
Akond M, S Liu, L Schoener, JA Anderson, SK Kantartzi, K Meksem, Q Song, D Wang, Z Wen, DA Lightfoot, and MA Kassem (2013) A SNP-Based Genetic Linkage Map of Soybean Using the SoyS¬NP6K Il-lumina Ininium BeadChip Genotyping Array. Journal of Plant Ge -nome Sciences 1 (3): 80–89, 2013. doi: 10.5147/jpgs.2013.0090. Bellaloui N, JR Smith, JD Ray, and AM Gillen (2009). Effect of
matu-rity on seed composition in the early soybean production system as measured on near-isogenic soybean lines. Crop Sci. 49: 608–620. doi:10.2135/cropsci2008.04.0192.
Benjamin JG and DC Nielsen (2006) Water deicit effects on root dis -tribution of soybean, ield pea and chickpea. Field Crops Research 97 (2–3): 248–253.
Bing Y, L Xiong, W Xue, Y Xing, L Luo, and C Xu (2005) Genetic analysis for drought resistance of rice at reproductive stage in ield with dif -ferent types of soil. Theor Appl Genet 111: 1127-1136.
Bowers GR (1995) An early soybean production system for drought avoidance. J Prod Agric 8: 112–119.
Chiante D. Iotrio AD, Sciandra S, Scippa GS and Mazzoleni S (2006) Effect of drought and ire on root development in Quercas pubes -cens Willd. And Faxinus ornus L. seedlings. Environmental an Experi -mental Botany. 95: 190-197.
Comas LH, Becker SR, Cruz VM, Byrne PF and Diering DA (2013) Root traits contributing to plant productivity under drought. Frontiers in Plant Science. 4:1-15. Doi:10.3389/fpls.2013.00442
Du W, Wang M, Fu S and Yu D (2009) Mapping QTLs for seed yield and drought susceptibility index in soybean (Glycine max L.) across different environments. Journal of Genetics and Genomics. 36:721-731.
Fenta BA, Beebe SE, Kunert KJ, Burridge JD, Barlow KM, Lynch JP and Foyer CH (2014) Field phenotyping of soybean roots for drought stress tolerance. Agronomy. 4: 418-435.
Flexas J and H Medrano (2002) Drought-inhibition of Photosynthesis in C3 Plants: Stomatal and Non-stomatal Limitations Revisited. Annals of Botany 89 (2): 183–189.
Garay AF and WW Wilhelm (1982) Root System Characteristics of Two Soybean Isolines Undergoing Water Stress Conditions. Agron -omy J 75 (6): 973–977.
Gregory PJ (2006) Plant roots: Growth, Activity and Interaction with Soils. Blackwell Publishing, Oxford, UK.
Johnson HW, HF Robinson, and RE Comstock (1955) Genotypic and Phenotypic Correlations in Soybeans and Their Implications in Selec-tion. Agronomy J. 47: 477–483.
Hossain MM, Lui X, Qi X, Lam HM and Zhang J (2014) Differences between soybean genotypes in physiological response to sequential soil drying and rewetting. The Crop Journal. 2:366-380.
Kadhem FA, JE Sprecht, and JH Williams (1985) Soybean irrigation serially timed during stages Rl to R6 II. Yield component responses. Agron J. 77: 299-304.
Kim KS, Park SH, Kim DK and Jenks MA (2007) Inluence of water deicit on leaf cuticular waxes of soybean (Glycine max (L.) Merr.) Int J Plant Sci. 168:307-316.
Kim MY, Van K, Kang YJ, Kim KH and Lee SH (2012) Tracing soybean domestication history: from nucleotide to genome. Breeding Science. 61: 445-452.
Kinney AJ and TE Clemente (2005) Modifying soybean oil for enhanced performance in biodiesel blends. Fuel Processing Technology 86 (10): 1137–1147.
Kramer, Paul J and Boyer, John S (1995) Water relations of plants and soil. Academic Press Inc. Retrieved: http://udspace.udel.edu/ handle/19716/2830.
Liu F, CR Jensen, MN Andersen (2004) Drought stress effect on car-bohydrate concentration in soybean leaves and pods during early reproductive development: its implication in altering pod set. Field Crops Research 86 (1): 1–13.
Mansur LM, JH Orf, K Chase, T Jarvik, PB Cregan, and KG Lark (1995) Genetic Mapping of Agronomic Traits Using Recombinant Inbred Lines of Soybean. Crop Sci 36 (5): 1327–1336.
Mastrodomenico AT, Purcell LC and King CA (2013) The response and recovery of nitrogen ixation activity in soybean to water dei -cit at different reproductive developmental stage environmental and Experimental Botany. 85:16-21.
Miller G, N Suzuki, SC Ciftci-Yilmaz, and R Miller (2010) Reactive oxy-gen species homeostasis and signalling during drought and salinity stresses. Plant, Cell, & Environment 33 (4): 453–467.
NCSUCE: North Carolina State University Cooperative Extension (2015) https://soybeans.ces.ncsu.edu/. Last accessed Oct. 7, 2015. Nunberg A, JA Bedell, MA Budiman, RW Citek, SW Clifton, L Fulton, D
Pape, Z Cai, T Joshi, HT Nguyen, D Xu, and G Stacey (2006). Survey sequencing of soybean elucidates the genome structure and compo-sition. Functional Plant Biology 33: 1-9.
Ouertani K, E Washington, P Lage, SK Kantartzi, DA Lightfoot, and MA Kassem (2011) Comparison of Early and Conventional Soybean Pro-duction Systems for Yield and other Agronomic Traits. Atlas Journal of Plant Biology 1 (1): 1–5.
Pandey RK, WAT Herrera, and JW Pendleton (1984) Drought response of grain legumes under irrigation gradient. III. Plant growth. Agron. J. 76: 557–560.
Pandey V and Shukla A (2015) Acclimation and tolerance strategies of rice under drought stress. Rice Science. 22(4):147-161. Purcell LC and CA King (1996) Drought and nitrogen source effects on
nitrogen nutrition, seed growth, and yield in soybean. J Plant Nutr 19 (6): 969–993.
Reddy AR, KV Chaitanya, M Vivekanandan (2004) Drought-induced responses of photosynthesis and antioxidant metabolism in higher plants. Journal of Plant Physiology 161 (11): 1189–1202.
Reubens B, Poesen J, Danjon F, Geudens G and Muys B (2007) The role of ine and coarse roots shallow slope stability and soil erosion control with a focus on root system architecture: A review. Trees 21: 385–402.
Rosenthal A, DL Pyle, K Niranjan, S Gilmour, and L Trinca (2001) Com-bined effect of operational variables and enzyme activity on aque-ous enzymatic extraction of oil and protein from soybean. Enzyme and Microbial Technology, 28 (6): 499–509.
Sacks FM, Lichtenstein A, Van Horn L, Harris W, Kris-etherthon P and Winston M (2006) Soy protein, isolavones, and cardiovascular health. Circulation. 113: 1034-1044.
Serraj R, TR Sinclair, and LC Purcell (1999) Symbiotic N2 ixation re -sponse to drought. J Exp Botany 50 (331): 143–155.
Atlas J
our
nal of
Biolog
y - ISSN 2158-9151. Published By Atlas Publishing
, LP (www
.atlas-publishing
.org)
C): 1574–1579.
Taylor RS, DB Weaver, CW Wood, and EV Stanten (2005) Nitrogen application increases yield and early dry matter accumulation in late-planted soybean. Crop Sci 45: 854–858.
USDA (2015) National Agriculture Service: https://www.nass.usda. gov/.
Westgate ME and JS Boyer (1985) Osmotic adjustment and the inhibi
-tion of leaf, root, stem and silk growth at low water potentials in maize. Planta 164 (4): 540–549.