www.ann-geophys.net/26/2685/2008/ © European Geosciences Union 2008
Annales
Geophysicae
High-latitude plasma convection during Northward IMF as derived
from in-situ magnetospheric Cluster EDI measurements
M. F¨orster1, S. E. Haaland2,*, G. Paschmann2, J. M. Quinn3, R. B. Torbert4, H. Vaith4, and C. A. Kletzing5 1Helmholtz-Zentrum Potsdam, GeoForschungsZentrum (GFZ), 14473 Potsdam, Germany
2Max-Planck-Institut f¨ur extraterrestrische Physik, 85748 Garching, Germany 3Boston University, Boston, MA 02215, USA
4University of New Hampshire, Durham, NH 03824, USA 5University of Iowa, Iowa City, IA 52242, USA
*also at: Department of Physics, University of Bergen, Norway
Received: 2 April 2008 – Revised: 5 August 2008 – Accepted: 5 August 2008 – Published: 12 September 2008
Abstract. In this study, we investigate statistical, system-atic variations of the high-latitude convection cell structure during northward IMF. Using 1-min-averages of Cluster/EDI electron drift observations above the Northern and Southern polar cap areas for six and a half years (February 2001 till July 2007), and mapping the spatially distributed measure-ments to a common reference plane at ionospheric level in a magnetic latitude/MLT grid, we obtained regular drift pat-terns according to the various IMF conditions. We focus on the particular conditions during northward IMF, where lobe cells at magnetic latitudes >80◦ with opposite
(sun-ward) convection over the central polar cap are a permanent feature in addition to the main convection cells at lower lat-itudes. They are due to reconnection processes at the mag-netopause boundary poleward of the cusp regions. Mapped EDI data have a particular good coverage within the central part of the polar cap, so that these patterns and their depen-dence on various solar wind conditions are well verified in a statistical sense. On average, 4-cell convection pattern are shown as regular structures during periods of nearly north-ward IMF with the tendency of a small shift tonorth-ward negative clock angles. The positions of these high-latitude convec-tion foci are within 79◦to 85◦magnetic latitude and 09:00– 15:00 MLT. The MLT positions are approximately symmet-ric±2 h about 11:30 MLT, i.e. slightly offset from midday toward prenoon hours, while the maximum (minimum) po-tential of the high-latitude cells is at higher magnetic lati-tudes near their maximum potential difference at≈−10◦to
−15◦ clock angle for the North (South) Hemisphere. With increasing clock angle distances from≈IMFBz+, a gradual transition occurs from the 4-cell pattern via a 3-cell to the
Correspondence to: M. F¨orster
(mfo@gfz-potsdam.de)
common 2-cell convection pattern, in the course of which one of the medium-scale high-latitude dayside cells dimin-ishes and disappears while the other intensifies and merges with the opposite main cell of the same polarity to form the large “round-shaped” convection cell when approaching a well-known IMFBy-dominated configuration. Opposite sce-narios with interchanged roles of the respective cells occur for the opposite turning of the clock angle and at the Southern Hemisphere. The high-latitude dayside cells become more pronounced with increasing magnitude of the IMF vector. Keywords. Magnetospheric physics (Magnetospheric con-figuration and dynamics; Plasma convection; Solar wind-magnetosphere interactions)
1 Introduction
structure in the flows superimposed upon the weakened and contracted two-cell pattern (Cowley, 1983).
There was a controversy about the nature of so-called “re-verse convection” (i.e. sunward directed flow) at high lati-tudes during periods of predominantly northward IMF. Vari-ous observations of different kinds using, e.g. ground-based magnetometer sets and satellite measurements, led to differ-ent conclusions about the question whether the observed sun-ward flow during northsun-ward IMF has to be interpreted as dis-tortions of the conventional 2-cell pattern, as particular forms of 3-cell structures or as a pair of reverse cells at high mag-netic latitudes. Burke et al. (1979) suggested that 4-cell con-vection pattern can exist when the IMF is northward. Cowley (1983) came up with a pictorial catalogue of physically pos-sible magnetic topologies for northward IMF.
The influence of the IMFBycomponent as being respon-sible for 3-cell convection pattern was discussed by Potemra et al. (1984) and Reiff and Burch (1985). They showed that as the IMFBymagnitude increases, one of the “reverse cells” at high latitudes will grow, while the other cell will contract. When the IMFBy component becomes strong enough, only one reverse cell will exist and it then dominates the polar cap. Recently, Vennerstrom et al. (2002, 2005) presented new observational material and a global MHD simulation of the solar wind and magnetosphere interaction during north-ward IMF that elucidates the reconnection geometry under such particular conditions.
The plasma convection under various IMF conditions has been intensively studied with ground-based instruments, in recent years in particular by use of the continually evolving SuperDARN network (Greenwald et al., 1995a). An early contribution of this radar network was the publication of the first direct two-dimensional observations of polar cap con-vection under northward IMF by Greenwald et al. (1995b). With an advanced method of deriving large-scale convec-tion maps from the line-of-sight velocity measurements of the comprehensive network, as desribed by Ruohoniemi and Baker (1998), global convection pattern could be imaged nearly instantaneously (∼1–2 min). At the same time, the heavily growing data bases of extensive observational ma-terial allowed the advent of sophisticated statistical models of the global magnetospheric convection under various so-lar wind and IMF conditions (Papitashvili and Rich, 2002; Ruohoniemi and Greenwald, 2005; Weimer, 2005).
New simultaneous observations by radars and satellites were analysed in recent studies, which have specifically in-vestigated the flux transport during northward IMF. Sandholt et al. (2000) have documented the association between the dynamic cusp aurora and pulsed high-latitude “reverse two-cell” convection in the northern winter hemisphere during strongly northward IMF. The observations are explained in terms of a scenario of sequential capture of magnetosheath plasma by the magnetosphere via high-latitude reconnection in both hemispheres (Sandholt et al., 2000). Intervals of northward, butBy-dominated IMF, have been studied, e.g.
by Grocott et al. (2004, 2007). They report highly asymmet-ric “Dungey-cycle” main twin-vortex convection, with bursts of fast azimuthal flow in the midnight sector, during intervals of modest flux closure. They suggest that dayside reconnec-tion equatorward of the cusp persists during such intervals of intermediate IMF clock angle (in addition to high-latitude re-connection), and that this drives a moderate convection cycle which is not sufficient to trigger magnetospheric substorms. Milan et al. (2005) coined the term “tail reconnection dur-ing IMF-northward, non-substorm intervals” (TRINNIs) to describe this phenomenon.
Electron Drift Instrument (EDI) measurements onboard the Cluster satellites have been used for many aspects of near-Earth plasma convection in various prior studies of dif-ferent kind as, e.g., the analysis of the transpolar plasma con-vection by Vaith et al. (2004). Statistical studies of EDI ob-servations of the magnetospheric convection in various pro-jections have been performed, e.g., by Matsui et al. (2004, 2005) aiming on the deduction of an electric field model for the inner magnetosphere, and by Noda et al. (2003) and in the study of Haaland et al. (2008), published in this special issue, on plasma convection in the magnetotail lobes.
The EDI data set used in the latter and in this present study is similar, though more extended, to the data set used in two correlated recent statistical studies on drift EDI ob-servations of Haaland et al. (2007) and F¨orster et al. (2007). They concerned the high latitude convection pattern and its dependence on the IMF (Haaland et al., 2007) as well as their correlation with solar wind and IMF parameters and the variances of the drift pattern in the two hemispheres (F¨orster et al., 2007).
In this study, we focus on convection patterns close to northward IMF with its typical 4-cell structure which distegrate to 3-cell and the well-known 2-cell structures with in-creasing deviation of the IMF clock angle from purely north-ward. For this task, the paper is organized as follows: In Sect. 2 we present the EDI and the ACE data set used for sorting and mapping the drift vector data. In Sect. 3 we de-scribe the various parts of the data processing that result in the drift potential pattern for concurrent IMF and solar wind conditions. The gradual changes with the IMF clock angle are shown in Sect. 4 and their characteristics are discussed in Sect. 5. Section 6 summarizes and concludes the paper.
2 The data set
2.1 Cluster EDI data
The Cluster mission of the European Space Agency (ESA) consists of four identical spacecraft that are flying in a tetra-hedron like formation on adjacent 4RE×19REelliptical or-bits with nearly 90◦inclination and orbital periods of about
57 h. The Cluster spacecrafts are equipped with a compre-hensive set of plasma particle and field devices (for more details see Escoubet et al., 1997), some of them allow de-ductions about the plasma drift (convection) along the space-craft’s orbit. Direct plasma drift (or electric field) mea-surements are performed with the Cluster Ions Spectrome-ter (CIS) (R`eme et al., 2001), the Electric Field and Wave Experiment (EFW) (Gustafsson et al., 2001), and the EDI instrument (Paschmann et al., 1997, 2001).
For this study, we solely make use of plasma drift mea-surements obtained with the EDI instrument. EDI measures the full vector of the drift velocity perpendicular to the lo-cal magnetic field (i.e. the transverse electric field), based on a sophisticated electron-drift technique with two weak elec-tron beams ejected on opposite sides of the spacecraft and detected after one or more gyrations in the ambient magnetic field when fired in specific directions. Those directions are uniquely determined by both the magnetic field and plasma drift magnitude and direction, assuming that the drift due to magnetic field gradients can be neglected. The drift veloc-ity is then estimated either from the direction of the beam via simple triangulation or from their differences in times-of-flight (for more details see Paschmann et al., 1997, 2001; Quinn et al., 2001).
In this study we use exclusively EDI measurements that have been classified as “good” on a trivalent scale (good/caution/bad) in the standard data processing. This quality assignment considers margins of errors of some cru-cial parameters, where the tolerance assumptions for “good” data is at a level that guaranties well-defined drift measure-ments. As in the previous studies of Haaland et al. (2007) and F¨orster et al. (2007), we then use 1-min averages of EDI measurements obtained at radial distances between 4REand 15RE for the mapping of the drift vectors into the iono-sphere assuming equipotential conditions along the geomag-netic field lines that are modeled with the Tsyganenko-2001 magnetic field model (Tsyganenko, 2002a,b). The mapped drift vectors are then binned in a high-latitude concentric grid in magnetic coordinates with characteristic bin sizes of 2×2 degrees.
EDI measurements are available for Cluster-1 and -3 throughout the whole time interval from February 2001 till July 2007, and until April 2004 for Cluster-2; EDI was not operational on Cluster-4 during the whole interval. Some op-erational constraints limit the availability of EDI data. EDI as an active instrument causes some interference with the wave measurements on Cluster in particular in low magnetic field environments. The instrument worked therefore in a duty-cycle that has been negotiated with the other experimentators
of Cluster. Other limitations of data coverage were caused by limited data transfer rates in the first phase of the operational regime, and some data gaps due to temporary failures.
Nevertheless, the data set used in this study for the 78 months (or≈57 000 h) interval of measurements within solar cycle 23 comprise almost 10 millions individual “good” measurement points within the region of data collection inside the magnetosphere. They are assembled in about 17 620 h of 1-min averages, of which about 7400 h (≈42%) are finally used for the data interpretation due to various fil-terings (see below). The full data set consists of about 44% Cluster-1, 17% Cluster-2, and 39% Cluster-3 EDI observa-tions.
2.2 ACE solar wind and IMF data
Measurements of the solar wind plasma parameters and the interplanetary magnetic field are obtained from the Ad-vanced Composition Explorer (ACE) spacecraft orbiting about the Earth-sun L1 liberation point at a sunward distance from Earth of about 235RE. We have used magnetic data from the ACE magnetic field instrument MAG (Smith et al., 1998) at 16 s resolution and from the solar wind instrument SWEPAM (McComas et al., 1998) at 64 s resolution. MAG and SWEPAM data are re-sampled to one minute time res-olution, thereafter time shifted to represent the IMF condi-tions at the front side magnetopause (assumed to be located atXGSE=10RE).
We took much care to determine correct propagation delay times of the solar wind and IMF observations of ACE from its sunward outpost to their effectual domain at the magne-topause to compile reliable sets of concurrent IMF condi-tions. This procedure is described in detail in Haaland et al. (2007) and it will be only briefly recapitulated here. This method applies the so-called phase front propagation tech-nique proposed by Weimer et al. (2003) in the modification of the constrained minimum variance calculation MVAB-0 of Haaland et al. (2006). Some refinement of this technique was recently presented by Weimer and King (2008) and it is also thoroughly discussed in this issue by Mailyan et al. (2008).
By+ IMF Bz+ (a) clock angle = -90.0o
By+ IMF Bz+ (b) clock angle = -30.0o
By+ IMF Bz+ (c) clock angle = -20.0o
By+ IMF Bz+ (d) clock angle = -10.0o
By+ IMF Bz+ (e) clock angle = 0.0o
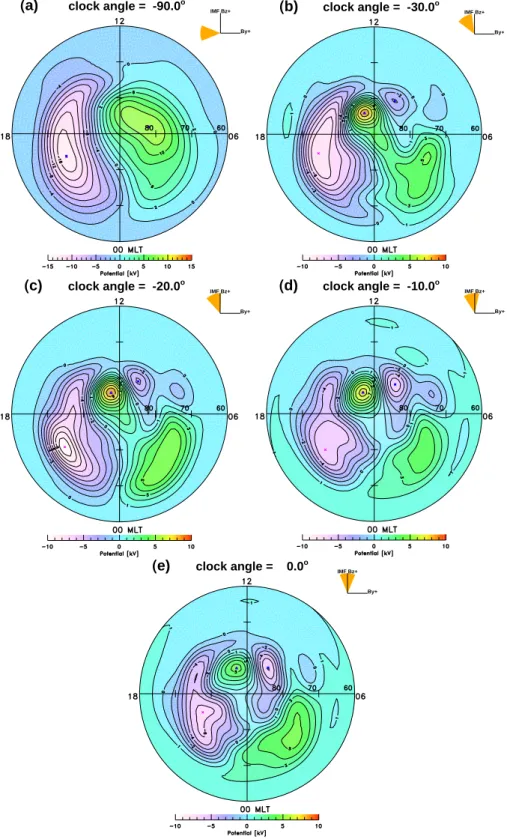
Fig. 1. Potential patterns of the Northern Hemisphere for a series of clock angle positions close to northward IMF. The running clock angle
sector is indicated in the upper right corner of each panel with the orange sector in theByz-plane. The individual panels within magnetic
latitude/MLT circles with an outer border at 60◦show the development of the 4-cell-potential pattern for purely northward IMF in panel (e), continuing with increasing (decreasing) clock angles in the positions±10◦(f, d),±20◦(g, c),±30◦(h, b) to the 2-cell-potential patterns
in the panels (i) and (a), respectively, with IMFBy+(IMFBy−) orientations (±90◦clock angle). The potentials are color-coded according
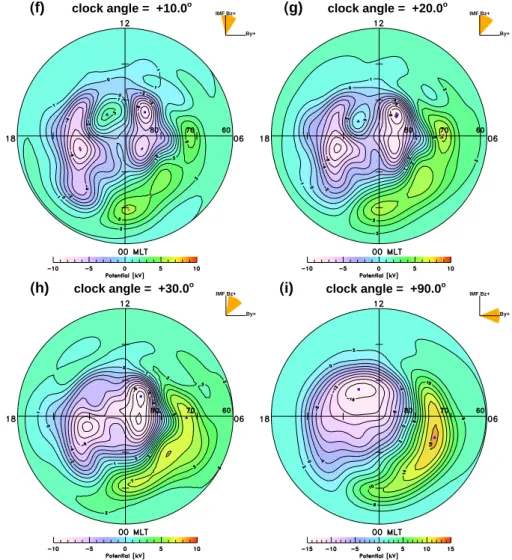
By+ IMF Bz+ (f) clock angle = +10.0o
By+ IMF Bz+ (g) clock angle = +20.0o
By+ IMF Bz+ (h) clock angle = +30.0o
By+ IMF Bz+ (i) clock angle = +90.0o
Fig. 1. Continued.
these intervals as well. The data coverage of ACE observa-tions is about 80%.
3 Data processing
We are investigating the IMF dependence of the high-latitude plasma convection, in particular for northward IMF, by sort-ing the data with respect to the IMF clock angle θ. It is defined as the angle between the GSM z-axis and the IMF magnetic field vector in the GSM y-z-plane with positive clock angle values for positive IMFBy+. For our statisti-cal analysis, we are using clock angle sector intervals that are 45◦wide. The central angle of the sector interval defines the IMF clock angle for the detailed analysis in the subse-quent sections. The sector width is the same as used in the studies of Haaland et al. (2007) and F¨orster et al. (2007). Instead of their 8 discrete IMF clock angle sectors, we will
look at varying clock angle dependencies by scanning a cer-tain range continuously with the 45◦-wide opening.
Using the phase front technique and propagating the ob-servations of the ACE monitor with the carefully determined delay times to the magnetopause, we have a properly defined solar wind and IMF data set at our disposal, which serves in a two-fold manner in the further processing.
thus formed of∼30 individual Bi/|Bi| vectors. The inter-val starts 20 min before and ends 10 min after the time of an EDI measurement. The angle between the bias vector and the GSM z-axis defines the clock angle, and its magnitude, the “bias value”, is a measure of the stability of that clock angle. If the IMF direction were perfectly stable, the bias vector would have unit length. Any variation in direction be-tween the individual Bivectors leads to a bias value less than unity; the larger the spread, the smaller the bias value. In the most extreme case it could reach a bias value of zero. A lin-ear variation of the IMF clock angle of approximately±27◦ within the chosen interval gives a bias value of 0.96 that were selected for this study as already in the previous studies of Haaland et al. (2007) and F¨orster et al. (2007). It is com-parable to the sector interval widths of 45◦ used here, i.e., the allowed variations of clock angle for the 30-min intervals are approximately confined to the sector width considered. Time periods with bias values below this threshold are con-sidered therefore as “unstable”, and are excluded from this study. This threshold gives a reasonable stability filtering, but still leaves enough data records for the statistics (about 42% of the whole data set). The IMF sorting later in this study, however, and focussing on a limited northward clock angle sector, reduce the data coverage to a certain degree due to the uneven distribution of IMF clock angle being best for IMF vectors in the ecliptic plane along the Parker spiral (cf. e.g. Haaland et al., 2007, Fig. 1).
The asymmetric 30-min time interval takes on the one hand any uncertainty in the solar wind propagation into ac-count and allows on the other hand an additional period of a few minutes that is needed to set up the convection. Accord-ing to, e.g., Ridley et al. (1998) this takes about 10 min.
Secondly, the propagated ACE data are used as input parameters for the Tsyganenko-2001 magnetic field model (Tsyganenko, 2002a,b) which is required for the mapping of the spatially distributed EDI measurements to a common ref-erence plane at ionospheric level. The model requires also more elaborate inputs as the G1 and G2 factors, which are based on the preceding 1 h history of the solar wind. If there is a gap within this period, the G1 and G2 factors are simply based on fewer samples. In the extreme case where the full preceding hour of data is missing, the G1 and G2 factors are both set to zero. A further input parameter needed is the Dst (Disturbed Storm Time) index, which is provided as hourly averages by the World Data Center A (WDCA), at Kyoto University, Japan. The Dst index has been also re-sampled and interpolated to the 1-min time tags of the Cluster EDI data.
We map the EDI drift vectors to an altitude level of 400 km in high magnetic latitudes>58◦of both hemispheres; a de-tailed description of the mapping can be found in Haaland et al. (2007, Sect. 3.3). EDI drift measurements above the Solar Magnetospheric (SM) equatorial plane are mapped to the Northern Hemisphere, the others to the Southern. To avoid contamination from measurements obtained outside
the magnetopause, only measurements at least 2RE earth-ward (along the Earth-spacecraft line) of the Shue et al. (1997) model magnetopause are retained.
4 Observations
We used the large data set of 6.5 years EDI observations to study the statistical potential pattern under northward IMF conditions in more detail. Figure 1 shows nine snapshots (a–i) of the Northern Hemisphere polar cap potential distri-bution. They represent several typical patterns of a scanning through a certain clock angle range close to northward IMF with a 45◦-wide sector window. The sector width chosen is a compromise between a sufficiently good resolution of the physical effects on the one side and the necessary data cov-erage to deduce reliable potential patterns on the other. We tested different, in particular smaller, sector widths in combi-nation with various step widths, to minimize the data overlap of neighbouring panels. The choice of smaller sectors leads to a poorer coverage of the individual polar cap panels and therefore to an increased uncertainty or larger variability of the deduced potential values and the foci’s positions, while the results are in principle the same.
The different panels show the gradual change of the 4-cell pattern from a strictly northward directed IMF in Fig. 1e both toward larger and smaller clock angles in steps of 10◦for the panels (b) to (h), while the first (a) and the final pattern (i) show the situations when pure IMFBy orientations (±90◦ clock angle) are achieved with clear two-cell structures. The color scale at the bottom of each panel indicates the potential range; please note that the scales of the first and last panel are extended by 50%.
The 4-cell pattern in Fig. 1e consists of the two large cells at lower latitudes with antisunward convection between them, the negative and positive foci of which are located be-tween 70◦ to 75◦ at the dusk and dawn side, respectively, where the dawnside cell is more extended toward the night-side up to the midnight meridian and even beyond. The less extended dayside pair of convection cells at much higher magnetic latitudes>80◦shows the opposite polarity, i.e. the convection between them is sunward directed. Their (oppo-site) potential values are comparable with each other and the potential difference of the two pairs has also about the same magnitude.
By+ IMF Bz+ (a) clock angle = -90.0o
By+ IMF Bz+ (b) clock angle = -30.0o
By+ IMF Bz+ (c) clock angle = -20.0o
By+ IMF Bz+ (d) clock angle = -10.0o
By+ IMF Bz+ (e) clock angle = 0.0o
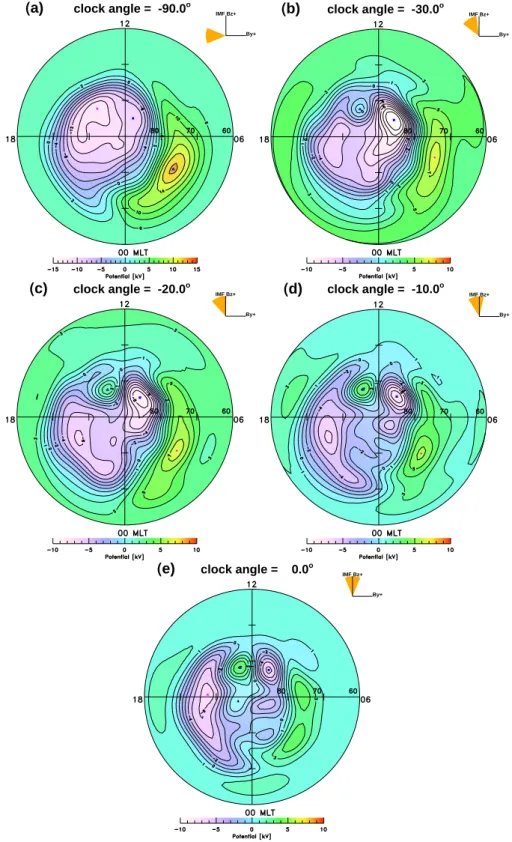
Fig. 2. High-latitude potential patterns for the same clock angle values as in Fig. 1, but for the Southern Hemisphere. The potential
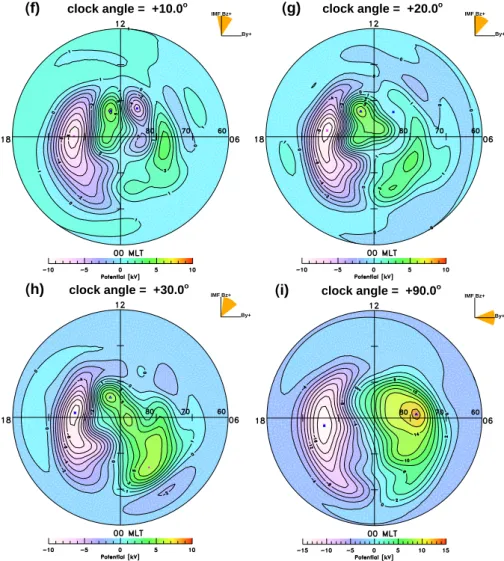
By+ IMF Bz+ (f) clock angle = +10.0o
By+ IMF Bz+ (g) clock angle = +20.0o
By+ IMF Bz+ (h) clock angle = +30.0o
By+ IMF Bz+ (i) clock angle = +90.0o
Fig. 2. Continued.
positive peak at the dawnside lower latitudes and two neg-ative peaks, one at high prenoon dayside latitudes and one at the duskside (cf. Fig. 1h). The latter finally combines to a larger common “round-shaped” cell at the duskside as shown in panel (i) and a “crescent-shaped” dawn cell, as it is known from numerous studies of IMFBydependencies with ground-based instruments (as, e.g. Ruohoniemi and Green-wald, 2005, for SuperDARN observations) or low-Earth or-biting satellites (e.g. Rich and Hairston, 1994; Papitashvili and Rich, 2002; Weimer, 2005).
The development toward negative clock angles in pan-els (e) to (a) of Fig. 1 shows a similar behaviour, but with switched roles of the two cell pairs. Here, the positive high-latitude minor cell at the dayside afternoon becomes domi-nant already in panel (d) and starts slowly to combine with the larger dawn cell in panels (c–b). The largest potential difference during this interval (panels d-b) does not form between the low- or high-latitude cell pairs, but rather
be-tween the high-latitude afternoon dayside cell and the low-latitude main dusk cell (see also Fig. 4 below). The negative high-latitude dayside prenoon cell disappears only at≈−35◦ clock angle (not shown here, but cf. Figs. 3 and 4 below) and the complete merging of the high-latitude dayside afternoon cell with the low-latitude main cell at dawn is also shifted to larger absolute clock angles. The transition from the 4-cell to the usual 2-cell convection pattern is therefore not symmetric with respect to purely northward IMF (0◦clock angle), but
rather more extended toward negative clock angles in com-parison with the positive half.
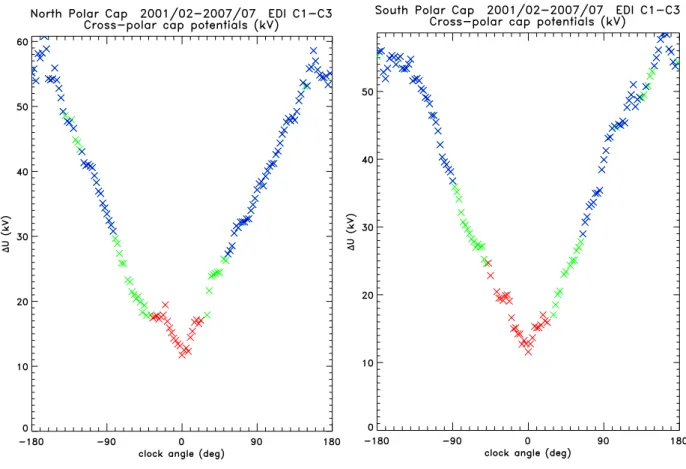
Fig. 3. Cross-polar cap potential differences between the largest extrema values of the potential distribution versus clock angle, independent
of any substructure. The color-coding of the individual data points with a spacing of 2.5◦stand for the actual potential structure; the red crosses indicate a 4-cell pattern, the green ones for 3-cell pattern, and the blue crosses for most parts of the interval show the main 2-cell pattern at lower latitudes. The potential differences have been derived from the extrema values of potential plots that were filtered with a running IMF clock angle sector window of±22.5◦width. North (left panel) and South Hemisphere (right) are treated separately.
angles, the positive high-latitude dusk cell starts to dominate in panel (f) the dayside cell pair, forming a “bridge” to the dawnside low latitude cell in panels (g–h) while the negative dawnside high latitude cell disappears (panel h). Finally, the two cells with positive polarity are merged in panel (i), form-ing a “round-shaped” larger mornform-ing cell and a “crescent-shaped” dusk cell, though the diameter of the dawn cell is not that large as the dusk cell in Fig. 1i and the whole pat-tern is less counter-clockwise rotated than the patpat-tern of the opposite Hemisphere with its clockwise rotation.
Stepping through the potential patterns from purely IMFBz+through to purely IMFBy−in the Southern Hemi-sphere (panels e to a of Fig. 2) you see a quite similar de-velopment as when stepping through from purely IMFBz+ through to purely IMFBy+in the Northern Hemisphere (pan-els e to i of Fig. 1).
Figure 3 gives an overview about the “cross-polar” po-tential between the two largest extrema values of the pat-tern drawn versus clock angle with a 2.5◦spacing for both North (left) and South Hemisphere (right panel). The colors
of the crosses of the individual potential values indicate the character of the pattern as 4-cell (indicated as red crosses), 3-cell (green crosses), or the main 2-cell (blue crosses) pat-tern for most parts of the clock angle interval. The minimum of these curves are close to 0◦ clock angle for both
hemi-spheres, while the maximum seems to have a slight offset of ≈20◦from the purely southward directed IMF at±180◦.
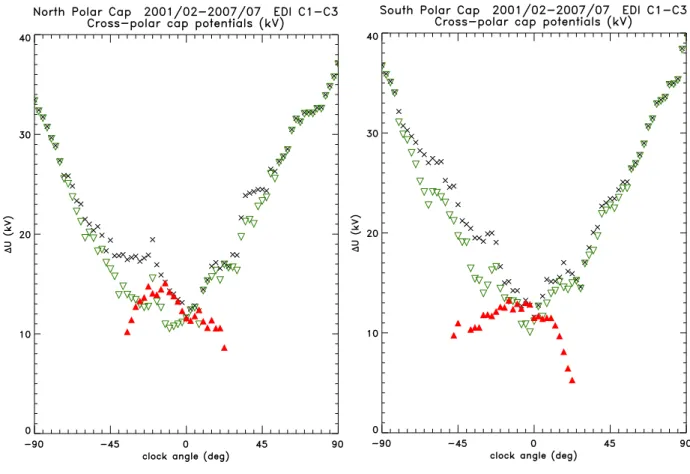
Fig. 4. Pair-wise potential differences are shown versus clock angle in the limited range between±90◦for both the high-latitude dayside convection cells in red (full upward directed triangles) and the two large dawn-dusk cells at lower latitudes (green, downward directed triangles). Black crosses in between show the largest potential difference for that particular moment as already shown with the curves of Fig. 3. The data set is the same as in the previous figures, separated for North (left) and South Hemisphere (right).
in particular in the range of negative clock angles between about−20◦to−45◦at both hemispheres.
Within the clock angle range of two coexisting cell pairs (from≈+25◦to−35◦clock angle), the potential difference
of the high-latitude dayside cell pair is comparable to the po-tential difference of the main cells at lower latitudes (here, of the order of 10 kV up to 15 kV). The persistence of the high-latitude dayside cell pair is slightly offset from 0◦clock angle by about 10–15◦toward negative clock angle values. The minimum values of the main cell’s potential difference seem to be closer to 0◦ clock angle, though the slope of change of the potential difference is slightly larger toward positive clock angles than toward the negative ones (cf. also Fig. 3). This behaviour appears to be clearer at the Northern Hemisphere (left panel of Fig. 4) compared with the South-ern (right panel).
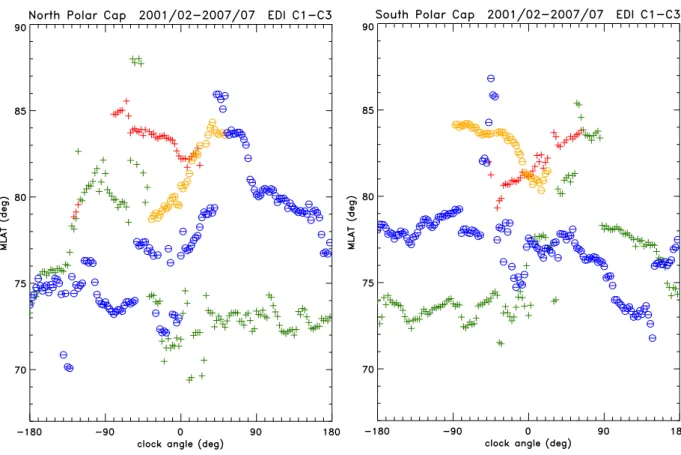
Figures 5 and 6 show the positions of the convection cell’s foci in magnetic latitude and magnetic local time (MLT), re-spectively, versus clock angle. All types of convection pat-tern are represented, i.e. the 4-cell patpat-tern during those clock angle intervals, where the high-latitude potential foci
(indi-cated with red “plus” signs and orange encircled “minus” signs for positive and negative peaks, respectively) coexist with the low-latitude green “plus” and blue “minus” signs for the maxima and minima of the main cells, respectively. 3-cell intervals are manifest during periods, where either a high-latitude maximum (red “plus”) or minimum (orange “mi-nus”) coexist with the two main cells and the 2-cell standard pattern during the rest of the interval. The spacing of the data points is 2.5◦as in the previous Figs. 3 and 4.
The variation of the foci’s positions versus clock angle during most of the interval proves to be continuous and regu-lar, which is more obvious for the MLT dependency (Fig. 6) than for the change with respect to magnetic latitude (Fig. 5). North and South Hemisphere, i.e. the left and right panels of Figs. 5 and 6, respectively, are mostly mirror-symmetric with respect to clock angle. Exceptions concern the apparent shift of the 4-cell pattern toward more negative clock angles as mentioned above and minor differences in the positions of the main cells.
Fig. 5. Magnetic latitude positions of the potential foci versus clock angle for both pairs of convection cells: red crosses and orange encircled
“minus” dashes for the positive and negative potential extrema of the high-latitude dayside convection cells, respectively, while green crosses and blue encircled “minus” dashes stand for the maximum and minimum of the larger cell pair at lower latitudes on the dawn and dusk side, respectively.
magnetic latitude, while their local time range extend from 09:00–15:00 MLT. During the maximum potential difference of the dayside high-latitude cells at≈−10◦ to−15◦ clock angle, the maximum (minimum) is at higher magnetic lati-tudes for the North (South) Hemisphere while the MLT po-sition is approximately symmetric±2 hrs about 11:30 MLT, i.e. slightly offset from midday toward prenoon hours.
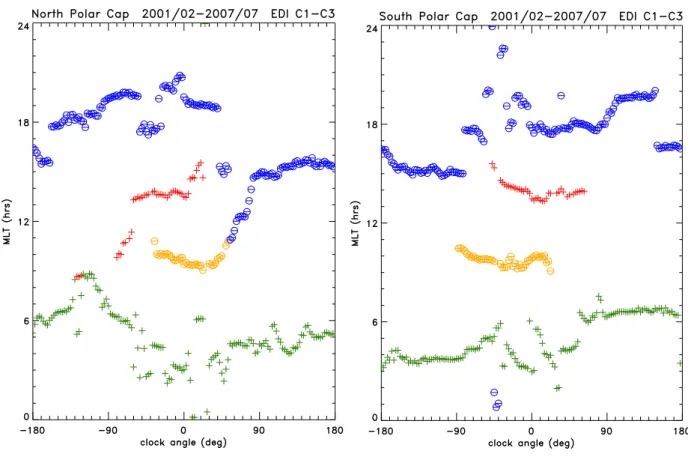
The MLT positions of the main cell’s foci also show a trend, first mentioned by Ruohoniemi and Greenwald (2005) and noticed also by Haaland et al. (2007) in their Figs. 7 and 8, namely a counter-clockwise (clockwise) rotation of the line joining the cell-centers with increasing clock angles at the North (South) Hemisphere. At the North Hemisphere, the main dusk cell with the negative polarity starts after merging with the high-latitude dayside morning cell for a clock angle of≈25◦at about 12:00 MLT and moves counter-clockwise to about 16:00 MLT for±180◦clock angle to∼20:00 MLT for −45◦ clock angle, when the 4-cell pattern re-appears. The positive main dawn cell moves at the same time from ∼04:00 MLT to about 09:00 MLT when approaching −90◦ clock angle, splitting then into the high-latitude afternoon and the persisting main dawn cell at lower latitudes. The
same scenario, but in the opposite direction of clock angle change, occurs at the Southern Hemisphere.
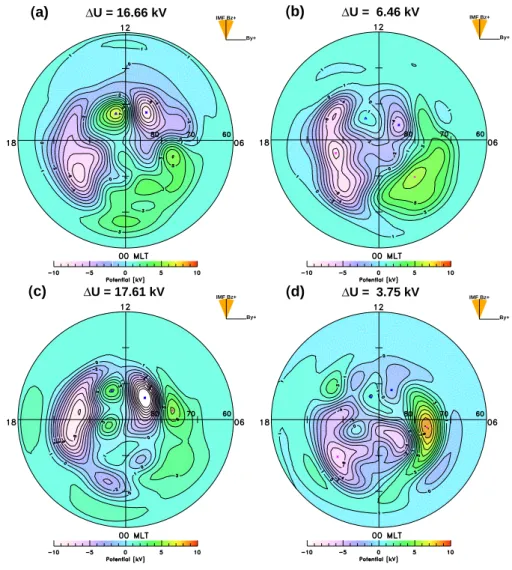
Figure 7 shows finally the dependence of the strength of the high-latitude dayside convection cells on the magnitude of the IMF. To show this, the data set was split again, sep-arating all data points with IMF|B|≥5 nT in the left panels (Fig. 7a and c for the North and South Hemisphere, respec-tively) from those with IMF|B|<5 nT (right panels b and d). All four potential pattern are drawn for purely northward IMFBz+.
Fig. 6. This plot shows the potential foci position versus clock angle with respect to the magnetic local time (MLT) with the same color
coding as in Fig. 5: red crosses and orange encircled “minus” dashes stand for the maximum/minimum of the high-latitude dayside pair of convection cells, and green crosses and blue dashes for the larger dawn-dusk cell pair, respectively.
5 Discussion
In this study, we are interested in the behaviour of magneto-spheric convection for periods of predominantly northward directed IMF. During such periods the 2-cell convection pat-terns with a predominant antisunward convection over the polar cap are replaced by more complicated pattern with 3-cell or 4-3-cell convection structures at high latitudes. In case of the latter, an additional pair of convection cells is known to be observed at very high latitudes (usually >80◦ mag-netic latitude) with a “reversed”, i.e. sunward convection be-tween them (see, e.g. Cowley, 1983; Reiff and Burch, 1985; Crooker, 1986).
The spatially distributed EDI plasma drift measurements are mapped to a common ionospheric level at F-layer heights for the convenience of better comparability with other obser-vations and because of the better perception in this usual way of viewing the 3-D convection processes. The mapping can be done due to the assumption of equipotentiality along the magnetic field lines and by relying on the correctness of the T-2001 magnetic field model used (Tsyganenko, 2002a,b).
The problem of correct mapping and of the applicability of the equipotentiality has been dealt with in a case study of Baker et al. (2004) using in-situ magnetospheric EDI drift
measurements on the one hand and ground-based radar data of SuperDARN on the other. A later statistical study came to the conclusion that during northward IMF the evidence for reverse convection in the dayside polar cap is much more pronounced in the EDI data than it is in the SuperDARN data (J. B. Baker et al., contribution to the AGU Fall meeting 2006). This result might suggest that there are differences in the smaller-scale convection structures of the high-latitude lobe cells as observed in the ionosphere and those measured in-situ within the spacious magnetosphere. The time-scale for establishing the reverse convection to manifest itself in the ionosphere, working against the upper atmosphere’s iner-tia, may be longer than that at high altitudes so that the prob-ability of its appearence in the upper atmosphere is smaller. More likely is the following explanation. While the Clus-ter EDI data have its best coverage just at high latitudes
By+ IMF Bz+ (a) ∆U = 16.66 kV
By+ IMF Bz+ (b) ∆U = 6.46 kV
By+ IMF Bz+ (c) ∆U = 17.61 kV
By+ IMF Bz+ (d) ∆U = 3.75 kV
Fig. 7. Potential pattern for strictly northward directed IMF for both Northern (upper two panels a and b) and Southern Hemisphere (lower
panels c and d). The data set was filtered additionally for the magnitude of the IMF vector; the left panels (a) and (c) show the resulting potential distributions for high values (≥5 nT), and the right panels (b) and (d) the corresponding patterns for low IMF magnitudes (<5 nT). The clock angle range is 0±22.5◦for all panels. The potential differences1Uabove each panel give the values for the high-latitude dayside pair of cells.
The relatively long 1-min averages used throughout this study guarantee to a higher degree that the equipotentiality along the high-latitude magnetic field lines is well satisfied under most conditions. Further, the periods used for this study represent a selection of periods with well-established convection regimes as a 30-min filter window is applied to the ACE solar wind and IMF data that constitute the in-put data for both mapping and data filtering as described in Sect. 3.
Much attention has been spent for the careful filtering of the solar wind and IMF conditions using the so-called bias vector filtering. Knipp et al. (1991) report about high-latitude dayside potential drops of up to about 75 kV, while the maxi-mum values of this study for the high-latitude cell pair is not larger than∼20 kV in the case of selecting data points
dur-ing periods of high IMF magnitudes as shown in Fig. 7. The average level of both the minimum potential difference val-ues of the main convection cells and the potential difference between the medium-scale high-latitude dayside convection cells close to northward IMF conditions are about 10 kv to 15 kV (cf. Fig. 4).
larger spatial dimensions that impede to a certain degree the smearing-out effect, though it doesn’t prevent the lowering of the absolute potential values (see, e.g., the discussion in Haaland et al., 2007, with respect to Fig. 9). We emphasize that the bias filtering technique does not remove disturbed periods of the solar wind stream. It excludes only those peri-ods where we cannot with reasonable confidence get a valid upstream IMF.
Such high potential values as in Knipp et al. (1991) for the medium-scale high-latitude convection cells can only be seen for potential distributions that are obtained instantaneously. This requires observational methods capable to image the whole high-latitude drift pattern at once (i.e. with character-istic times of one minute or less) or at least the major part of it like it is in principle possible with the SuperDARN network (Greenwald et al., 1995a; Ruohoniemi and Baker, 1998).
The present study was partly motivated by the work of Vennerstrom et al. (2002, 2005). They examine FAC struc-tures in the dayside cusp and polar cap region using magnetic data from the low-altitude polar-orbiting satellite Ørsted and confined to cases where the IMF has a steady northward com-ponent. Their analysis of observational material in Venner-strom et al. (2002) is complemented by the results of a global MHD simulation of solar wind – magnetosphere interaction during northward IMF in the paper of Vennerstrom et al. (2005).
They show that during strictly northward IMF the sim-ulated magnetosphere can remain essentially closed be-cause the newly reconnected field lines are closed in the lobes of both hemispheres separately. But already a small nonzero IMFBy component makes the convection pattern non-symmetric and opens effectively the polar cap area. The reconnection scenario from Vennerstrom et al. (2005, Fig. 5) shows the reconnection geometry looking from the sun to-ward Earth’s magnetosphere. Their numerical model runs of this scenario and the resulting FAC and plasma potential drift pattern in Vennerstrom et al. (2005, Figs. 2 and 3) are comparable to the North Hemisphere patterns in Fig. 1e–i.
The potential pattern of the high-latitude dayside convec-tion cells is quite similar, including the intensificaconvec-tion of the preenoon negative cell and its extension toward the dusk side main cell, accompanied by the contemporary diminish-ing and disappearance of the other (positive postnoon) high-latitude cell. Nevertheless, the model convection pattern also differs in some points from the statistical average patterns shown in Fig. 1. The positions of the high-latitude convection cell foci is shifted there to higher latitudes closer to the dawn-dusk meridian and the main cells are almost absent except for an interval close to IMFBy+. The model design disregards obviously some important process that leads to the persis-tence of the main convection cells. This could partly be due to the “fly-wheel” effect of the neutral thermosphere (Banks, 1972; Coroniti and Kennel, 1973), which imparts some mo-mentum to the plasma convection with a longer characteristic time than the solar wind driver and in addition to the “viscous
interaction process” with the solar wind which probably con-tributes as well. A detailed comparison between model and statistical average is beyond the scope of this paper.
6 Conclusions
The characteristics of the high-latitude magnetospheric con-vection for IMF clock angle ranges close to northward IMF, based on a statistics that comprise EDI measurements of the Cluster satellites for∼6.5 years, can be summarized as fol-lows.
– Average high-latitude convection pattern resulting from statistical overviews of in-situ magnetopsheric drift measurements confirm the existence of 4-cell, 3-cell, and 2-cell structures in dependence of the IMF vector for distinct intervals of the IMF clock angle.
– There is a gradual transition from the 4-cell pattern via 3-cell structures to the 2-cell convection pattern with increasing clock angle distances from the approximate northward IMF direction. At the Northern Hemisphere, the transition with increasing (decreasing) clock angles toward more positive (negative) values is accompanied by an intensification of the negative (positive) high-latitude dayside cell on the prenoon (afternoon) side that merges with the main cell at lower latitudes of the dusk (dawn) sector to form a large “round-shaped” convec-tion cell that is well-known under IMFBy-dominated conditions. At the same time, the other high-latitude dayside convection cell diminishes and disappears. The opposite scenario with interchanged roles of the respec-tive cells is valid for the Southern Hemisphere.
– 4-cell structures are present in a statistical average sense for clock angle ranges between about−35◦ to +25◦, i.e., with a small offset of a few degrees toward neg-ative clock angles with respect to strictly northward IMFBz+. The small shift toward negative clock angles is also manifested in an offset of about−10◦ to−15◦ of the maximum potential difference between the high-latitude dayside cells.
– The positions of the high-latitude dayside convection foci are limited within ranges of 79◦ to 85◦ magnetic latitude and 09:00–15:00 MLT. Near their maximum po-tential difference at ≈−10◦ to −15◦ clock angle, the maximum (minimum) is at higher magnetic latitudes for the North (South) Hemisphere while the MLT posi-tion is approximately symmetric±2 h, apparently with a small (∼0.5 h) offset from midday toward prenoon hours.
range of their coexistence; the relative importance of the former, i.e., the strengths of the potential difference between the high-latitude dayside cells, increases with increasing magnitude of the IMF vector.
Acknowledgements. Work at Helmholtz Centre Potsdam, German
Research Centre for Geosciences (M. F¨orster), was supported by Deutsche Forschungsgemeinschaft (DFG). Research at the Univer-sity of Bergen (S. E. Haaland) was supported by the Norwegian Research Council. Work in the US was supported by NASA Grant NNX07A103G. We thank the ACE SWEPAM and MAG instrument teams and the ACE Science Center for providing the ACE data.
Topical Editor R. Nakamura thanks A. Grocott and two other anonymous referees for their help in evaluating this paper.
References
Baker, J. B., Greenwald, R. A., Ruohoniemi, J. M., F¨orster, M., Paschmann, G., Donovan, E. F., Tsyganenko, N. A., Quinn, J. M., and Balogh, A.: Conjugate comparison of SuperDARN and Cluster EDI measurements of ExB plasma drift, J. Geophys. Res., 109, A01209, doi:10.1029/2003JA009912, 2004.
Banks, P. M.: Magnetospheric processes and the behavior of the neutral atmosphere, Space Res., 12, 1051–1067, 1972.
Burke, W. J., Kelley, M. C., Sagalyn, R. C., Smiddy, M., and Lai, S. T.: Polar cap electric field structures with a northward inter-planetary magnetic field, Geophys. Res. Lett., 6, 21–24, 1979. Coroniti, F. V. and Kennel, C. F.: Can the ionosphere regulate
mag-netospheric convection?, J. Geophys. Res., 78, 2837–2851, 1973. Cowley, S. W. H.: Interpretation of observed relations between so-lar wind characteristics and effects at ionospheric altitudes, in: High-latitude space plasma physics, edited by: Hultqvist, B. and Hagfors, T., pp. 225–249, Plenum Press, New York and London, 1983.
Crooker, N. U.: An evolution of antiparallel merging, Geophys. Res. Lett., 13, 1063–1066, 1986.
Dungey, J. W.: Interplanetary magnetic field and the auroral zones, Phys. Rev. Lett., 6, 47–48, 1961.
Escoubet, C. P., Schmidt, R., and Goldstein, M. L.: Cluster – Sci-ence and Mission Overview, Space Sci. Rev., 79, 11–32, 1997. F¨orster, M., Paschmann, G., Haaland, S. E., Quinn, J. M., Torbert,
R. B., McIlwain, C. E., Vaith, H., Puhl-Quinn, P. A., and Klet-zing, C. A.: High-latitude plasma convection from Cluster EDI: Variances and solar wind correlations, Ann. Geophys., 25, 1691– 1707, 2007,
http://www.ann-geophys.net/25/1691/2007/.
Greenwald, R. A., Baker, K. B., Dudeney, J. R., Pinnock, M., Jones, T. B., Thomas, E. C., Villain, J.-P., Cerisier, J.-C., Senior, C., Hanuise, C., Hunsucker, R. D., Sofko, G., Koehler, J., Nielsen, E., Pellinen, R., Walker, A. D. M., Sato, N., and Yamagishi, H.: DARN/SuperDARN A global view of the dynamics of high-latitude convection, Space Sci. Rev., 71, 763–796, 1995a. Greenwald, R. A., Bristow, W. A., Sofko, G. J., Cerisier, J.-C., and
Szabo, A.: Super Dual Auroral Radar Network radar imaging of dayside high-latitude convection under northward interplane-tary magnetic field: Toward resolving the distorted two-cell ver-sus multicell controversy, J. Geophys. Res., 100, 19 661–19 674, 1995b.
Grocott, A., Badman, S. V., Cowley, S. W. H., Yeoman, T. K., and Cripps, P. J.: The influence of IMF By on the nature of the night-side high-latitude ionospheric flow during intervals of positive IMF Bz, Ann. Geophys., 22, 1755–1764, 2004,
http://www.ann-geophys.net/22/1755/2004/.
Grocott, A., Yeoman, T. K., Milan, S. E., Amm, O., Frey, H. U., Juusola, L., Nakamura, R., Owen, C. J., R`eme, H., and Takada, T.: Multi-scale observations of magnetotail flux transport dur-ing IMF-northward non-substorm intervals, Ann. Geophys., 25, 1709–1720, 2007,
http://www.ann-geophys.net/25/1709/2007/.
Gustafsson, G., Andr´e, M., Carozzi, T., Eriksson, A. I., F¨althammar, C.-G., Grard, R., Holmgren, G., Holtet, J. A., Ivchenko, N., Karlsson, T., Khotyaintsev, Y., Klimov, S., Laakso, H., Lindqvist, P.-A., Lybekk, B., Marklund, G., Mozer, F., Mur-sula, K., Pedersen, A., Popielawska, B., Savina, S., Stasiewicza, K., Tanskanen, P., Vaivads, A., and Wahlund, J.-E.: First results of electric field and density observations by Cluster EFW based on initial months of operation, Ann. Geophys., 19, 1219–1240, 2001,
http://www.ann-geophys.net/19/1219/2001/.
Haaland, S. E., Paschmann, G., and Sonnerup, B. U. ¨O.: Comment on “A new interpretation of Weimer et al.’s solar wind propaga-tion delay technique” by Bargatze et al., J. Geophys. Res., 111, A06102, doi:10.1029/2005JA011376, 2006.
Haaland, S. E., Paschmann, G., F¨orster, M., Quinn, J. M., Torbert, R. B., McIlwain, C. E., Vaith, H., Puhl-Quinn, P. A., and Klet-zing, C. A.: High-latitude plasma convection from Cluster EDI measurements: Method and IMF-dependence, Ann. Geophys., 25, 239–253, 2007,
http://www.ann-geophys.net/25/239/2007/.
Haaland, S. E., Paschmann, G., F¨orster, M., Quinn, J. M., Torbert, R. B., Vaith, H., Puhl-Quinn, P. A., and Kletzing, C. A.: Plasma convection in the magnetotail lobes: Statistical results from Clus-ter EDI measurements, Ann. Geophys., 26, 2371–2382, 2008, http://www.ann-geophys.net/26/2371/2008/.
Knipp, D. J., Richmond, A. D., Emery, B., Crooker, N. U., De La Beaujardiere, O., Evans, D., and Kroehl, H.: Ionospheric convec-tion response to changing IMF direcconvec-tion, Geophys. Res. Lett., 18, 721–724, 1991.
Mailyan, B., Muntenanu, C., and Haaland, S. E.: What is the best method to calculate the solar wind propagation delay?, Ann. Geophys., 26, 2383–2394, 2008,
http://www.ann-geophys.net/26/2383/2008/.
Matsui, H., Jordanova, V. K., Quinn, J. M., Torbert, R. B., and Paschmann, G.: Derivation of electric potential patterns in the inner magnetosphere from Cluster EDI data: Initial results, J. Geophys. Res., 109, A10202, doi:10.1029/2003JA010319, 2004. Matsui, H., Quinn, J. M., Torbert, R. B., Jordanova, V. K., Puhl-Quinn, P. A., and Paschmann, G.: IMF BY and the seasonal
de-pendences of the electric field in the inner magnetosphere, Ann. Geophys., 23, 2671–2678, 2005,
http://www.ann-geophys.net/23/2671/2005/.
McComas, D. J., Bame, S. J., Barker, P., Feldman, W. C., Phillips, J. L., Riley, P., and Griffee, J. W.: Solar Wind Electron Proton Alpha Monitor (SWEPAM) for the Advanced Composition Ex-plorer, Space Sci. Rev., 86, 563–612, 1998.
reconnection, J. Geophys. Res., 110, A01212, doi:10.1029/ 2004JA010835, 2005.
Noda, H., Baumjohann, W., Nakamura, R., Torkar, K., Paschmann, G., Vaith, H., Puhl-Quinn, P., F¨orster, M., Torbert, R. B., and Quinn, J. M.: Tail lobe convection observed by Cluster/EDI, J. Geophys. Res., 108, 1288, doi:10.1029/2002JA009669, 2003. Papitashvili, V. O. and Rich, F. J.: High-latitude ionospheric
con-vection models derived from Defense Meteorological Satellite Program ion drift observations and parameterized by the inter-planetary magnetic field strength and direction, J. Geophys. Res., 107, 1198, doi:10.1029/2001JA000264, 2002.
Paschmann, G., Melzner, F., Frenzel, R., Vaith, H., Parigger, P., Pagel, U., Bauer, O. H., Haerendel, G., Baumjohann, W., Sck-opke, N., Torbert, R. B., Briggs, B., Chan, J., Lynch, K., Morey, K., Quinn, J. M., Simpson, D., Young, C., McIlwain, C. E., Fil-lius, W., Kerr, S. S., Mahieu, R., and Whipple, E. C.: The Elec-tron Drift Instrument for Cluster, Space Sci. Rev., 79, 233–269, 1997.
Paschmann, G., Quinn, J. M., Torbert, R. B., Vaith, H., McIlwain, C. E., Haerendel, G., Bauer, O. H., Bauer, T. M., Baumjohann, W., Cornilleau-Wehrlin, N., Fillius, W., F¨orster, M., Frey, S., Georgescu, E., Kerr, S. S., Kletzing, C. A., Matsui, H., Puhl-Quinn, P., and Whipple, E. C.: The Electron Drift Instrument on Cluster: Overview of first results, Ann. Geophys., 19, 1273– 1288, 2001,
http://www.ann-geophys.net/19/1273/2001/.
Potemra, T. A., Zanetti, L. J., Bythrow, P. F., Lui, A. T. Y., and Iijima, T.: By-dependent convection patterns during northward
interplanetary magnetic field, J. Geophys. Res., 89, 9753–9760, 1984.
Quinn, J. M., Paschmann, G., Torbert, R. B., Vaith, H., McIlwain, C. E., Haerendel, G., Bauer, O. H., Bauer, T. M., Baumjohann, W., Fillius, W., F¨orster, M., Frey, S., Georgescu, E., Kerr, S. S., Kletzing, C. A., Matsui, H., Puhl-Quinn, P., and Whipple, E. C.: Cluster EDI convection measurements across the high–latitude plasma sheet boundary at midnight, Ann. Geophys., 19, 1669– 1681, 2001,
http://www.ann-geophys.net/19/1669/2001/.
Reiff, P. H. and Burch, J. L.: IMF By-dependent plasma flow and Birkeland currents in the dayside magnetosphere, 2. A global model for northward and southward IMF, J. Geophys. Res., 90, 1595–1609, 1985.
Reiff, P. H. and Heelis, R. A.: Four cells or two? Are four convec-tion cells really necessary?, J. Geophys. Res., 99, 3955–3960, 1994.
R`eme, H., Aoustin, C., Bosqued, J.-M., et al.: First multispacecraft ion measurements in and near the Earth’s magnetosphere with the identical Cluster ion spectrometry (CIS) experiment, Ann. Geophys., 19, 1303–1354, 2001,
http://www.ann-geophys.net/19/1303/2001/.
Rich, F. J. and Hairston, M. R.: Large-scale convection patterns observed by DMSP, J. Geophys. Res., 99, 3827–3844, 1994. Ridley, A. J., Clauer, C., Lu, G., and Papitashvili, V.: A statistical
study of the ionospheric convection response to changing inter-planetary magnetic field conditions using the assimilative map-ping of ionospheric electrodynamics technique, J. Geophys. Res., 103, 4023–4039, 1998.
Ruohoniemi, J. M. and Baker, K. B.: Large-scale imaging of high-latitude convection with Super Dual Auroral Radar Network HF radar observations, J. Geophys. Res., 103, 20 797–20 811, 1998. Ruohoniemi, J. M. and Greenwald, R. A.: Rates of scattering oc-curence in routine HF radar observations during solar cycle max-imum, Radio Sci., 32, 1051–1070, 1997.
Ruohoniemi, J. M. and Greenwald, R. A.: Dependencies of high-latitude plasma convection: Consideration of interplane-tary magnetic field, seasonal, and universal time factors in sta-tistical patterns, J. Geophys. Res., 110, A09204, doi:10.1029/ 2004JA010815, 2005.
Sandholt, P. E., Farrugia, C. J., Cowley, S. W. H., Lester, M., Denig, W. F., Cerisier, J.-C., Milan, S. E., Moen, J., Trondsen, E., and Lybekk, B.: Dynamic cusp aurora and associated pulsed re-verse convection during northward interplanetary magnetic field, J. Geophys. Res., 105, 12 869–12 894, 2000.
Shue, J.-H., Chao, J. K., Fu, H. C., Russell, C. T., Song, P., Khurana, K. K., and Singer, H. J.: A new functional form to study the solar wind control of the magnetopause size and shape, J. Geophys. Res., 102, 9497–9512, doi:10.1029/97JA00196, 1997.
Smith, C. W., L’Heureux, J., Ness, N. F., Acu˜na, M. H., Burlaga, L. F., and Scheifele, J.: The ACE magnetic fields experiment, Space Sci. Rev., 86, 613–632, 1998.
Tsyganenko, N. A.: A model of the near magnetosphere with a dawn-dusk asymmetry 1. Mathematical structure, J. Geophys. Res., 107, 1179, doi:10.1029/2001JA000219, 2002a.
Tsyganenko, N. A.: A model of the near magnetosphere with a dawn-dusk asymmetry 2. Parameterization and fitting to observa-tions, J. Geophys. Res., 107, 1176, doi:10.1029/2001JA000220, 2002b.
Vaith, H., Paschmann, G., Quinn, J. M., F¨orster, M., Georgescu, E., Haaland, S., Klecker, B., Kletzing, C. A., Puhl-Quinn, P. A., R´eme, H., and Torbert, R. B.: Plasma convection across the polar cap, plasma mantle and cusp: Cluster EDI observations, Ann. Geophys., 22, 2451–2461, 2004,
http://www.ann-geophys.net/22/2451/2004/.
Vennerstrom, S., Moretto, T., Olsen, N., Friis-Christensen, E., Stampe, A. M., and Watermann, J. F.: Field-aligned currents in the dayside cusp and polar cap region during northward IMF, J. Geophys. Res., 107, 1188, doi:10.1029/2001JA009162, 2002. Vennerstrom, S., Moretto, T., Rast¨atter, L., and Raeder, J.:
Field-aligned currents during northward interplanetary magnetic field: Morphology and causes, J. Geophys. Res., 110, A06205, doi: 10.1029/2004JA010802, 2005.
Weimer, D. R.: Improved ionospheric electrodynamic models and application to calculating Joule heating rates, J. Geophys. Res., 110, A05306, doi:10.1029/2004JA010884, 2005.
Weimer, D. R. and King, J. H.: Improved calculations of in-terplanetary magnetic field phase front angles and propaga-tion time delays, J. Geophys. Res., 113, A01105, doi:10.1029/ 2007JA012452, 2008.