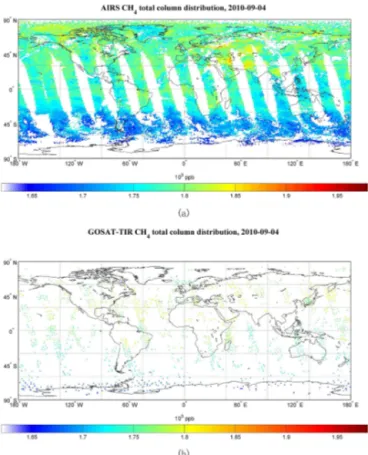
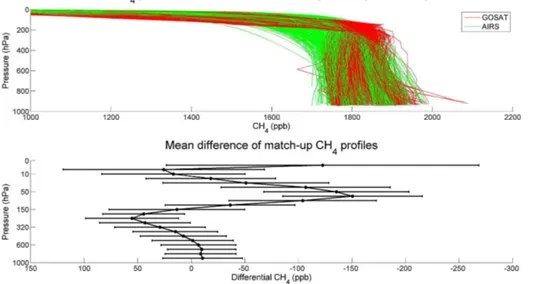
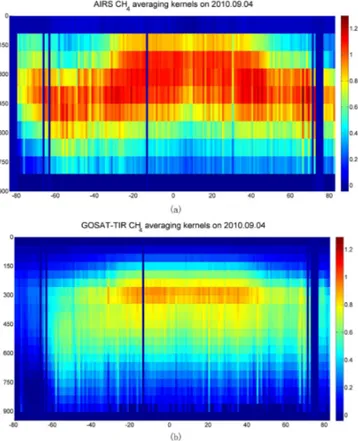
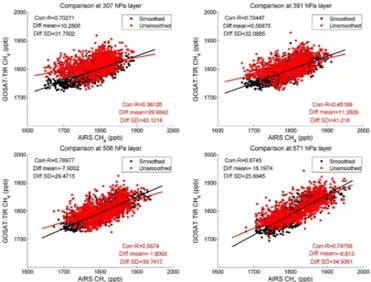
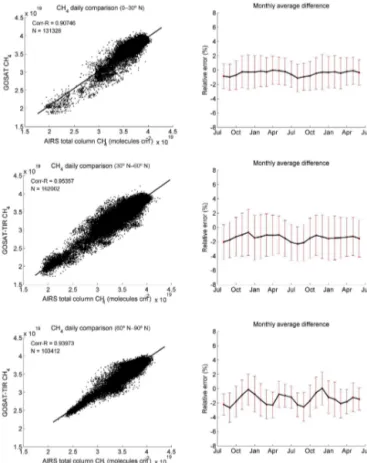
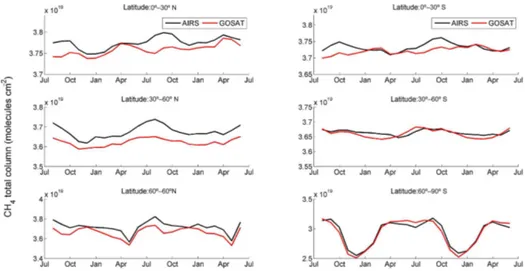
Satellite observation of atmospheric methane: intercomparison between AIRS and GOSAT TANSO-FTS retrievals
Texto
Imagem
Documentos relacionados
Extinction with social support is blocked by the protein synthesis inhibitors anisomycin and rapamycin and by the inhibitor of gene expression 5,6-dichloro-1- β-
The probability of attending school four our group of interest in this region increased by 6.5 percentage points after the expansion of the Bolsa Família program in 2007 and
the objective of this study is to identify the relationship between the seasonal spatial variability of the cyclones distribution in the Southern hemisphere and
In summary, regarding ethnicity, sun exposure and the differences between high and low latitudes, the data presented above suggest that in high latitude regions in which extreme
Na segunda categoria, denominada vulnerabilidade média, foram enquadradas as á- reas que apresentam, de forma geral, um médio padrão construtivo, ruas pavimentadas
Ao Dr Oliver Duenisch pelos contatos feitos e orientação de língua estrangeira Ao Dr Agenor Maccari pela ajuda na viabilização da área do experimento de campo Ao Dr Rudi Arno
Neste trabalho o objetivo central foi a ampliação e adequação do procedimento e programa computacional baseado no programa comercial MSC.PATRAN, para a geração automática de modelos
Ousasse apontar algumas hipóteses para a solução desse problema público a partir do exposto dos autores usados como base para fundamentação teórica, da análise dos dados
