Insulin
Gene Activity under Normal and Pathological
Conditions
Tokio Katsumata., Hisashi Oishi., Yukari Sekiguchi, Haruka Nagasaki, Dhouha Daassi, Pei-Han Tai,
Masatsugu Ema, Takashi Kudo, Satoru Takahashi*
Department of Anatomy and Embryology, Faculty of Medicine, University of Tsukuba, Tennodai, Tsukuba, Ibaraki, Japan
Abstract
In diabetes research, bioluminescence imaging (BLI) has been applied in studies ofb-cell impairment, development, and islet transplantation. To develop a mouse model that enables noninvasive imaging ofb cells, we generated a bacterial artificial chromosome (BAC) transgenic mouse in which a mouse 200-kbp genomic fragment comprising theinsulin Igene
drives luciferase expression (Ins1-lucBAC transgenic mouse). BLI of mice was performed using the IVIS Spectrum system
after intraperitoneal injection of luciferin, and the bioluminescence signal from the pancreatic region analyzed. When compared with MIP-Luc-VU mice [FVB/N-Tg(Ins1-luc)VUPwrs/J] expressing luciferase under the control of the 9.2-kbp mouse
insulin Ipromoter (MIP), the bioluminescence emission fromIns1-lucBAC transgenic mice was enhanced approximately 4-fold. Streptozotocin-treatedIns1-lucBAC transgenic mice developed severe diabetes concomitant with a sharp decline in the BLI signal intensity in the pancreas. Conversely, mice fed a high-fat diet for 8 weeks showed an increase in the signal, reflecting a decrease or increase in theb-cell mass. Although the bioluminescence intensity of the islets correlated well with the number of isolated islets in vitro, the intensity obtained from a living mouse in vivo did not necessarily reflect an absolute quantification of theb-cell mass under pathological conditions. On the other hand, adenovirus-mediated gene transduction ofb-cell-related transcription factors inIns1-lucBAC transgenic mice generated luminescence from the hepatic region for more than 1 week. These results demonstrate that BLI inIns1-lucBAC transgenic mice provides a noninvasive
method of imaging isletbcells and extrapancreatic activity of theinsulingene in the liver under normal and pathological
conditions.
Citation:Katsumata T, Oishi H, Sekiguchi Y, Nagasaki H, Daassi D, et al. (2013) Bioluminescence Imaging ofbCells and IntrahepaticInsulinGene Activity under Normal and Pathological Conditions. PLoS ONE 8(4): e60411. doi:10.1371/journal.pone.0060411
Editor:Bin He, Baylor College of Medicine, United States of America
ReceivedOctober 18, 2012;AcceptedFebruary 27, 2013;PublishedApril 4, 2013
Copyright:ß2013 Katsumata et al. This is an open-access article distributed under the terms of the Creative Commons Attribution License, which permits unrestricted use, distribution, and reproduction in any medium, provided the original author and source are credited.
Funding:This work was supported by a Grant-in-Aid for Scientific Research (21220009) from the Japanese Ministry of Education, Culture, Sports, Science and Technology (MEXT). The funders had no role in study design, data collection and analysis, decision to publish, or preparation of the manuscript.
Competing Interests:The authors have declared that no competing interests exist.
* E-mail: [email protected]
.These authors contributed equally to this work.
Introduction
In type I diabetes, autoimmune reaction to b cells leads to destruction of insulin-producing cells, and in type II diabetes, cumulative cell damage evoked by various stresses inducesb-cell dysfunction, eventually resulting in insufficient insulin supply and a reduction inb-cell mass [1,2]. Accurate assessment ofb-cell mass is considered necessary for understanding both the pathogenesis and the prognosis of diabetes [3]. In human studies, various modalities such as positron emission tomography (PET), single photon emission computed tomography (SPECT), and magnetic resonance imaging (MRI) have been shown to be useful means for quantification of native and transplanted b-cell mass [4]. In contrast to other modalities, bioluminescence imaging (BLI) additionally provides quantifiable data with high throughput and inherently low background; however, it is difficult to use current BLI technology forin situquantification of humanbcells because the light emission quickly diminishes as it propagates through tissues [5]. In experimental animals, an increasing number of studies have proposed successful quantification ofb-cell mass using
BLI of mice expressingb-cell-specific reporters [6–8]. BLI has also been applied in animal studies on b-cell development, islet transplantation, andb-cell function [4,8–11].
often multihormonal and had gene expression profiles resembling immature endocrine cells [22].
In this study, we aimed to generate mice expressing ab -cell-specific reporter with a more intense luminescence and a lower background. For this objective, the bacterial artificial chromosome (BAC) transgenesis was applied. BAC inserts are large (100– 300 kb) and therefore carry almost all the regulatory sequences necessary for temporally and spatially correct expression that closely reflect endogenous gene activity independent of the genomic integration site [23,24]. In addition, theluc2 gene that is adapted for mammalian expression was used as a luminescent reporter to improve sensitivity. Here, we show that novelIns1-luc BAC transgenic mice are useful for visualization of isletbcells and intrahepatic insulin gene activity under normal and pathological conditions.
Materials and Methods
Animals
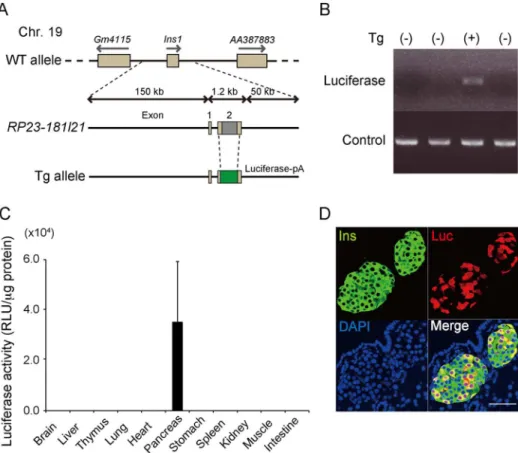
All experiments were performed in compliance with the relevant Japanese and institutional laws and guidelines and approved by the University of Tsukuba animal ethics committee (authorization number 12–189). A luciferase gene fragment with the polyade-nylation signal of human growth hormone was obtained by digestion of the pGL4.10 vector (Promega, Madison, WI, USA) with XhoI/BamHI. The insulin Igene in the BAC clone RP23-181I21 (Invitrogen, Carlsbad, CA, USA), was replaced with the firefly luciferase gene using a Red/ET recombination system
(Gene Bridges, Heidelberg, Germany) (Figure 1A). Recombinant BAC DNA linearized by PI-SceI digestion was used for pronuclear injection of fertilized eggs collected from ICR females. The injected eggs were transplanted into pseudopregnant ICR females. Transgenic mice expressing luciferase under the control of the mouse Ins1 promoter [FVB/N-Tg(Ins1-luc)VUPwrs/J; Stock number: 007800; MIP-Luc-VU] were purchased from the Jackson Laboratory (Bar Harbor, ME, USA). Both lines of mice were continuously bred with the Jcl:ICR strain (Clea Japan, Tokyo, Japan).
Screening ofIns1-lucBAC transgenic mice and
determination of the transgene copy number
The genotype and copy number of the transgene were determined by means of regular PCR and quantitative PCR of the tail DNA, respectively [25]. The primer sequences for the luciferase gene were 59-gagcagctgcacaaagccatg-39 and 59-cgctcatctcgaagtactcgg-39 and for the control (interleukin-2), 59-ctaggccacagaattgaaagatct-39 and 59-gtaggtggaaattctagcatcatcc-39 [25].
Measurement of luciferase activity
A luciferase assay kit (Promega) and Glomax 20/20 luminom-eter (Promega) were used to measure luciferase activity, which was expressed as relative light units (RLU) per milligram of protein. The protein concentration was determined using a Coomassie Protein Assay kit (Thermo Fisher Scientific, Waltham, MA, USA).
Figure 1. Generation ofIns1-lucBAC transgenic mice.(A) Diagrammatic representation of the transgene. (B) Representative example of a PCR-positive individual for genotyping. Control: interleukin-2. (C) Luciferase activity in tissue lysates of maleIns1-lucBAC transgenic mice at 4 to 6 weeks of age (n = 3). RLU: relative light unit. (D) Tissue sections ofIns1-lucBAC transgenic mouse stained with anti-insulin antibody (Ins), anti-luciferase antibody (Luc), and diamidino-2-phenylindole (DAPI). Scale bars: 50mm.
doi:10.1371/journal.pone.0060411.g001
Figure 2.In vivobioluminescence imaging of MIP-Luc-VU andIns1-lucBAC transgenic mice.(A, B) Changes in bioluminescence intensity of (A) MIP-Luc-VU (n = 3) and (B)Ins1-lucBAC transgenic (n = 3) mice following intraperitoneal injection of luciferin. (C) Representative bioluminescence imaging of MIP-Luc-VU mice (upper) andIns1-lucBAC transgenic mice (lower). Circles indicate regions of interest. (D) Quantification of signal intensity in male MIP-Luc-VU mice (n = 6) and maleIns1-lucBAC transgenic mice (n = 18). (E) Bioluminesence images of laparotomizedIns1-lucBAC transgenic mice immediately after injection of luciferin. The arrow indicates the pancreas. (F) Quantification of the signal intensity ofIns1-lucBAC transgenic mice in the fasting and nonfasting states.
Bioluminescence imaging
To detect the bioluminescence of free-fed Ins1-luc BAC transgenic mice and of MIP-Luc-VU mice using an IVIS spectrum (Caliper Life Sciences, Hopkinton, MA, USA), D-luciferin (5 mg/ kg body weight, Promega) was injected intraperitoneally (IP) and imaged 5 and 10 minutes later, respectively. Luminescence images were captured with an integration time of 1 minute, and isometric
regions of interest (ROIs) were drawn over the location corresponding to the pancreas for the quantification using Living Image software (Xenogen Corporation, Alameda, CA, USA). For studies in which BLI was performedin vitro, a variable number of equal-sized islets isolated from both strains were cultured overnight in RPMI with 10% FBS and 16.7 mM glucose and imaged as described elsewhere [8].
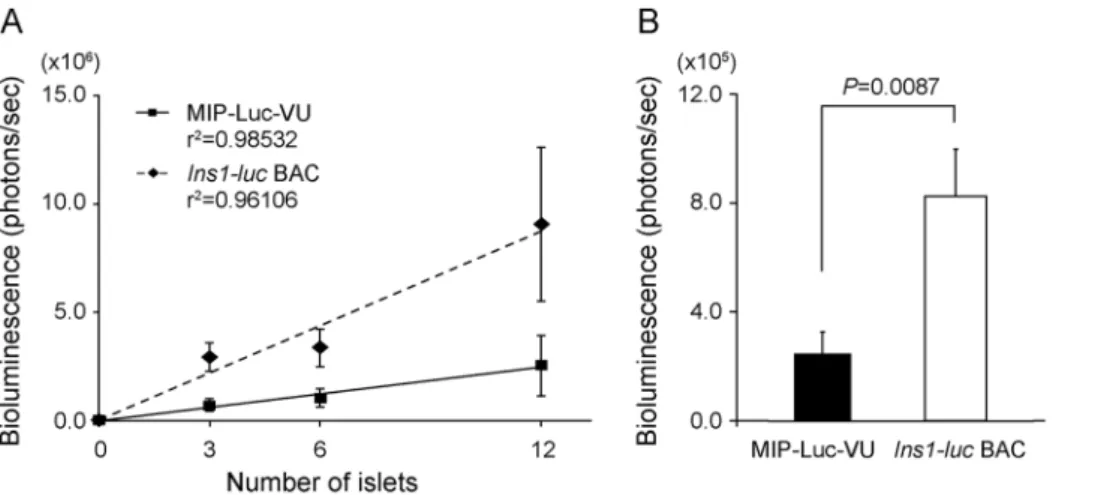
Figure 3. Bioluminescence intensity of isolated pancreatic islets in culture.(A) 3, 6, and 12 islets of similar size from MIP-Luc-VU mice (n = 4) andIns1-lucBAC transgenic mice (n = 5) were individually placed in a 24-well plate, and bioluminescence imaging was performed immediately after addition of luciferin. (B) Comparison of bioluminescence intensity per islet in MIP-Luc mice (n = 6) andIns1-lucBAC transgenic mice (n = 12). doi:10.1371/journal.pone.0060411.g003
Figure 4. Bioluminescence images of streptozotocin (STZ) -treatedIns1-lucBAC transgenic mice.(A) Representative bioluminescence images of Ins1-luc BAC transgenic male mice before and after treatment with vehicle control or STZ. Circles indicate regions of interest. (B) Quantification of signal intensity in the vehicle control group (n = 5) and the STZ group (n = 5) at 0, 5, and 15 days after the injection. *P= 0.025. (C) Immunohistochemistry for anti-insulin antibody in the islets ofIns1-lucBAC transgenic mice treated with vehicle control or STZ. Scale bars: 50mm. (D)
b-cell mass in the vehicle control group (n = 3) and in the STZ-treated group (n = 4). doi:10.1371/journal.pone.0060411.g004
Histological analysis
WT andIns1-luc BAC transgenic mice were euthanized at 8 weeks of age, and the pancreatic tissues removed. Tissues were fixed in 10% formalin and embedded in paraffin. Tissue sections were incubated with guinea pig anti-insulin antibody (Abcam, Cam-bridge, UK) and rabbit anti-glucagon antibody (Linco Research, St. Charles, MO, USA) for 8 hours at 4uC. The antigens were visualized using appropriate secondary antibodies conjugated with alexa488 and alexa594 with nuclear staining using diamidino-2-phenylindole (DAPI) (Invitrogen). For measurement ofb-cell mass,
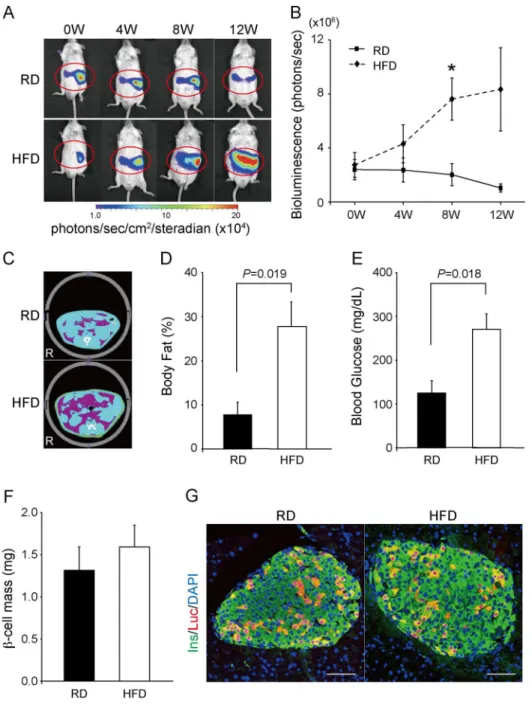
the removed pancreatic fragments were immediately weighed. Ten consecutive 5-mm sections 200mm apart spanning the entire pancreas were stained with anti-insulin antibody. Images of the sections were scanned and analyzed using a Biorevo BZ-9000 microscope (Keyence, Osaka, Japan) and BZ-II analyzer software (Keyence). The relative areas stained for insulin were measured and multiplied by the pancreas weight to estimate theb-cell mass. Figure 5. Bioluminescence images ofIns1-lucBAC transgenic mice fed a regular (RD) or a high-fat diet (HFD).(A) Representative images of mice fed a RD or an HFD for 12 weeks beginning at 6 weeks of age. (B) Quantification of bioluminescence intensity (RD: n = 4; HFD: n = 6). *P= 0.019. (C) Computed tomography (CT)-based body composition analysis. Representative CT images of mice treated with a RD or an HFD for 8 weeks. Purple, yellow, and blue areas represent visceral fat, subcutaneous fat, and lean mass, respectively. (D) Body fat percentage of mice treated with a RD (n = 4) or an HFD (n = 5) for 8 weeks. (E) Fasting blood glucose levels in the RD- (n = 4) or HFD- (n = 5) treated groups of mice for 8 weeks. (F)
Diabetes induction
Ins1-lucBAC transgenic mice were rendered diabetic at 6 weeks of age by an IP injection of streptozotocin (STZ, Sigma) at a dose of 200 mg/kg body weight in 0.1 M citrate buffer (pH 4.5).
High-fat Diet
Ins1-lucBAC transgenic mice were fed either a control regular diet (RD) or a high-fat diet (HFD) consisting of 62.2% fat, 19.6% carbohydrate, and 18.2% protein content on a caloric basis (Oriental Yeast, Tokyo, Japan). To assess the effect of the HFD on glucose homeostasis, the body fat composition and fasting blood glucose (FBG) levels of the mice were examined by means of a LaTheta computed tomography (CT) system (Hitachi Aloka Medical, Tokyo, Japan) and a Drichem 3500 (Fujifilm, Tokyo, Japan), respectively. Bioluminescence images were collected every 4 weeks beginning when the mice were 6 weeks of age.
Preparation of recombinant adenovirus vectors
Recombinant adenoviruses expressing mouse Pdx1, NeuroD (kindly gifted by Dr S. Yoshida), andMafA were prepared using a ViraPower Adenoviral Gateway Expression Kit (Invitrogen) [26]. In brief, cDNA fragments were cloned into a pENTR4 entry
vector. To create expression clones and produce recombinant adenoviruses, the pENTR4 inserts were transferred into the pAd/ CMV/V5-DEST destination vector using the LR recombination reaction, and PacI-linearized plasmids were transfected into 293A cells (Invitrogen) using Fugene 6 transfection reagent (Roche Diagnostics, Basel, Switzerland). Adenoviral constructs (5.06109 pfu/mouse) were injected via the tail vein, and serial BLI was performed before and after infection on designated days. On day 0, the initial BLI was performed before the viral infection.
Statistical analysis
Data were expressed as the means 6 standard errors of the means and compared using an unpairedttest. Probability values of less than 0.05 were considered significant.
Results
We first obtained 68 founder (F0) mice. Of those 68 mice, 8 were transgenic, as confirmed by luciferase gene integration identified by PCR. On BLI screening of the 8 F0 transgenic mice, 4 mice did not emit any BLI signal, 2 mice exhibited an ectopic bioluminescence signal, and the remaining 2 mice exhibited considerable signal intensities emanating from the pancreatic region. Finally, germ line transmission was confirmed by transgene-specific PCR in 1 of the remaining 2 mice (Ins1-luc BAC transgenic mouse). For further experiments, the pups from Ins1-luc BAC transgenic mice and WT mice were identified by transgene-specific PCR (Figure 1B). To examine which organs expressed the reporter gene, different organ tissues at 6 weeks of age were dissected, and the luciferase activities determined. Luciferase activity was detected in the pancreatic extracts (3.562.46104RLU/mg protein; n = 3), but not in the other tissue extracts including those from the thymus and pituitary glands, indicating that the reporter gene was expressed only in the pancreas (Figure 1C). Further immunohistochemical analysis using anti-insulin and anti-luciferase antibodies demonstrated that luciferase-expressing cells were colocalized only with the insulin-positive cells in the pancreas; however, only 11.965.2% (n = 3) of the insulin-expressing cells expressed luciferase (Figure 1D). Treatment of islets isolated from Ins1-Luc BAC transgenic mice with a proteasome inhibitor, MG132, resulted in coexpression of luciferase by most of the insulin-positive cells, suggesting that the relatively low frequency of the expression of the reporter inbcells depends mostly on the proteasomal degradation of luciferase (Figure S1). Using quantitative PCR analyses of genomic DNA isolated from MIP-Luc-VU andIns1-lucBAC transgenic mice, the transgene copy number of theIns1-lucBAC transgenic mice was determined to be 3, the same as that of the MIP-Luc-VU mice (data not shown) [8].
Quantitation of bioluminescence in vivo critically depends on substrate availability and light-emission kinetics. To determine the kinetics of bioluminescence, MIP-Luc-VU and Ins1-luc BAC transgenic mice were imaged 2.5, 5, 10, 15, and 30 minutes after luciferin injection (5 mg/kg body weight, IP). Consistent with previous findings, levels of bioluminescence in MIP-Luc-VU mice peaked at approximately 10 minutes [8], whereas inIns1-lucBAC transgenic mice, they peaked at 5 minutes (Figure 2A, B). Comparative measurements of the peak BLI signals of the pancreatic regions at 6 weeks of age revealed that the intensity in theIns1-lucBAC transgenic mice (2.760.846106photons/sec; n = 18) was significantly enhanced, by approximately 4-fold that of the MIP-Luc-VU mice (5.660.816105 photons/sec; n = 6; P= 0.022) (Figure 2C, D). As shown by laparotomy, the luminescence of theIns1-lucBAC transgenic mice emanated only Figure 6. Bioluminescence images ofIns1-luc BAC transgenic
mice with combinedPdx1,NeuroD, andMafAgene transfer in the liver.(A) Representative images of mice before (day 0) and after the gene transfer. Designated days indicate days after the infection. Each image is optimally adjusted using Living Image software because a huge difference in luminescence from the pancreas and the liver disables showing images with the same longitudinal photon scale. (B) Bioluminescence images of extracted organs from Ins1-luc BAC transgenic mice 3 days after infection. L, P, and S indicate the liver, pancreas, and spleen, respectively. (C) Immunohistochemistry for anti-insulin antibody of the liver from a WT mouse 3 days after infection. Scale bar: 50mm. Arrows indicate insulin-positive cells.
doi:10.1371/journal.pone.0060411.g006
from the pancreas (Figure 2E). To examine the effect of overnight fasting on BLI, the BLI signals under the fasting and fed states of the same set of male Ins1-luc BAC transgenic mice (n = 5) were imaged at 3-day intervals. The intensity of the BLI signal under the fasting state (2.060.776106photons/sec) did not differ from that under the fed state (1.7360.826106photons/sec;P= 0.814) (Figure 2F). Furthermore, the intensity of the BLI signal emitted in females (2.5961.36106 photons/sec; n = 15) did not differ from that emitted in males (5.4161.36106 photons/sec; n = 19) at 8 weeks of age (P= 0.13). Although signal attenuation in RIP-Luc mice over generations was reported because of a genomic imprinting of the transgene [27], we did not find the phenomenon in Ins1-luc BAC transgenic mice over 3 generations (data not shown).
Next, we compared the glucose homeostasis of control WT mice with that ofIns1-lucBAC transgenic mice. Every examination we tested, including blood glucose levels and insulin content in pancreatic islets, showed no difference between them, indicating that Ins1-luc BAC transgenic mice exhibit no abnormality in glucose homeostasis and therefore could be useful asb-cell-specific reporter mice for study of pancreatic islets (Figure S2A–F).
To determine the relationship between the number of islets and the emission of bioluminescence, a variable number of equal-sized islets isolated from Ins1-luc BAC transgenic mice (n = 5) were placed individually in 24-well plates for 8 hours. The biolumines-cence intensity emitted immediately after addition of luciferin to the culture media correlated positively with the number of islets (R2= 0.961) (Figure 3A). In addition, the bioluminescence emission from Ins1-luc BAC transgenic mice (8.1361.716105 photons/sec; n = 12) was about 4-fold higher than that from MIP-Luc-VU mice (2.4160.826105 photons/sec; n = 7; P= 0.0087) (Figure 3B), consistent with thein vivoresult shown in Figure 2D. Next, we examined whether BLI of the mice could detect the loss ofb-cell mass in an STZ-treatedb-cell destruction model. On day 5 after the treatment, the luminescence in the pancreatic region of the STZ group (2.460.816105photons/sec; n = 5) had dropped to undetectable background levels and was significantly reduced as compared with that of the control group (4.161.16106 photons/sec; n = 5;P= 0.025) in response to a decrease inb-cell mass (control: 0.7060.05 mg, n = 4; STZ: 0.01360.003 mg, n = 3;P= 0.0045) (Figure 4A–D).
We also examined whether BLI could sense the increase inb -cell mass in HFD-fed mice.Ins1-lucBAC transgenic male mice fed either a RD (n = 4) or an HFD (n = 6) were imaged at 4, 8, and 12 weeks (Figure 5A). The bioluminescence intensity was significantly enhanced in the HFD-fed mice at 8 weeks (RD: 1.9760.806106 photons/sec; HFD: 7.4261.526106photons/sec;P= 0.022) and accompanied by an increase in the body fat ratio (RD: 7.862.9%; HFD: 27.965.4%; P= 0.019) and in FBG levels (RD: 125628 mg/dL; HFD: 271635 mg/dL; P= 0.018) (Figure 5B– E). However, although the rate of increase in the signal after 8 weeks was substantially higher in the HFD-fed mice than in the RD-fed mice (379%), the rate of increase in b-cell mass differed slightly (121%; RD: 1.3160.28 mg; HFD: 1.5960.26 mg; P= 0.49) (Figure 5F). Immunohistochemical analysis of islets from HFD-fed mice showed a similar pattern to control islets in insulin and luciferase reactivity, so that we could not find a clear reason for the discrepancy in the rate of increase between the BLI signal and b-cell mass (Figure 5G) Interestingly, some mice, especially HFD-treated mice, developed dispersed luminescence from the central to right abdominal regions as shown in Figure 5, probably owing to the signal emission from the duodenum lobe that is ventrally covered by the liver and undetectable in MIP-Luc-VU mice.
Finally, we examined whether intrahepaticinsulingene activity is detected inIns1-luc BAC transgenic mice byb-cell-related gene transfer. ThePdx1, NeuroD, andMafA genes were transferred by adenovirus vectors, and serial BLI was monitored before and after infection. This gene combination was selected according to a previous study [28]. The adenovirus-mediated gene transfer induced a BLI signal in the hepatic region for more than 1 week (Figure 6A). The signal was identified as originating from the liver by imaging of extracted tissues 3 days after infection and by immunohistochemical analysis using anti-insulin antibody (Figure 6B, C). Thus, these results indicate that Ins1-luc BAC transgenic mice could be used for monitoring intrahepaticinsulin gene activityin vivo.
Discussion
In this study, we generated and characterized novel Ins1-luc BAC transgenic mice in whichbcells specifically express luciferase underIns1locus control. Bioluminescence emission from the islets altered in response to bothb-cell destruction and augmentation. Given also the absence of obvious phenotypic changes such as in islet morphology,b-cell insulin content, and secretory response by secretogens, these results indicate that these mice could be useful as a bioluminescence reporter line forb-cell studies.
We found that the bioluminescence intensity correlated well with the number of islets in vitro. However, although some damaged b cells remained after STZ treatment, luminescence from the area corresponding to the pancreas was not detectable. In addition, in the HFD model, the rates of increase of the BLI signal and theb-cell mass were hugely discrepant. These results suggest thatin vivoBLI in the mice could provide only relative changes in b-cell mass but not absolute quantification under pathological conditions. In fact, the BLI intensity in another b-cell-specific reporter mouse has been shown to be affected by other factors, including chronic hyperglycemia, inflammatory mediators, and extrapancreatic fat mass [10].
As far as we know, theIns1-lucBAC transgenic mouse is the first transgenic line containing a reporter driven by theIns1locus. The approximate bioluminescence intensities emitted from the pan-creatic islets of Luc mice developed by Park et al, of MIP-Luc-VU mice developed by Virostko et al, and of theIns1-lucBAC transgenic mice developed here are 1.56105 photons/sec, 2.16105 photons/sec, and 7.96105 photons/sec, respectively [8,9]. The strongest luciferase activities inIns1-lucBAC transgenic mice depend on the cis- and trans-regulatory element(s) within the RP23-181I21andluc2gene as a reporter, which has been codon optimized for mammalian expression. However, the strong luminescence in Ins1-luc BAC transgenic mice might adversely affect individual and experimental variability. The luminescence intensity inIns1-luc BAC transgenic mice showed relatively large variation among individuals, as shown in Figure 2B and 2D. This large variation probably arises because some mice develop adequately detectable luminescence from the pancreatic duode-num lobe that is covered ventrally by the liver. Therefore, the luminescence from the lobe generates a dispersed signal over the central to right abdominal regions especially in the HFD-fed mice (Figure 5A), resulting in individual and experimental differences.
luciferase to ubiquitination confers its half-life of only about 3 hours in mammalian cells, whereas insulin secretory granules have a half-life of 3 to 5 days [29–31]. Besides proteasomal degradation of luciferase, b-cell heterogeneity regulating insulin expression and/or some posttranscriptional modifications ob-served in the mouse Ins1 may also be involved in the levels of luciferase expression [32].
Adult pancreaticbcells were shown to be maintained by self-replication of residentbcells, not by differentiation from stem or progenitor cells [33]. Several factors driving b-cell proliferation have been identified, such as glucose, glucagon-like peptide-1 (GLP-1), connective tissue growth factor (CTGF), platelet-derived growth factor (PDGF), serotonin, and erythropoietin [34–39]. Stimulation of replication and maintenance of b-cell mass is considered to be an important therapeutic goal in diabetes. Alternatively, numerous attempts have been made to generate insulin-producing cells from other cell types. In this context, we found thatb-cell-related gene transfer in hepatocytes of Ins1-luc BAC transgenic mice induced reporter gene activity for more than 1 week. This result indicates that Ins1-luc BAC transgenic mice could be useful for noninvasive monitoring of intrahepaticinsulin gene activity in vivo. However, the reporter gene activity had disappeared by 14 days after the infection, indicating that theb -like cell conversion by Pdx1/NeuroD/MafA gene transfer was transient or incomplete. A recent study demonstrated that albumin-expressing hepatocytes could be directly converted into a neuronal cell lineage, implying that hepatocytes could be reprogrammed beyond different germ layers [40]. Indeed, it has been demonstrated that hepatocytes or hepatocyte precursor cells could be converted to insulin-producing cells using different protocols [41,42]. However, a comprehensive method for com-paring these protocols and determining the optimal conditions for b-cell generation has not been established. The combination of BLI and the transgenic mouse line described here provides readily quantifiable data to examine the efficiency of b-cell induction among different protocols.
Supporting Information
Figure S1 Proteasomal degradation is involved in the frequency of luciferase expression inbcells.Ins1-lucBAC transgenic mice were euthanized at 8 weeks of age, and the pancreatic islets removed. Islets were treated with 10mm MG132 (Wako, Osaka, Japan) in high-glucose DMEM (Invitrogen, Carlsbad, CA, USA) with 10% FBS. After 12 hours of incubation, tissues were fixed in 4% paraformaldehyde and embedded in paraffin. Tissue sections were incubated with guinea pig insulin (Ins) antibody (Abcam, Cambridge, UK) and goat anti-luciferase (Luc) antibody (Promega, Madison, WI, USA) for 8 hours at 4uC following antigen retrieval. The antigens were visualized using appropriate secondary antibodies conjugated with alexa488 and alexa594 with nuclear staining using diamidino-2-phenylindole (DAPI) (Invitrogen, Carlsbad, CA, USA). Scale bars: 100mm.
(PNG)
Figure S2 Normal glucose tolerance, insulin secretion, and islet morphology inIns1-lucBAC transgenic mice.
(A) Glucose tolerance tests after intraperitoneal loading with 2 g D-glucose/kg of WT (484629 mg/dL, n = 3) and Ins1-luc BAC transgenic male mice (543614 mg/dL, n = 3) after a 6-hour fast (P= 0.139). (B) Plasma insulin levels of WT (0.7260.07 ng/mL, n = 3) and Ins1-luc BAC transgenic mice (0.7960.21 ng/mL, n = 3) after intraperitoneal glucose injection (P= 0.78). (C) Plasma insulin levels of WT (1.0860.22 ng/mL, n = 3) andIns1-lucBAC transgenic mice (1.1060.07 ng/mL, n = 3) after intraperitoneal arginine injection (P= 0.81). (D) Insulin content of WT (4W: 74.1610.8 mg/g, n = 4, P= 0.15; 10W: 27.965.0 mg/g, n = 4, P= 0.19) andIns1-lucBAC transgenic mice (4W: 96.768.3 mg/g, n = 4; 10W: 38.764.6 mg/g, n = 3) at 4 and 10 weeks of age (4W: P= 0.15; 10W:P= 0.19). (E) Glucose-stimulated insulin secretion (GSIS) from isolated islets of WT (1.760.35 ng/islet/hour; n = 5) andIns1-lucBAC transgenic mice (2.160.41 ng/islet/hour; n = 5) at 8 weeks of age (P= 0.79). Values are expressed in nanograms of insulin/islet/hour. (F) Tissue sections stained with hematoxylin and eosin (HE) and immunostained with anti-insulin (Ins) antibody (Abcam), anti-glucagon (Glu) antibody (Linco Research, St. Charles, MO, USA), and diamidino-2-phenylindole (DAPI) (Invitrogen) of WT andIns1-lucBAC transgenic mice at 8 weeks of age. Scale bars: 100mm. Intraperitoneal glucose tolerance and arginine tolerance tests (IPGTTs and IPATTs) were performed after the mice had been fasted for 6 hours, as described previously (Zhang et al, 2005, Andrikopoulos et al, 2008, and Ayala J et al., 2010). Briefly, blood samples were collected from the retroorbital plexus at 0, 15, 30, 60, and 120 minutes after IP injection of glucose (2 mg/g of body weight). Plasma glucose levels were measured using a Drichem 3500 (Fujifilm, Tokyo, Japan). For insulin release, glucose (3 mg/g of body weight) or L-arginine (1 mg/g of body weight) was injected IP, and venous blood collected in heparinized tubes at 0, 2, 5, and 15 minutes. Pancreatic insulin was extracted by the acid-ethanol method as described previously (im Walde SS et al, 2002). Serum insulin levels and pancreatic insulin content were measured with a mouse insulin ELISA kit (Morinaga, Yokohama, Japan). To obtain pancreatic islets, pancreata were removed and the islets isolated by collagenase digestion using the previously described protocol (Lacy et al, 1967). These islets were washed and preincubated in 0.5% (wt/vol) bovine serum albumin-Krebs-Ringer HEPES-buffered saline in 2.8 mM glucose at 37uC in 5% CO2for 30 minutes and then transferred to 0.5% (wt/vol) bovine serum albumin–Krebs-Ringer HEPES-buffered saline in 20 mM glucose. After being incubated at 37uC in 5% CO2for 30 minutes, the supernatants were measured for insulin release as described above.
(PNG)
Acknowledgments
The authors thank Dr Shosei Yoshida for providing the expression vectors and Flaminia Miyamasu for grammatical revision of the manuscript.
Author Contributions
Conceived and designed the experiments: ST. Performed the experiments: T. Katsumata HO YS HN DD PT. Analyzed the data: HO ME T. Kudo. Contributed reagents/materials/analysis tools: ST. Wrote the paper: HO ST.
References
1. Robertson RP, Harmon J, Tran PO, Poitout V (2004) Beta-cell glucose toxicity, lipotoxicity, and chronic oxidative stress in type 2 diabetes. Diabetes 53 Suppl 1: S119–124.
2. Bell GI, Polonsky KS (2001) Diabetes mellitus and genetically programmed defects in beta-cell function. Nature 414: 788–791.
3. Reiner T, Thurber G, Gaglia J, Vinegoni C, Liew CW, et al. (2011) Accurate measurement of pancreatic islet beta-cell mass using a second-generation fluorescent exendin-4 analog. Proc Natl Acad Sci U S A 108: 12815–12820. 4. Saudek F, Brogren CH, Manohar S (2008) Imaging the Beta-cell mass: why and
how. Rev Diabet Stud 5: 6–12.
5. Borot S, Crowe LA, Toso C, Vallee JP, Berney T (2011) Noninvasive imaging techniques in islet transplantation. Curr Diab Rep 11: 375–383.
6. Smith SJ, Zhang H, Clermont AO, Powers AC, Kaufman DB, et al. (2006) In vivo monitoring of pancreatic beta-cells in a transgenic mouse model. Mol Imaging 5: 65–75.
7. Park SY, Bell GI (2009) Noninvasive monitoring of changes in pancreatic beta-cell mass by bioluminescent imaging in MIP-luc transgenic mice. Horm Metab Res 41: 1–4.
8. Virostko J, Radhika A, Poffenberger G, Chen Z, Brissova M, et al. (2010) Bioluminescence imaging in mouse models quantifies beta cell mass in the pancreas and after islet transplantation. Mol Imaging Biol 12: 42–53. 9. Park SY, Wang X, Chen Z, Powers AC, Magnuson MA, et al. (2005) Optical
imaging of pancreatic beta cells in living mice expressing a mouse insulin I promoter-firefly luciferase transgene. Genesis 43: 80–86.
10. Sever D, Eldor R, Sadoun G, Amior L, Dubois D, et al. (2011) Evaluation of impaired beta-cell function in nonobese-diabetic (NOD) mouse model using bioluminescence imaging. FASEB J 25: 676–684.
11. Sekiguchi Y, Owada J, Oishi H, Katsumata T, Ikeda K, et al. (2012) Noninvasive Monitoring of beta-Cell Mass and Fetal beta-Cell Genesis in Mice Using Bioluminescence Imaging. Exp Anim 61: 445–451.
12. Ackermann AM, Gannon M (2007) Molecular regulation of pancreatic beta-cell mass development, maintenance, and expansion. J Mol Endocrinol 38: 193–206. 13. Cnop M, Igoillo-Esteve M, Hughes SJ, Walker JN, Cnop I, et al. (2011) Longevity of human islet alpha- and beta-cells. Diabetes Obes Metab 13 Suppl 1: 39–46.
14. Bouwens L, Rooman I (2005) Regulation of pancreatic beta-cell mass. Physiol Rev 85: 1255–1270.
15. Kroon E, Martinson LA, Kadoya K, Bang AG, Kelly OG, et al. (2008) Pancreatic endoderm derived from human embryonic stem cells generates glucose-responsive insulin-secreting cells in vivo. Nat Biotechnol 26: 443–452. 16. Alipio Z, Liao W, Roemer EJ, Waner M, Fink LM, et al. (2010) Reversal of
hyperglycemia in diabetic mouse models using induced-pluripotent stem (iPS)-derived pancreatic beta-like cells. Proc Natl Acad Sci U S A 107: 13426–13431. 17. Maehr R, Chen S, Snitow M, Ludwig T, Yagasaki L, et al. (2009) Generation of pluripotent stem cells from patients with type 1 diabetes. Proc Natl Acad Sci U S A 106: 15768–15773.
18. Zhou Q, Brown J, Kanarek A, Rajagopal J, Melton DA (2008) In vivo reprogramming of adult pancreatic exocrine cells to beta-cells. Nature 455: 627– 632.
19. Bonner-Weir S, Inada A, Yatoh S, Li WC, Aye T, et al. (2008) Transdifferentiation of pancreatic ductal cells to endocrine beta-cells. Biochem Soc Trans 36: 353–356.
20. Yang L, Li S, Hatch H, Ahrens K, Cornelius JG, et al. (2002) In vitro trans-differentiation of adult hepatic stem cells into pancreatic endocrine hormone-producing cells. Proc Natl Acad Sci U S A 99: 8078–8083.
21. Weir GC, Cavelti-Weder C, Bonner-Weir S (2011) Stem cell approaches for diabetes: towards beta cell replacement. Genome Med 3: 61.
22. Basford CL, Prentice KJ, Hardy AB, Sarangi F, Micallef SJ, et al. (2012) The functional and molecular characterisation of human embryonic stem cell-derived insulin-positive cells compared with adult pancreatic beta cells. Diabetologia 55: 358–371.
23. Van Keuren ML, Gavrilina GB, Filipiak WE, Zeidler MG, Saunders TL (2009) Generating transgenic mice from bacterial artificial chromosomes: transgenesis efficiency, integration and expression outcomes. Transgenic Res 18: 769–785.
24. Gangalum RK, Jing Z, Nagaoka Y, Jiang M, Bhat SP (2011) Purification of BAC DNA for high-efficiency transgenesis. Biotechniques 51: 335–338.
25. Alexander GM, Erwin KL, Byers N, Deitch JS, Augelli BJ, et al. (2004) Effect of transgene copy number on survival in the G93A SOD1 transgenic mouse model of ALS. Brain Res Mol Brain Res 130: 7–15.
26. Kajihara M, Sone H, Amemiya M, Katoh Y, Isogai M, et al. (2003) Mouse MafA, homologue of zebrafish somite Maf 1, contributes to the specific transcriptional activity through the insulin promoter. Biochem Biophys Res Commun 312: 831–842.
27. Fowler M, Virostko J, Chen Z, Poffenberger G, Radhika A, et al. (2005) Assessment of pancreatic islet mass after islet transplantation using in vivo bioluminescence imaging. Transplantation 79: 768–776.
28. Kaneto H, Matsuoka TA, Nakatani Y, Miyatsuka T, Matsuhisa M, et al. (2005) A crucial role of MafA as a novel therapeutic target for diabetes. J Biol Chem 280: 15047–15052.
29. Thompson JF, Hayes LS, Lloyd DB (1991) Modulation of firefly luciferase stability and impact on studies of gene regulation. Gene 103: 171–177. 30. Halban PA (1991) Structural domains and molecular lifestyles of insulin and its
precursors in the pancreatic beta cell. Diabetologia 34: 767–778.
31. Rorsman P, Renstrom E (2003) Insulin granule dynamics in pancreatic beta cells. Diabetologia 46: 1029–1045.
32. Wentworth BM, Rhodes C, Schnetzler B, Gross DJ, Halban PA, et al. (1992) The ratio of mouse insulin I:insulin II does not reflect that of the corresponding preproinsulin mRNAs. Mol Cell Endocrinol 86: 177–186.
33. Dor Y, Brown J, Martinez OI, Melton DA (2004) Adult pancreatic beta-cells are formed by self-duplication rather than stem-cell differentiation. Nature 429: 41– 46.
34. Porat S, Weinberg-Corem N, Tornovsky-Babaey S, Schyr-Ben-Haroush R, Hija A, et al. (2011) Control of pancreatic beta cell regeneration by glucose metabolism. Cell Metab 13: 440–449.
35. Buteau J, Foisy S, Rhodes CJ, Carpenter L, Biden TJ, et al. (2001) Protein kinase Czeta activation mediates glucagon-like peptide-1-induced pancreatic beta-cell proliferation. Diabetes 50: 2237–2243.
36. Guney MA, Petersen CP, Boustani A, Duncan MR, Gunasekaran U, et al. (2011) Connective tissue growth factor acts within both endothelial cells and beta cells to promote proliferation of developing beta cells. Proc Natl Acad Sci U S A 108: 15242–15247.
37. Chen H, Gu X, Liu Y, Wang J, Wirt SE, et al. (2011) PDGF signalling controls age-dependent proliferation in pancreatic beta-cells. Nature 478: 349–355. 38. Kim H, Toyofuku Y, Lynn FC, Chak E, Uchida T, et al. (2010) Serotonin
regulates pancreatic beta cell mass during pregnancy. Nat Med 16: 804–808. 39. Choi D, Schroer SA, Lu SY, Wang L, Wu X, et al. (2010) Erythropoietin
protects against diabetes through direct effects on pancreatic beta cells. J Exp Med 207: 2831–2842.
40. Marro S, Pang ZP, Yang N, Tsai MC, Qu K, et al. (2011) Direct lineage conversion of terminally differentiated hepatocytes to functional neurons. Cell Stem Cell 9: 374–382.
41. Yatoh S, Akashi T, Chan PP, Kaneto H, Sharma A, et al. (2007) NeuroD and reaggregation induce beta-cell specific gene expression in cultured hepatocytes. Diabetes Metab Res Rev 23: 239–249.