Functional MRI of Challenging Food Choices:
Forced Choice between Equally Liked
High-and Low-Calorie Foods in the Absence of
Hunger
Lisette Charbonnier1*, Laura N. van der Laan1, Max A. Viergever1, Paul A. M. Smeets1,2
1Image Sciences Institute, University Medical Center Utrecht, Utrecht, The Netherlands,2Division of Human Nutrition, Wageningen University, Wageningen, The Netherlands
Abstract
We are continuously exposed to food and during the day we make many food choices. These choices play an important role in the regulation of food intake and thereby in weight management. Therefore, it is important to obtain more insight into the mechanisms that underlie these choices. While several food choice functional MRI (fMRI) studies have been conducted, the effect of energy content on neural responses during food choice has, to our knowledge, not been investigated before. Our objective was to examine brain responses during food choices between equally liked high- and low-calorie foods in the absence of hunger. During a 10-min fMRI scan 19 normal weight volunteers performed a forced-choice task. Food pairs were matched on individual liking but differed in perceived and actual calo-ric content (high-low). Food choice compared with non-food choice elicited stronger unilat-eral activation in the left insula, superior temporal sulcus, posterior cingulate gyrus and (pre) cuneus. This suggests that the food stimuli were more salient despite subject’s low motiva-tion to eat. The right superior temporal sulcus (STS) was the only region that exhibited greater activation for high versus low calorie food choices between foods matched on liking. Together with previous studies, this suggests that STS activation during food evaluation and choice may reflect the food’s biological relevance independent of food preference. This novel finding warrants further research into the effects of hunger state and weight status on STS, which may provide a marker of biological relevance.
Introduction
We are continuously exposed to food and during the day we make many choices regarding food consumption. As the prevalence of overweight and obesity continues to rise [1], research on food choice is becoming of increased interest because food choices play an important role in determining energy intake. Normal human physiology is innately geared towards obtaining food, which is a powerful reinforcer [2]. Easy availability of tasty foods has caused a shift from OPEN ACCESS
Citation:Charbonnier L, van der Laan LN, Viergever MA, Smeets PAM (2015) Functional MRI of Challenging Food Choices: Forced Choice between Equally Liked High- and Low-Calorie Foods in the Absence of Hunger. PLoS ONE 10(7): e0131727. doi:10.1371/journal.pone.0131727
Editor:Jason R Tregellas, University of Colorado Medical School, UNITED STATES
Received:September 11, 2014
Accepted:June 4, 2015
Published:July 13, 2015
Copyright:© 2015 Charbonnier et al. This is an open access article distributed under the terms of the Creative Commons Attribution License, which permits unrestricted use, distribution, and reproduction in any medium, provided the original author and source are credited.
Data Availability Statement:All relevant data and peak coordinates are included in the manuscript and supporting information. Due to legal restrictions, full fMRI data are available upon request from the authors who are part of the Full4Health consortium (European Union Seventh Framework Programme, grant agreement nr. 266408). The authors intend to grant data requests but are bound by the consortium agreement to obtain approval from all partners.
eating for survival to eating for the pleasure obtained from food reward (hedonic eating) [3–5]. Consequently, metabolic need no longer governs human eating behavior [3,6].
In the past two decades, functional magnetic resonance imaging (fMRI) has become an established method for investigating food-related brain responses [7]. Especially brain
responses to the presentation of food pictures have been widely investigated with fMRI [8–17]. Several of these studies have investigated neural responses to pictures of high and low calorie foods [9,13,15–19]. They have shown that high calorie foods are more rewarding than low calo-rie foods. However, these studies were limited by studying high versus low calocalo-rie food viewing contrast in the absence of a choice context. Furthermore, the food stimuli were not matched on liking, which might explain the difference in reward. In addition, participants were usually in a hungry condition, which increases food reward [18].
In addition, the neuroimaging literature on decision making including the investigation of food choices is growing [16,20–29]. In these studies various manipulations were used to exam-ine different aspects of food choice-related processing in the brain including the effects of taste [25] and willingness to pay for different foods types [26]. However, studies investigating food choice between foods differing in caloric content have, to our knowledge, not been described in the literature. The absence of literature might be explained by the complexity of the topic because of the many factors that may influence the choice between foods differing in caloric content. These factors include the food’s palatability, personality traits and motivational state [30–32]. Hunger increases the rated pleasantness of foods and brain regions involved in reward processing are stronger activated when people are viewing pictures of foods in a hungry state [18]. In line with these findings it is often assumed that there would be minor differences in rewarding properties between high and low calorie food in a sated condition. Yet, studies inves-tigating this are lacking. This is important because it has been shown that many people eat in the absence of hunger. In an environment where food is scarce this is an adaptive characteristic because energy can be stored for later in adipose tissue. However, in our Western society this eventually contributes to overweight [33,34]. To our knowledge, it is unknown which neural mechanisms subserve this phenomenon.
Therefore, the aim of the present study is to investigate the neural mechanisms underlying the choice between equally liked high calorie and low calorie foods in the absence of hunger. We predict minimal differences between brain responses during high versus low calorie food choices, as the subjects are sated and the choices are matched on liking. Because the majority of the food evaluation studies examine the food versus non-food contrasts, we additionally aim to investigate the neural mechanisms underlying food choice versus non-food choice in the absence of hunger. We hypothesize increased activation during food choice in brain regions predominately involved in attention as foods are thought to be more salient than office utensils (i.e. the non-foods used in this study) [35,36] [12,18].
Materials and Methods
Ethics statement
The study was approved by the Medical Ethical Committee of the University Medical Center Utrecht and participants provided written informed consent.
Participants
Participants were recruited by distributing flyers and posters in the University Medical Center Utrecht and at the university campus. Forty-two participants enrolled in the study. We included healthy participants with a normal weight (i.e., BMI 18–25 kg/m2), between 20–40 years old, right-handed, non-smoking, with a stable weight (did not gain or lose>5 kg in the
Union Seventh Framework Program (FP7/2007–
2013) under grant agreement number 266408.
past 6 months), no use of medication (except aspirin/paracetamol and oral contraceptives) and no current alcohol consumption of>28 units per week. We excluded participants who scored
above average on restraint eating (restraint eating subscale score of the DEBQ could not exceed 2.89 for males and 3.39 for females)[37], since this characteristic is known to influence food relationships [38]. Furthermore, common fMRI exclusion criteria (e.g. claustrophobia, preg-nancy and metal implants in the body) and criteria that might influence response to food cues (e.g. food allergies, special diets, eating disorders, gastrointestinal disorders or metabolic or endocrine disease) were used. In addition, runs with any single movement greater than 4 mm translation or 4 degrees rotation were excluded. From the original sample (N = 42), subjects meeting one of the following criteria were excluded for the current analysis: nausea (self-report
>5 on a 9-point Likert scale) after test meal consumption (N = 8), too much hunger
(self-report>5 on a 9-point Likert scale) after test meal consumption (N = 1) or prior to the scan
(N = 4) and<10 high and low calorie choices during the forced choice fMRI task (N = 10). No
subjects had to be excluded for excessive movement (SeeS1 Tablefor more details). The 19 remaining participants (9 males, 10 females; age (Mean, SD) = 25.4 ± 5.1; BMI (Mean, SD) = 22 ± 1.6; DEBQ dietary restraint (Mean ± SD): males = 1.82 ±0.66; females = 2.41 ± 0.49) were examined in this study.
Experimental design
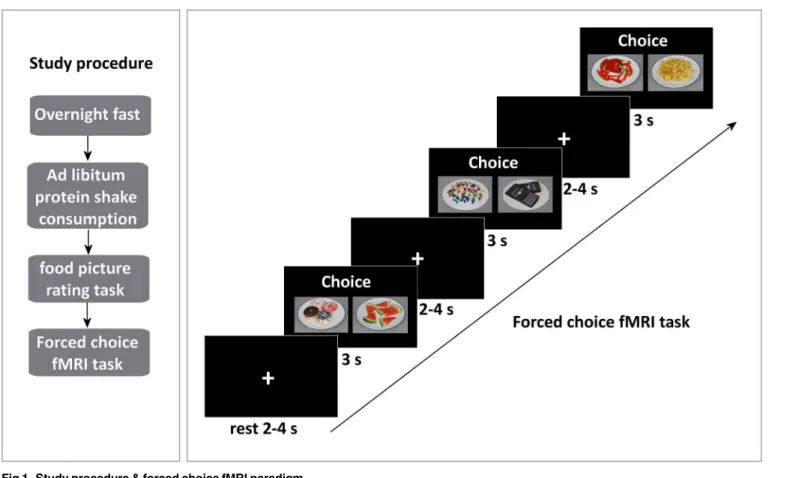
The study consisted of one MRI scan session conducted in the morning. Subjects were scanned after an overnight fast (10h) after consumption of an ad libitum test meal (a commercially available drink called Nutridrink from Nutricia, seeS2 Tablefor more details). They provided hunger and fullness ratings before and after test meal consumption. These served to ensure that their hunger decreased after test meal consumption. The amount of protein shake con-sumed ranged from 117–631 ml (Mean, SD = 449.7 ± 170.9 ml). Hunger ratings decreased and fullness ratings increased significantly after protein shake consumption (9-point Likert scale measurements: pre-meal hunger (Mean, SD) = 6.1±1.8; after meal hunger (Mean, SD) = 2.1 ± 1.1; and pre-meal fullness (Mean, SD) = 2.5±1.2; after meal fullness (Mean, SD) = 7.2 ± 1.5).
Before the scan, participants conducted a computerized food picture rating task (based on [31]). Subsequently, the participants underwent a 30-min MRI scan session. The first func-tional run consisted of a food and non-food viewing task, the second consisted of a forced choice task. In this paper we report the results of the forced choice task (seeFig 1).
Tasks
Stimuli. The stimuli used in this study were 96 food and 51 non-food images custom-made for this study. The food image set contained mostly snacks, ready for consumption, with-out package and brand information. The foods can be divided into two categories: high calorie and low calorie images (including both sweet and savoury items). Each food was presented on a plate, filled with the food. The plates were shown on a standardized background. To ensure the background was identical for every picture, each plate was registered to a standardized background with the use of MeVisLab (MeVis Medical Solutions AG, Bremen, Germany) and Elastix [39]. The non-foods were office utensils, depicted in a similar way as the food items, on a white round piece of paper instead of a plate.
categories (including both sweet and savoury items). All images are freely available on request, seeS1 PDFfor an overview of all images used in this study. Each food picture was shown for 3 seconds (which was similar to the time the participants had to choose during the forced choice fMRI task). After that the following questions were asked:‘How much do you like the product?’
(1 not at all—9 very much),‘How many calories do you think this product consists of?’(1 very few calories—9 many calories) and‘How healthy do you think this product is?’(1 not healthy at all—9 very healthy). The participants received the following instruction:‘Try to answer the questions as quickly as possible. There are no correct or incorrect answers, it's about your opin-ion. Don't think too long about an answer, the first answer that occurs to you is usually the best one’.
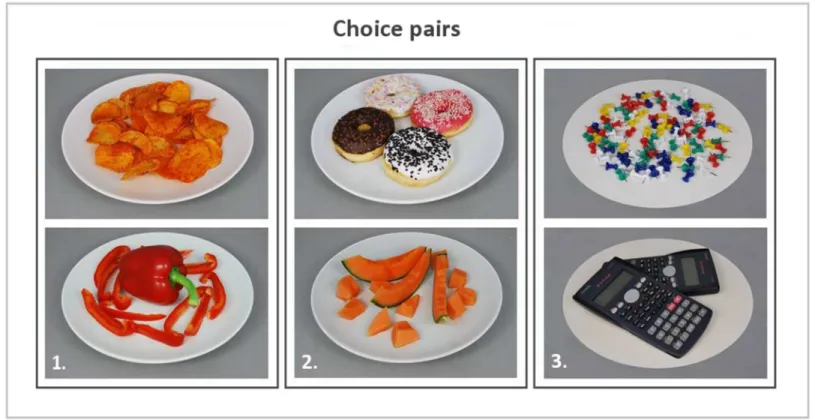
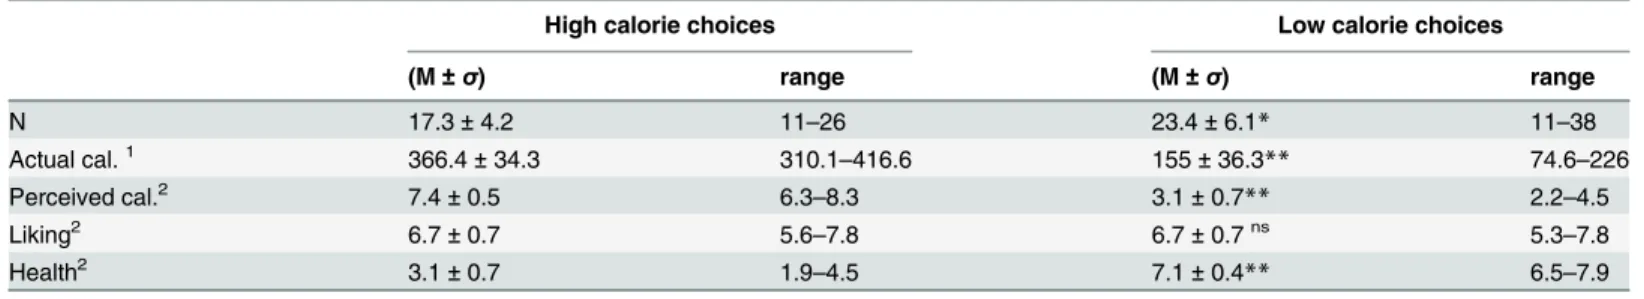
Forced choice fMRI task. Based on the ratings collected during the food picture rating task, food pairs were created for each subject. Food pairs were matched on liking (i.e. equal rat-ings or plus/minus 1 on a 9-point scale) and taste (i.e. sweet or savoury), to make the pairs as equal as possible, but differed in caloric content (i.e. a minimum of 2 points difference on a 9-point scale) (seeFig 2). Each pair was unique although a picture could appear in several food pairs (repetition (means, SD) = 1.17 ± 0.08; range = 1–2). To check whether our manipulations were successful, mean actual caloric content (kcal), perceived caloric content (9-point Likert scale), healthiness (9-point Likert scale) and mean liking (9-point Likert scale) were calculated. As expected, all variables except liking, differed significantly between the choice options within a food choice pair (Table 1). Hence, the study manipulations were effective. The participants were verbally giving the following instructions:”choose the product of which you most want to eat at this moment”, whenever a food pair appeared, and“choose one of the products”, when a Fig 1. Study procedure & forced choice fMRI paradigm.
non-food pair appeared (without giving any direction or further instructions). In addition to the verbal instruction, each question was shown above every choice pair. Subjects had 3 sec-onds to indicate their choice. Whenever a subject failed to make a choice within the restricted time, the event was labelled as a missed choice. The choice pairs were projected on a screen with a projector. The subjects viewed the images via a mirror attached to the headcoil. The stimuli were presented in the scanner by using the PRESENTATION software (Neurobeha-vioral Systems Inc., Albany, CA).The mean ± SD scan duration of the forced choice task was 508 ± 30s. The length of this scan varied between participants due to the variable number of food pairs (Mean ± SD = 40.7 ± 4.8; range = 28–49 food pairs) that could be created per indi-vidual. Furthermore, food choices were alternated with non-food choices (i.e., choices between Fig 2. Example of choice pairs.1: High & low calorie food pair, savoury taste; 2: High & low calorie food pair, sweet taste; 3: Non-food pair.
doi:10.1371/journal.pone.0131727.g002
Table 1. High and low calorie choice options.
High calorie pictures Low calorie pictures
(M±σ) range (M±σ) range
Actual cal.1 376.2±13 358.4
–412 151±26.1** 99.9–193.5
Perceived cal.2 7.5±0.6 6.3–8.4 3.1±0.6** 2.1–4.6
Liking2 6.7±0.7 5.3
–7.5 6.7±0.6ns 5.4
–7.5
Health2 3.0±0.7 2
–4.6 7.1±0.4** 6.3–7.9
**Differences between high& low calorie pictures were significant p<0.001
nsDifferences between high& low calorie pictures were not signi
ficant
1Actual caloric content kcal per 100 grams 29-point Likert scale.
office utensils) to serve as a control condition and to avoid adaptation to the food stimuli. After each choice a fixation cross of variable length (2–4 s), was shown.
Image acquisition and preprocessing
Scans were performed with a 3 Tesla Philips Achieva MRI scanner (Philips Healthcare, Best, The Netherlands) using an 8-channel SENSE head coil. A high resolution anatomical image (T¹-weighted scan) was acquired at 1 x 1 x 1 mm resolution (TR = 8.4 ms, total scan dura-tion = 473 s). Funcdura-tional scans were acquired with a T²-weighted gradient-echo 2D-EPI
sequence (TR/TE = 1400/23 ms, flip angle = 72.5°, voxel size = 4 x 4 x 4 mm, FOV = 208 × 119.6 x 256 mm, dynamic scan duration = 1400 ms). Six dummy volumes were automatically discarded. The total number of volumes collected varied between participants due to the differ-ent number of food choice pairs that could be generated (range: 295–400 volumes). Data pro-cessing was performed with the SPM8 software package (Wellcome Department of Imaging Neuroscience, London, United Kingdom, (http://www.fil.ion.ucl.ac.uk/spm/software/spm8/) run with MATLAB R2012a (The MathworksInc, Natick, MA). The functional images were realigned to the first image. Subsequently, the functional images and the anatomical images were coregistered and normalized to MNI space (Montreal Neurological Institute– Interna-tional Consortium for Brain Mapping). In addition, the funcInterna-tional images were smoothed with a Gaussian kernel of 8 mm full width at half maximum (FWHM). The mean functional images were visually inspected for artefacts. Furthermore, the realignment parameters of all subjects were also examined.”
Behavioral data analyses
The behavioral data were analyzed with SPSS statistics 19. The self-report ratings on a 9-point Likert scale (i.e. liking, perceived caloric content and perceived healthiness), actual caloric con-tent, the number of high and low calorie choices made and reaction times (RTs) were normally distributed. Differences in liking, perceived caloric content, actual caloric content and healthi-ness between the high and low calorie choice options, the choices made and RTs were analyzed by using paired t-tests. In addition, the percentage of high and low calorie choices made was examined by using a one-sample t-test.
fMRI analyses
The following five conditions were modeled: high calorie food choice, low calorie food choice, non-food choice, spare choices and missed choices. Because participants were free to choose, the number of high and low calorie choices was unequal for most participants (range number high calorie choices = 11–26; range number low calorie choices = 11–38). To control for this bias, balanced designs were created by selecting equal number of choices per condition of inter-est per subject. In addition, the choices used for this analysis were selected based on a mini-mum of 2 points difference in the individual caloric content ratings on a 9 point Likert scale (to ensure each food pair differed in perceived caloric content). The choices that did not meet this criterion, in addition to spare choices (i.e. rest choices due to equal number of choice selection) and missed choices, were modeled as separate conditions.
The statistical parametric map generated of the HCC-LCC contrast, was thresholded at p<0.001 uncorrected for multiple comparisons with a cluster-extent k = 20 [40]. The
statisti-cal parametric maps statisti-calculated for the single conditions (i.e. HCC and LCC) were thresholded more conservatively (p<0.05 FWE corrected for multiple comparisons at whole brain level,
k = 10) since these conditions were contrasted against rest.
Food vs non-food choices. For the food choice versus non-food choice analysis, equal numbers of food choices (containing both high & low calorie choices) and non-food choices were selected (range 19–26 choices per category). On first level (single subject analysis) the food choice versus non-food choice contrast was created. On second level (group analysis) a one sample t-test was performed to establish the brain regions that are differentially activated by food and nonfood choices. The generated statistical parametric map was thresholded at p<0.001 uncorrected for multiple comparisons, k = 20 [40].
Results
Behavioral data
Overall, the participants chose significantly more low calorie than high calorie foods (LCC percentage (Mean, SD) = 57% ± 11.3%; t = 2.75; p = 0.013). Because all liking ratings were included in the creation of the food choice pairs, liked, neutral but also disliked pairs could be present. To check whether the choices made per category did not differ significantly in liking a paired sample t-tests was conducted. We found no significant difference in liking ratings between high and low calorie choices (seeTable 2). See for more detailed ratings per subject,S3 Table. Furthermore, the RT’s of the high calorie choices were significantly larger than the RT’s of the low calorie choices (RT HCC (Mean, SD) = 1.6 s ± 0.4 s; RT LCC (Mean, SD) = 1.5 ± 0.3; t = 2.45; p = 0.025).
fMRI data
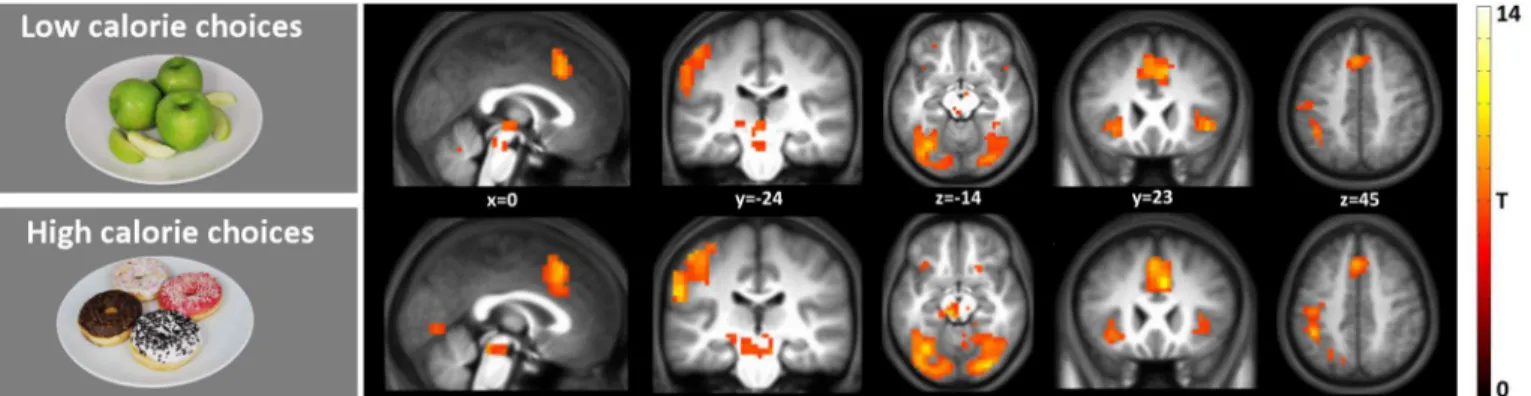
High calorie & low calorie choices vs baseline. Fig 3shows the results of the single food contrasts (i.e. high calorie choice and low calorie choice versus baseline) (p<0.05 FWE
cor-rected, k = 10) are shown. This figure clearly shows the similarity of the brain activation pattern during high and low calorie choice. Regions that were stronger activated compared with rest in both high and low calorie choice include the midbrain, insula, supplemental motor area, Table 2. High and low calorie choices.
High calorie choices Low calorie choices
(M±σ) range (M±σ) range
N 17.3±4.2 11–26 23.4±6.1* 11–38
Actual cal.1 366.4±34.3 310.1
–416.6 155±36.3** 74.6–226
Perceived cal.2 7.4±0.5 6.3
–8.3 3.1±0.7** 2.2–4.5
Liking2 6.7±0.7 5.6–7.8 6.7±0.7ns 5.3–7.8
Health2 3.1±0.7 1.9
–4.5 7.1±0.4** 6.5–7.9
*Difference between high & low calorie choices were significant p = 0.011 **p<0.0001
nsDifference between high & low calorie pictures were not signi
ficant
1Actual caloric content kcal per 100 grams 29-point Likert scale.
middle cingulate gyrus and several visual areas. SeeS4andS5Tables for all the MNI peak coordinates.
High calorie vs low calorie choices. Few differences were found between high versus low calorie food choices (p<0.001 uncorrected, cluster extent threshold k = 20). Significantly
stron-ger activation was found in the posterior part of the right superior temporal sulcus (SeeFig 4; MNI peak coordinate (62, -36, 22); T = 4.32; Z = 3.53) for high versus low calorie choice. This activation did not correlate (pearson r = 0.098, p = 0.691) with the differences in RT’s for the high and low calorie choices (reported in the Behavioural data section). No differences were found in the low compared with high calorie food choice contrast (p<0.001 uncorrected,
clus-ter extent threshold k = 20).
Fig 3. Brain regions with stronger activation in response to HCC and LCC vs baseline.Shown is a T-map thresholded at P<0.05 (FWE-corrected;
T>6.25), superimposed on the mean anatomical image of all subjects (MNI-space).
doi:10.1371/journal.pone.0131727.g003
Fig 4. Mean parameter estimates, peak coordinate (62. -36. 22) of the brain region with stronger activation in response to HCC versus LCC.Shown is a T-map for visualization thresholded at T = 3.5 p<0.001 uncorrected for multiple comparisons, superimposed on the mean anatomical image of all
subjects (MNI-space).
Food vs non-food choices. In addition, differences between food and non-food choices in the absence of hunger (p<0.001 uncorrected, cluster extent threshold k = 20), were
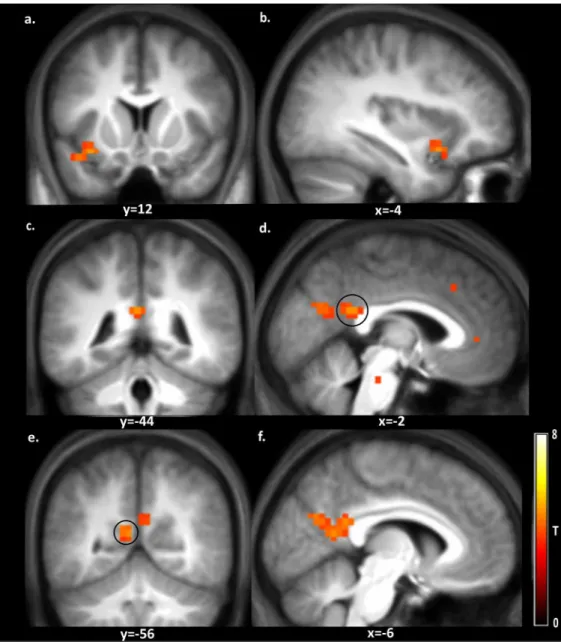
investi-gated. The results are depicted inFig 5and the peak coordinates are given inTable 3. Several brain regions, including the insula, posterior cingulate gyrus, cuneus, precuneus and superior temporal gyrus, were stronger activated during food choice (p<0.001 uncorrected, k = 20). In
addition the overlap between the food versus non-food choices and the individual contrasts high calorie food choices vs rest and low calorie-food choices vs rest were examined.The left insula was active in all three contrasts (seeS1 Figfor more details).
Fig 5. Brain regions with stronger activation in response to food choice versus non-food choice.
Shown is a T-map thresholded for visualization purposes at p<0.001 uncorrected for multiple comparisons (T>3.6), superimposed on the mean anatomical image of all subjects. a: L, insula and L, superior temporal sulcus; b: L, superior temporal sulcus; c & d: L, posterior cingulate gyrus; e: L, precuneus; f: L, precuneus & L, cuneus; See corresponding peak coordinates inTable 3.
Discussion
We investigated brain responses during food choices between foods matched on liking but dif-fering in caloric content in the absence of hunger. Although the participants were not above average dietary restraint, not dieting and had a stable weight, they made more low compared to high calorie food choices. In addition, the RTs were higher for the high calorie choices com-pared to the low calorie choices. We speculate that the subjects in this study choose more low calorie foods because they were in a fed state and were presented with equally liked foods. In this scenario, the low calorie option was, physiologically, the best option to choose to maintain a stable weight.
Brain regions which elicited stronger activation during high and low calorie choice com-pared to rest include the midbrain, insula, supplemental motor area, middle cingulate gyrus and several regions involved in visual processing. While, the posterior part of the right superior temporal sulcus (STS), was the only region found to be more active during high compared with low calorie choice matched on liking in healthy sated normal-weight volunteers. In addition, this activation did not correlate with the differences in RTs between the high and low calorie choices.
The superior temporal sulcus is thought to be a multifunctional region. The literature on this region is characterized by a large variety of cognitive studies in different fields, ranging from facial recognition to social cognition and theory of mind [41]. Studies investigating face processing have compared brain responses to faces with abstract images having similar con-tours e.g., Narumoto et al. [42]. In these studies, the right STS is more activated during emo-tional face expressions (as fear, sadness and happiness). Effects of attention on STS activation have also been reported [43]. Finally, the right posterior STS has been found to be more active during viewing of highly palatable foods versus moderate palatable foods in unrestraint volun-teers of normal weight in a fasted state [17]. Although the region that has been reported in Col-letta et al., is a different part of the STS than we found (most likely due to the different nature of the task used), it is interesting and suggests that the right posterior STS is not only involved in the processing of faces and emotion but also in other biological relevant processes such as high calorie food evaluation and choice. High calorie food choice is an especially biologically relevant process as these foods are highly energy-dense. Interestingly, the difference in right posterior STS activation seems to be independent of state and palatability since its activation was found in both the hungry state [17] and in our fed state controlled for liking. This suggests that the right posterior STS activation may reflect a food’s biological relevance, irrespective of satiety and independent of food preference. However, to obtain more insight in the exact Table 3. Brain regions with stronger activation in response to food choices versus non-food choices.
Peak MNI-coordinates (mm)
Region k x y z T Z
L, insula (a) 21 -34 12 -14 4.77 3.79
L, superior temporal sulcus (a,b) -42 12 -18 4.31 3.53
L, posterior cingulate gyrus (c,d) 67 -2 -44 22 4.70 3.75
L, precuneus (e,f) -6 -56 14 4.64 3.72
L, cuneus (f) -6 -68 26 4.44 3.60
Peaks are reported for all clusters20 voxels at p<0.001 uncorrected for multiple comparisons; L = left and R = right hemisphere; The regions a-f are depicted inFig 5.
function of the STS in food choice and how this may be modulated by hunger and satiety, more research is needed.
Futhermore, we examined the differences between food and non-food choices. We found increased activation in the left insula, left superior temporal sulcus, left posterior cingulate gyrus and left (pre)cuneus, in response to food compared with non-food choices.
The insula is known for its involvement in value-based decision making. It integrates inter-nal state and sensory siginter-nals and is important during response selection. In addition, it inte-grates information about the salience and relative value of stimuli [44]. Previous studies found significantly stronger activation in both the left insula and left posterior cingulate gyrus during food viewing tasks [18]. Both the insula [45–48] and the left posterior cingulate gyrus [49–52], were also found to be active during choice valuation tasks. Furthermore, activation in the pos-terior cingulate gyrus has been found to correlate with monetary reward magnitude [49–51] and willingness to pay for primary rewards (e.g. food) [52]. Although in our study the foods were most likely devaluated due to satiety, insula activation and posterior cingulate gyrus acti-vation found in food viewing studies and choice valuation studies suggest that, despite a low motivation to eat, food items were more salient than non-food items. Other studies support this view and showed that non-food stimuli attract less attention than food images in both eye tracking [35,36] and neuroimaging studies using visual food cues [12,18].
During food choice, activation in the (pre)-cuneus and the left superior temporal sulcus was also increased. The precuneus is especially known for its involvement in attention [53,54]. This suggests that the increased activation in the precuneus reflects increased attention for the food pairs compared with the non-food pairs. The left STS is involved in simple moral decisions ver-sus semantic decisions [55]. Increased activation in this region during food choice compared with non-food choice might reflect the different nature of the choices made, namely simple decisions between two office utensils versus more complex decisions between which food one would most want to eat.
In conclusion, we observed increased insula, posterior cingulate gyrus and precuneus activa-tion during food choice versus non-food choice. This suggests that the food stimuli were more salient than the non-food stimuli despite the low motivation to eat. In addition, in line with our hypothesis, we did not find major differences between high versus low calorie choices between equally-liked food items in the absence of hunger. The right superior temporal sulcus was the only region found to be stronger activated during high calorie compared with low calo-rie choice independent of liking. Together with previous studies, this may suggest that right STS activation during food evaluation and choice reflects the food’s biological relevance inde-pendent of food preference. This novel finding warrants further research into the effects of hunger state and weight status on right STS, which may provide a marker of biological relevance.
Supporting Information
S1 Fig. Overlapping brain regions during food choice vs non-food choice, high calorie choice and low calorie choice.Shown are binary thresholded T-maps, superimposed on the mean anatomical image of all subjects. a: thresholded T-map during food vs non-food choice; b:thresholded T-map during high calorie choice; c: thresholded T-map during low calorie choice; d: All three thresholded T-maps. In purple overlap between FC-NFC and HCC, in yel-low overlap between HCC and LCC and in white (indicated by the black circle) overlap in all three T-maps in the left insula at MNI (-33, 14, -10).
S1 PDF. Overview of food stimuli. (PDF)
S1 Table. Movement. (DOCX)
S2 Table. Energy content of the test meal (Nutridrink). (DOCX)
S3 Table. High and low calorie choice ratings per subject. (DOCX)
S4 Table. Brain regions with stronger activation in response to low calorie food choice with stronger activation in response to low calorie food choices.
(DOCX)
S5 Table. Brain regions with stronger activation in response to high calorie food choice. (DOCX)
Acknowledgments
This study was part of the Full4Health project (www.full4health.eu), funded by the European Union Seventh Framework Program (FP7/2007‐2013) under grant agreement nr. 266408. We acknowledge Michiel F. Steman for the questionnaire website construction, creating the choice task script and providing technical support. We acknowledge Jean-Paul Charbonnier for assis-tance with the choice task script development. We acknowledge Marijn van Stralen for creating a script to standardize the product pictures. We acknowledge MeVis Medical Solutions AG (Bremen, Germany) for the use of MeVisLab in standardization of the product pictures.
Author Contributions
Conceived and designed the experiments: LC PAMS. Performed the experiments: LC. Ana-lyzed the data: LC PAMS. Contributed reagents/materials/analysis tools: PS. Wrote the paper: LC PAMS. Provided to the final version of the manuscript by interpreting results, reviewing and critically revising text: LNvdL MAV. Participated in the development of the picture rating task: LNvdL.
References
1. McLellan F (2002) Obesity rising to alarming levels around the world. Lancet 359: 1412. PMID: 11978348
2. Epstein LH, Leddy JJ (2006) Food reinforcement. Appetite 46: 22–25. PMID:16257474
3. Mela DJ (2006) Eating for pleasure or just wanting to eat? Reconsidering sensory hedonic responses as a driver of obesity. Appetite 47: 10–17. PMID:16647788
4. Peters JC, Wyatt HR, Donahoo WT, Hill JO (2002) From instinct to intellect: the challenge of maintain-ing healthy weight in the modern world. Obes Rev 3: 69–74. PMID:12120422
5. Saper CB, Chou TC, Elmquist JK (2002) The need to feed: homeostatic and hedonic control of eating. Neuron 36: 199–211. PMID:12383777
6. Berthoud HR (2006) Homeostatic and non-homeostatic pathways involved in the control of food intake and energy balance. Obesity (Silver Spring) 14 Suppl 5: 197S–200S.
7. Smeets PA, Charbonnier L, van Meer F, van der Laan LN, Spetter MS (2012) Food-induced brain responses and eating behaviour. Proceedings of the Nutrition Society 71: 511–520. doi:10.1017/ S0029665112000808PMID:22931854
9. Stoeckel LE, Weller RE, Cook EW 3rd, Twieg DB, Knowlton RC, Cox JE (2008) Widespread reward-system activation in obese women in response to pictures of high-calorie foods. Neuroimage 41: 636–
647. doi:10.1016/j.neuroimage.2008.02.031PMID:18413289
10. Toepel U, Knebel JF, Hudry J, le Coutre J, Murray MM (2009) The brain tracks the energetic value in food images. Neuroimage 44: 967–974. doi:10.1016/j.neuroimage.2008.10.005PMID:19013251
11. LaBar KS, Gitelman DR, Parrish TB, Kim Y- H, Nobre AC, Mesulam MM (2001) Hunger selectively modulates corticolimbic activation to food stimuli in humans. Behavioral Neuroscience 115: 493–500. PMID:11345973
12. Smeets PA, Kroese FM, Evers C, de Ridder DT (2013) Allured or alarmed: counteractive control responses to food temptations in the brain. Behav Brain Res 248: 41–45. doi:10.1016/j.bbr.2013.03. 041PMID:23578759
13. Killgore WD, Young AD, Femia LA, Bogorodzki P, Rogowska J, Yurgelun-Todd DA (2003) Cortical and limbic activation during viewing of high- versus low-calorie foods. Neuroimage 19: 1381–1394. PMID: 12948696
14. Toepel U, Knebel JF, Hudry J, le Coutre J, Murray MM (2010) Advantageous Object Recognition for High-Fat Food Images. In: Montmayeur JP, le Coutre J, editors. Fat Detection: Taste, Texture, and Post Ingestive Effects. Boca Raton (FL).
15. Siep N, Roefs A, Roebroeck A, Havermans R, Bonte ML, Jansen A (2009) Hunger is the best spice: an fMRI study of the effects of attention, hunger and calorie content on food reward processing in the amygdala and orbitofrontal cortex. Behav Brain Res 198: 149–158. doi:10.1016/j.bbr.2008.10.035 PMID:19028527
16. Frank S, Laharnar N, Kullmann S, Veit R, Canova C, Hegner YL, et al. (2010) Processing of food pic-tures: influence of hunger, gender and calorie content. Brain Res 1350: 159–166. doi:10.1016/j. brainres.2010.04.030PMID:20423700
17. Coletta M, Platek S, Mohamed FB, van Steenburgh JJ, Green D, Lowe MR (2009) Brain activation in restrained and unrestrained eaters: an fMRI study. Journal of abnormal psychology 118: 598. doi:10. 1037/a0016201PMID:19685956
18. van der Laan LN, de Ridder DT, Viergever MA, Smeets PA (2011) The first taste is always with the eyes: a meta-analysis on the neural correlates of processing visual food cues. Neuroimage 55: 296–
303. doi:10.1016/j.neuroimage.2010.11.055PMID:21111829
19. Rothemund Y, Preuschhof C, Bohner G, Bauknecht H- C, Klingebiel R, Flor H, et al. (2007) Differential activation of the dorsal striatum by high-calorie visual food stimuli in obese individuals. Neuroimage 37: 410–421. PMID:17566768
20. Piech RM, Lewis J, Parkinson CH, Owen AM, Roberts AC, Downing PE, et al. (2010) Neural correlates of affective influence on choice. Brain and Cognition 72: 282–288. doi:10.1016/j.bandc.2009.09.012 PMID:19857920
21. Uher R, Treasure J, Heining M, Brammer MJ, Campbell IC (2006) Cerebral processing of food-related stimuli: Effects of fasting and gender. Behavioural Brain Research 169: 111–119. PMID:16445991
22. Hare TA, Malmaud J, Rangel A (2011) Focusing attention on the health aspects of foods changes value signals in vmPFC and improves dietary choice. J Neurosci 31: 11077–11087. doi:10.1523/ JNEUROSCI.6383-10.2011PMID:21795556
23. Born JM, Lemmens SG, Martens MJ, Formisano E, Goebel R, Westerterp-Plantenga MS (2011) Differ-ences between liking and wanting signals in the human brain and relations with cognitive dietary restraint and body mass index. Am J Clin Nutr 94: 392–403. doi:10.3945/ajcn.111.012161PMID: 21653801
24. Grabenhorst F, Schulte FP, Maderwald S, Brand M (2013) Food labels promote healthy choices by a decision bias in the amygdala. Neuroimage 74: 152–163. doi:10.1016/j.neuroimage.2013.02.012 PMID:23428568
25. Levy DJ, Glimcher PW (2011) Comparing apples and oranges: using reward-specific and reward-gen-eral subjective value representation in the brain. J Neurosci 31: 14693–14707. doi:10.1523/ JNEUROSCI.2218-11.2011PMID:21994386
26. Plassmann H, O'Doherty JP, Rangel A (2010) Appetitive and aversive goal values are encoded in the medial orbitofrontal cortex at the time of decision making. J Neurosci 30: 10799–10808. doi:10.1523/ JNEUROSCI.0788-10.2010PMID:20702709
27. Linder NS, Uhl G, Fliessbach K, Trautner P, Elger CE, Weber B (2010) Organic labeling influences food valuation and choice. Neuroimage 53: 215–220. doi:10.1016/j.neuroimage.2010.05.077PMID: 20570738
29. Van der Laan LN, De Ridder DT, Viergever MA, Smeets PA (2012) Appearance matters: neural corre-lates of food choice and packaging aesthetics. PLoS One 7: e41738. doi:10.1371/journal.pone. 0041738PMID:22848586
30. Griffioen-Roose S, Finlayson G, Mars M, Blundell JE, de Graaf C (2010) Measuring food reward and the transfer effect of sensory specific satiety. Appetite 55: 648–655. doi:10.1016/j.appet.2010.09.018 PMID:20870002
31. Finlayson G, King N, Blundell JE (2007) Is it possible to dissociate 'liking' and 'wanting' for foods in humans? A novel experimental procedure. Physiol Behav 90: 36–42. PMID:17052736
32. Finlayson G, King N, Blundell J (2008) The role of implicit wanting in relation to explicit liking and want-ing for food: implications for appetite control. Appetite 50: 120–127. PMID:17655972
33. Shomaker LB, Tanofsky-Kraff M, Zocca JM, Courville A, Kozlosky M, Columbo KM, et al. (2010) Eating in the absence of hunger in adolescents: intake after a large-array meal compared with that after a stan-dardized meal. Am J Clin Nutr 92: 697–703. doi:10.3945/ajcn.2010.29812PMID:20720255
34. Fisher JO, Birch LL (2002) Eating in the absence of hunger and overweight in girls from 5 to 7 y of age. Am J Clin Nutr 76: 226–231. PMID:12081839
35. Castellanos EH, Charboneau E, Dietrich MS, Park S, Bradley BP, Mogg K, et al. (2009) Obese adults have visual attention bias for food cue images: evidence for altered reward system function. Interna-tional Journal of Obesity 33: 1063–1073. doi:10.1038/ijo.2009.138PMID:19621020
36. Nijs IM, Muris P, Euser AS, Franken IH (2010) Differences in attention to food and food intake between overweight/obese and normal-weight females under conditions of hunger and satiety. Appetite 54: 243–254. doi:10.1016/j.appet.2009.11.004PMID:19922752
37. Van Strien T, Frijters JE, Bergers G, Defares PB (1986) The Dutch Eating Behavior Questionnaire (DEBQ) for assessment of restrained, emotional, and external eating behavior. International Journal of Eating Disorders 5: 295–315.
38. Fedoroff I, Polivy J, Herman CP (2003) The specificity of restrained versus unrestrained eaters' responses to food cues: general desire to eat, or craving for the cued food? Appetite 41: 7–13. PMID: 12880616
39. Klein S, Staring M, Murphy K, Viergever MA, Pluim JP (2010) Elastix: a toolbox for intensity-based med-ical image registration. Medmed-ical Imaging, IEEE Transactions on 29: 196–205.
40. Lieberman MD, Cunningham WA (2009) Type I and Type II error concerns in fMRI research: re-balanc-ing the scale. Soc Cogn Affect Neurosci 4: 423–428. doi:10.1093/scan/nsp052PMID:20035017
41. Hein G, Knight RT (2008) Superior temporal sulcus—it's my area: or is it? Journal of Cognitive Neuro-science 20: 2125–2136. doi:10.1162/jocn.2008.20148PMID:18457502
42. Narumoto J, Okada T, Sadato N, Fukui K, Yonekura Y (2001) Attention to emotion modulates fMRI activity in human right superior temporal sulcus. Cognitive Brain Research 12: 225–231. PMID: 11587892
43. Pessoa L, McKenna M, Gutierrez E, Ungerleider L (2002) Neural processing of emotional faces requires attention. Proceedings of the National Academy of Sciences 99: 11458–11463.
44. Paulus MP, Stein MB (2006) An insular view of anxiety. Biol Psychiatry 60: 383–387. PMID:16780813
45. Knutson B, Rick S, Wimmer GE, Prelec D, Loewenstein G (2007) Neural predictors of purchases. Neu-ron 53: 147–156. PMID:17196537
46. Kim H, Shimojo S, O'Doherty JP (2011) Overlapping responses for the expectation of juice and money rewards in human ventromedial prefrontal cortex. Cereb Cortex 21: 769–776. doi:10.1093/cercor/ bhq145PMID:20732900
47. FitzGerald TH, Seymour B, Dolan RJ (2009) The role of human orbitofrontal cortex in value comparison for incommensurable objects. J Neurosci 29: 8388–8395. doi:10.1523/JNEUROSCI.0717-09.2009 PMID:19571129
48. Kang MJ, Rangel A, Camus M, Camerer CF (2011) Hypothetical and real choice differentially activate common valuation areas. J Neurosci 31: 461–468. doi:10.1523/JNEUROSCI.1583-10.2011PMID: 21228156
49. Knutson B, Adams CM, Fong GW, Hommer D (2001) Anticipation of increasing monetary reward selec-tively recruits nucleus accumbens. J Neurosci 21: RC159. PMID:11459880
50. Knutson B, Fong GW, Bennett SM, Adams CM, Hommer D (2003) A region of mesial prefrontal cortex tracks monetarily rewarding outcomes: characterization with rapid event-related fMRI. Neuroimage 18: 263–272. PMID:12595181
52. Plassmann H, O'Doherty J, Rangel A (2007) Orbitofrontal cortex encodes willingness to pay in every-day economic transactions. J Neurosci 27: 9984–9988. PMID:17855612
53. Stoll M, Baecke S, Kenning P (2008) What they see is what they get? An fMRI‐study on neural corre-lates of attractive packaging. Journal of Consumer Behaviour 7: 342–359.
54. Cavanna AE, Trimble MR (2006) The precuneus: a review of its functional anatomy and behavioural correlates. Brain 129: 564–583. PMID:16399806