Rafael Moreira ClaroI
Heron Carlos Esvael do CarmoII Flávia Mori Sarti MachadoIII Carlos Augusto MonteiroI
I Núcleo de Pesquisas Epidemiológicas em Nutrição e Saúde. Universidade de São Paulo (USP). São Paulo, SP, Brasil II Departamento de Economia. Faculdade de
Economia e Administração. USP. São Paulo, SP, Brasil
III Gestão de Políticas Públicas. Escola de Artes, Ciências e Humanidades. USP. São Paulo, SP, Brasil
Correspondence: Rafael Moreira Claro Departamento de Nutrição Av. Dr. Arnaldo, 715
01246-904 São Paulo, SP, Brasil E-mail: rclaro@usp.br Received: 1/8/ 2007 Reviewed: 4/11/2007 Approved: 5/9/2007
Income, food prices, and
participation of fruit and
vegetables in the diet
ABSTRACT
OBJECTIVE: To analyze the influence of income and food prices on household consumption of fruit and vegetables.
METHODS: Data from the 1998/99 Household Budget Survey were analyzed, which was conducted by the Fundação Instituto de Pesquisas Econômicas (Institute for Economic Research Foundation) in the city of São Paulo, Brazil. The infl uence of income and food price on the relative participation of fruit and vegetables in the total household calorie intake was studied using regression analysis to estimate elasticity coeffi cients.
RESULTS: There was an increase in participation of fruit and vegetables in total household calorie purchases along with the recorded decrease in prices, increase in family income, and increase in prices of other foods. A one percent decrease in the price of fruit and vegetables would lead to a 0.2% increase in the participation of these items in the total calorie content; a 1% increase in the price of other foods would increase fruit and vegetable participation by 0.07%; and a 1% increase in family income would increase participation by 0.04%. The effect of the prices of other foods was less intense in higher income groups, and in the other two scenarios we were unable to identify consistent income-associated patterns.
CONCLUSIONS: A reduction in the price of fruit and vegetables, which can be achieved by means of public policies, could lead to an increase in fruit and vegetable intake in households in São Paulo and in other cities with similar scenarios.
KEY WORDS: Diet, economics. Food habits. Food. Income. Feeding. Nutrition programmes and policies.
INTRODUCTION
In the past few decades, conditions favoring the occurrence of nutritional
de-fi ciencies gradually gave way to an epidemic of obesity and chronic diseases related to excessive and unbalanced food consumption.19 The dietary pattern associated with obesity and other chronic diseases is characterized essentially by the insuffi cient consumption of fruit and vegetables (FV), accompanied by the excessive intake of foods with high energy density and rich in fat, sugar, and salt.19 The World Health Organization (WHO) estimates that approxima-tely 2.7 million deaths per year worldwide can be attributed to inadequate consumption of FV, and such inadequacy is considered one of the ten major factors determining the global burden of disease.18
equivalent to 6-7% of the total calories in a 2.300 kcal/day diet.* In Brazil, household availability of FV, based on data from the 2002-2003 Household Budget Survey (HBS), carried out by the Instituto Brasileiro
de Geografi a e Estatística (Brazilian Institute of
Geo-graphy and Statistics – IBGE), was estimated in 2.3% of total calorie consumption. Availability is less than ideal throughout all the country’s geographical regions, and across all economic strata.9
The HBSs conducted by the Fundação Instituto de Pesquisas Econômicas da Universidade de São Pau-lo (University of São Paulo Institute for Economic Research Foundation – FIPE-USP) since the 1970’s are an important tool for studying changes in dietary habits in the population of the city of São Paulo. The HBS-FIPE, carried out approximately every ten years (1971/1972; 1981/1982; 1990/1991, and 1998/1999), collects detailed information on household budgets. The aim of these surveys is to update the methodology used for calculating the Consumer Price Index (CPI) for the municipality of São Paulo.3 Even without di-rectly evaluating individual food consumption – the survey evaluates household availability instead – the data generated are useful for characterizing the dietary patterns of families and the relationship between food consumption and socioeconomic variables.13
The objective of the present study was to examine the infl uence of income and food prices on the participation of FV in household food consumption.
METHODS
The 1998-1999 HBS-FIPE took place between May 1998 and June 1999, and interviewed a sample of 2.351 households (7.980 individuals) in the municipality of São Paulo, Brazil. The sampling strategy followed the procedures adopted in the previous HBS-FIPE, and is described in detail in the original publication.3
Brie-fl y, this strategy was based on a simple probabilistic sample, households being randomly selected from the records of the local energy company. Data were com-plemented by a database containing information on the municipality’s slums, elaborated by the Secretariat of Social Development.
The basic information contained in the HBS-FIPE in-cludes all food and drink purchases made by household members during a 30-day period, recorded on a daily basis by the household members themselves in a spe-cially designed notebook. Food purchase records con-tained information on each purchase made, including name, brand, and type of product, amount purchased,
purchase unit, cost, and place of purchase. The HBS-FIPE evaluated approximately 138 thousand purchase records for food, 8.5 thousand records for non-alcoholic beverages, and 2.5 thousand for alcoholic beverages.
To calculate the participation of individual food groups in the total household food purchases, we initially converted to grams any purchase records expressed in other units. We then grouped all records referring to a single type of food during the 30-day period. When appropriate, we excluded the non-edible fraction from the total amount of food purchased for a given item.8 We subsequently converted the total amount of each food in grams into energy (kcal) using the Tabela
Bra-sileira de Composição de Alimentos (Brazilian Chart
for Food Composition – TACO).14 In case the item was not present in this chart, we used the United States Department of Agriculture National Nutrient Database for Standard Reference, release 15** for conversion. Food records lacking clear identifi cation (e.g., “fruit,” without further specifi cation) were attributed energy values based on the mean value of foods in this group. Purchase records lacking any specifi cations (approxi-mately 3.2% of all records) were disregarded. The sum of all food records in each family, after conversion to energy, was regarded as the total calorie content of household food availability for that month.
Once converted to energy, records were classifi ed into the following food groups: cereals and derived products; beans and other legumes; tubers and derived precuts; meat, dairy, and derived products; eggs; fruits and natural juices; leaf vegetables and other vegetables; oils and vegetable fats; animal fats; oleaginous seeds; condiments; non-alcoholic beverages; alcoholic beve-rages; ready-made meals and industrialized mixes; and processed foods (including soft drinks and artifi cial jui-ces, biscuits and cookies, sweetened processed cereals, processed meats, sweets, and sauces and broths).
The participation of each food group in the total food availability of each household was expressed based on the percentage of the total calorie content derived from that group. In the case of FV, we also calculated the total amount of calories derived from these foods adjusted for the total calories consumed by the family. This adjusted total is obtained based on the residues of linear regression models that have calories from FV as the outcome variable and total calories as the explana-tory variable. To avoid null or negative values (which could not be subjected to the logarithmic transforma-tions necessary for calculating elasticity coeffi cients), an equal number was added to the residues from the regression models so that the smallest value resulting
* Food and Agriculture Organization of the United Nations. Nutrition Country Profi les – Brazil. Rome; 2000. Available from: http://www.fao. org/ag/agn/nutrition/bra-e.stm [Acessed 12 Dec 2004]
form this addition was higher than zero. This technique for adjusting for total calories using regression models is frequently employed in epidemiological studies of nutrition. For example, in order to evaluate the infl uence of the intake of a given food or nutrient on the occur-rence of a disease, one can annul the potential infl uence of total calorie intake, which is usually associated with consumption of foods or nutrients.17
The price paid by each household for foods in each group was expressed in Reais (R$ – Brazilian currency) per energy unit provided. This price was obtained by dividing household expenses with all foods in the group by the total calories purchased. Calorie-free foods (wa-ter, coffee, tea, and infusions) were not included in price calculations. In case a household had not purchased any foods from any given group, prices were imputed. For this imputation, we used the mean price paid by households in the same per capita total expense quintile which had been studied in the same trimester.
Although HBS-FIPE collected information on the inco-me of household inco-members, we believe that the family’s total expenditures in the month is more accurately represented by permanent income and purchase power. For this reason, monthly household expenditures were considered as equivalent to monthly family income.
The relationship between family income and food prices and participation of FV in the total food purchase was investigated using elasticity coeffi cients. These were calculated based on multiple linear regression models of the log-log (or log-linear) type, where elasticity coeffi cients are given by the regression coeffi cients (β) of the explanatory variables.5 The model employed can be defi ned by the equation
Ln(Cal_FV) = α + β1 Ln(I) +β2 Ln(Price_FV) + β3 Ln(Price_oth) + βc (CV), where:
· Cal_FV indicate calories provided by FV adjusted
for total calories;
· I indicates monthly family income in Reais (R$);
· Price_FV is the price of FV per unit of energy
(R$/kcal);
· Price_oth is the price of other foods per unit of
energy (R$/kcal);
· CV indicates control variables;
· β1 is the income elasticity coeffi cient;
· β2 is the price elasticity coeffi cient for the price of the food group itself;
· β3 is the price elasticity coeffi cient for the price of other foods;
· βc is the generic coeffi cient for control variables.
The following were considered as control variables in the models: absolute number of household members;
fi ve dichotomous variables indicating the presence or absence of members in fi ve age groups (0–3, 4–10, 11–18, 19–49, and ≥50); schooling, in complete years; and sex and age of the head of household.
Our analyses initially included all households studied by the HBS-FIPE, and were subsequently performed for individual strata corresponding to quintiles of family income distribution.
The database was organized using Stata 7.0 software, and statistical analyses and tabulations were carried out using SPSS 13.0.
RESULTS
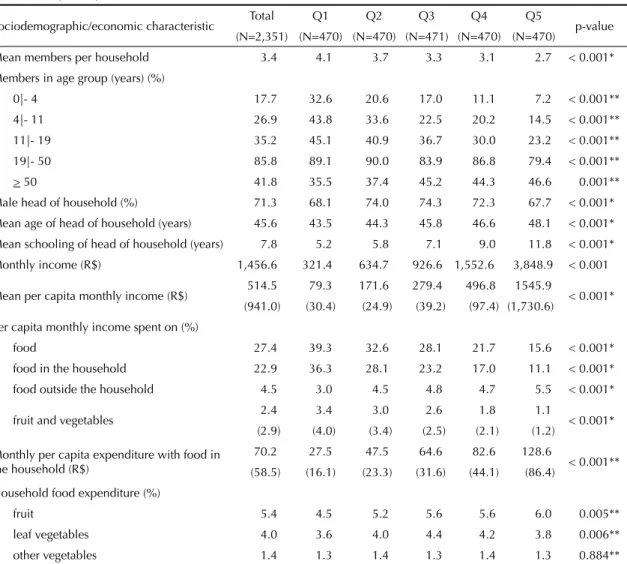
Table 1 presents sociodemographic and economic characteristics of households according to quintiles of monthly family income. Households had a mean 3.4 members, and were in their majority headed by men (71.3%). Mean per capita monthly income was R$514.50, ranging from R$79.30 in the lowest quintile to R$1,545.90 in the highest. The higher the income, the smaller the number of household members (form 4.1 in the fi rst quintile to 2.7 in the last), and the lower the proportion of households with younger members. Income increased with mean age (from 43.5 to 48.1 years) and schooling (from 5.2 to 11.89 years) of head of household.
Expenditures with food corresponded to on average 27.4% of household income, and tended to decrease as income increased. Expenditures with FV corresponded to on average 2.4% of monthly household income and to 10.2% of total food expenditures (5.1% for fruit, 1.3% for leaf vegetables, and 3.8% for other vegetables). Relative participation of fruit and other vegetables tended to increase with income, which was not the case for leaf vegetables (Table 1).
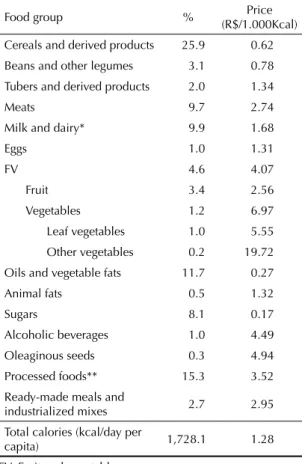
The relative participation of different food groups in the total calories purchased by the household (1,728.1kcal per capita/day) is presented in Table 2. Cereals and derived products showed the greatest participation (25.9%), followed by processed foods (15.3%), oils and vegetable fats (11.7%), milk and dairy (9.9%), and meat (9.7%). FV as a whole accounted for only 4.6% of total calorie availability, and individually, fruit accounted for 3.4%, leaf vegetables for 0.2%, and other vegetables for 1.0% of this total.
the effect of FV prices was roughly fi ve-fold that of income – a 1% decrease in FV prices would increase the participation of these foods in total food purchases by 0.2%. The infl uence of the price of other foods in the opposite direction was less important, but was still greater than that of income – a 1% increase in the price of all other foods would lead to a 0.07% increase in FV participation in total calorie purchases. Moreover, our analysis also indicated that an isolated reduction in the price of fruit would yield a larger increase in FV participation than an isolated reduction in prices of leaf vegetables or other vegetables. This was expected given the larger participation of fruit in the FV group.
Table 5 presents income and price elasticity coeffi cients for participation of FV in total food purchases according to per capita income quintiles. Only in the second and
fi fth quintiles were income elasticity coeffi cients statis-tically signifi cant, possibly refl ecting the lower income vegetables (R$ 5.55). The FV group had a mean cost
of R$ 4.07/1,000 kcal, vs. R$ 2.39/1,000 kcal for all other foods. Both the price of FV and the joint price of other foods tended to increase with income, especially between the third and fourth income quintiles.
FV participation in total calorie purchases increased signifi cantly from fi rst to last income quintiles, due to an increase in participation of fruit and other vegetables, but not of leaf vegetables (Table 3).
Table 4 presents income and price elasticity coeffi cients for the participation of FV in total household food purchases. Income elasticity was positive, with similar magnitude in all models estimated, and indicated that a 1% increase in household monthly income would increase the participation of FV in the diet by 0.04%. Price elasticity was negative for the price of FV and positive for the price of other foods. The magnitude of
Table 1. Sociodemographic and economic characteristics of households according to monthly per capita income quintiles (Q). São Paulo, Brazil, 1998-1999
Sociodemographic/economic characteristic Total Q1 Q2 Q3 Q4 Q5 p-value (N=2,351) (N=470) (N=470) (N=471) (N=470) (N=470)
Mean members per household 3.4 4.1 3.7 3.3 3.1 2.7 < 0.001* Members in age group (years) (%)
0|- 4 17.7 32.6 20.6 17.0 11.1 7.2 < 0.001**
4|- 11 26.9 43.8 33.6 22.5 20.2 14.5 < 0.001**
11|- 19 35.2 45.1 40.9 36.7 30.0 23.2 < 0.001**
19|- 50 85.8 89.1 90.0 83.9 86.8 79.4 < 0.001**
> 50 41.8 35.5 37.4 45.2 44.3 46.6 0.001**
Male head of household (%) 71.3 68.1 74.0 74.3 72.3 67.7 < 0.001*
Mean age of head of household (years) 45.6 43.5 44.3 45.8 46.6 48.1 < 0.001* Mean schooling of head of household (years) 7.8 5.2 5.8 7.1 9.0 11.8 < 0.001*
Monthly income (R$) 1,456.6 321.4 634.7 926.6 1,552.6 3,848.9 < 0.001
Mean per capita monthly income (R$) 514.5 79.3 171.6 279.4 496.8 1545.9 < 0.001* (941.0) (30.4) (24.9) (39.2) (97.4) (1,730.6)
Per capita monthly income spent on (%)
food 27.4 39.3 32.6 28.1 21.7 15.6 < 0.001*
food in the household 22.9 36.3 28.1 23.2 17.0 11.1 < 0.001*
food outside the household 4.5 3.0 4.5 4.8 4.7 5.5 < 0.001*
fruit and vegetables 2.4 3.4 3.0 2.6 1.8 1.1 < 0.001* (2.9) (4.0) (3.4) (2.5) (2.1) (1.2)
Monthly per capita expenditure with food in the household (R$)
70.2 27.5 47.5 64.6 82.6 128.6
< 0.001** (58.5) (16.1) (23.3) (31.6) (44.1) (86.4)
Household food expenditure (%)
fruit 5.4 4.5 5.2 5.6 5.6 6.0 0.005**
leaf vegetables 4.0 3.6 4.0 4.4 4.2 3.8 0.006**
other vegetables 1.4 1.3 1.4 1.3 1.4 1.3 0.884**
variance in these strata. Price elasticity coeffi cients for FV were negative and statistically signifi cant across all income strata (ranging around 0.20). Price elasticity coeffi cients for non-FV foods were positive and sta-tistically signifi cant within the fi rst four income strata
(ranging form 0.17 to 0.04), but were not signifi cant in the highest income group.
DISCUSSION
The records of monthly food purchases collected by the HBS allowed us to evaluate the infl uence of family income and food prices on participation of FV in the household diet. FV participation in the total calories purchased by the household increased as family inco-me and the price of other foods increased and as the price of FV itself decreased. The greatest increase was found to occur with decreases in FV prices, followed by increases in prices of other foods and higher income. The effect of prices of other foods lost intensity among higher income strata; there were no consistent income-related patterns for the other two effects.
The main limitations of the present study are related to the fact that the HBS measure household availability rather than food intake proper, since the fraction of pur-chased food that is not consumed is unknown and food consumption outside the household is not measured.
The use of total monthly expenditures as a proxy for family income does not necessarily constitute a limita-tion. In cross-sectional studies, such as the present one, monthly expenditures tend more accurately refl ect the long-term income of the household, since they are less subject to month-to-month variation.15 Expenditures are a good measure of family income, except for the case of households with signifi cant participation of non-mone-tary earnings and those that base a large proportion of their expenditures on future income. Such expenditures, which include purchases with postponed payment or in installments, are generally made for the purchase of durable goods rather than food.15,16
The major advancement in the present study in com-parison to the literature on FV consumption is in the procedures used to identify relative participation of these foods in the diet. Given the vertiginous growth in obesity and diet-associated chronic diseases in
Table 2. Relative participation of foods (%) in total calories purchased by household and mean price paid for food group. São Paulo, Brazil, 1998-1999.
Food group % Price
(R$/1.000Kcal)
Cereals and derived products 25.9 0.62 Beans and other legumes 3.1 0.78
Tubers and derived products 2.0 1.34
Meats 9.7 2.74
Milk and dairy* 9.9 1.68
Eggs 1.0 1.31
FV 4.6 4.07
Fruit 3.4 2.56
Vegetables 1.2 6.97
Leaf vegetables 1.0 5.55
Other vegetables 0.2 19.72
Oils and vegetable fats 11.7 0.27
Animal fats 0.5 1.32
Sugars 8.1 0.17
Alcoholic beverages 1.0 4.49
Oleaginous seeds 0.3 4.94
Processed foods** 15.3 3.52 Ready-made meals and
industrialized mixes 2.7 2.95
Total calories (kcal/day per
capita) 1,728.1 1.28
FV: Fruit and vegetables * Excluding cream and butter.
** Including sweets (4.4%; R$4.22); soft drinks and artifi cial juices (3.5%; R$2.54); processed meats (3.0%; R$1.86); processed cereals (0.4%; R$1.89); biscuits and cookies (3.3%; R$0.91), and sauces and broths (0.7%; R$2.64).
Table 3. Participation of food groups (%) in the total calories purchased by the household according to monthly per capita income quintiles (Q). São Paulo, Brazil, 1998-1999.
Food group Q1 Q2 Q3 Q4 Q5 p-value*
N=470 N=470 N=471 N=470 N=470
FV 4.1 4.6 4.6 4.5 5.3 0.044
Fruit 3.0 3.3 3.4 3.3 4.0 0.049
Vegetables 1.1 1.2 1.2 1.3 1.4 0.002
Leaf vegetables 0.9 0.9 1.0 1.1 1.2 0.001
Other vegetables 0.2 0.3 0.2 0.2 0.2 0.356
Total calories (kcal/day per capita) 1,075.2 1,602.8 1,946.0 2,024.1 1,992.2 < 0.001
Brazil (and in most countries worldwide), FV would ideally be added to the diet as a replacement for foods of higher energetic density and lower nutrient and
fi ber content.
Indeed, until the conclusion of the present article, we were unable to fi nd studies estimating income and price elasticity for the participation of FV in the diet, especially studies aimed at providing subsidy for the choice of strategy to be employed for the promotion of a healthy diet. Generally speaking, in the studies found in the literature, FV intake is evaluated based on the ab-solute amount of purchased, or even by the participation
of these items in the total household expenses.1,6,7,12,20 Elasticity coeffi cients obtained by this means are not informative as to whether higher income or lower prices are associated with greater participation of FV in the diet, and may refl ect simply absolute variations in the amount of these foods purchased, or even variations in the type of FV purchased.
The results of the present study indicate the increase in family income or the reduction of the relative prices of FV as possible ways to increase participation of FV in the diet. Public fund-transfer policies are the major means of increasing the income of a signifi cant fraction of the population in a direct and immediate fashion. However, the implementation of these policies is limi-ted mainly by the fi nancial capabilities of the public budget. The magnitude of the benefi t and the choice of social stratum to be contemplated tend to be defi ned by political criteria, which in some cases may limit the outreach and magnitude of benefi ts. Furthermore, espe-cially among low-income families, earnings still tend to be divided amongst several groups of expenditures, thus without guaranteeing that signifi cant changes will occur in the participation of FV in the diet.2 Estimated income elasticity values showed a limited infl uence of family income on the participation of FV in the diet. It is possible that, as seen in other settings,2 the level of affl uence of the household is a more important determi-nant of quality and variety of fruit and vegetables than of the proportion these foods represent in the diet.10
Price-reduction policies are in principle more viable measures, and are more likely to yield immediate and effective results, given the more direct and targeted character of the infl uence of prices on consumer choi-ces. The formula most widely adopted for conceding
Table 5. Elasticity coeffi cients* for explanatory variables for total calories contributed by fruit, leaf vegetables, and other vege-tables, adjusted for total calories, according to per capita family income quintiles (Q), according to two regression models.** São Paulo, Brazil, 1998-1999.
Explanatory variable in the model Q1 Q2 Q3 Q4 Q5
Regression model 1 Elasticity
Monthly income -0.02 ns 0.14 0.04 ns 0.07 ns 0.08
FV prices -0.14 -0.20 -0.23 -0.19 -0.22
Price of foods other than FV 0.16 0.12 0.16 0.05 0.01 ns
R2 of the model 0.31 0.18 0.21 0.15 0.21
Regression model 2 Elasticity
Monthly income -0.02 ns 0.14 0.04 ns 0.06 ns 0.08
Price of fruit -0.08 -0.13 -0.15 -0.10 -0.16
Price of vegetables -0.03 ns -0.01 ns -0.06 -0.03 ns -0.04 ns Price of foods other than FV 0.17 0.12 0.16 0.04 0.00 ns
R2 of the model 0.22 0.15 0.13 0.06 0.15
* All elasticity coeffi cients are signifi cant with p < 0.01, except when indicated by “ns”
** All models controlled for total household members, presence of person > age 50 years, and schooling of head of hou-sehold.
Table 4. Elasticity coeffi cients* for explanatory variables for total calories contributed by fruit, leaf vegetables, and other vegetables, adjusted for total calories. São Paulo, Brazil, 1998-1999.
Explanatory variable Regression model**
1 2 3 4
Monthly income 0.03 0.04 0.03 0.04
FV prices *** -0.18 -0.20 ***
Price of foods other
than FV *** *** 0.07 0.07
Fruit prices *** *** *** -0.11
Leaf vegetable prices *** *** *** -0.04
Other vegetable
prices *** *** *** -0.07
R2 of models 0.05 0.13 0.15 0.12 * All elasticity coeffi cients are signifi cant with p < 0.05 ** All models controlled for total household members, presence of person > age 50 years, and schooling of head of household
price subsidies in Brazil is stimulating price reduction throughout the product’s entire productive chain. In the case of FV, this could be achieved by means of exemptions from added value and sales taxes; by subsidizing transportation and storage systems; by reducing FV import taxes, through incentives to rural producers; and through the creation of public channels for wholesale and/or retail supported by lower com-mercialization costs and greater outreach. The obvious disadvantages of subsidies across the entire productive chain are the high cost to the public administration and the risk of creating an imbalance in the supply/demand relationship for the subsidized product in case supply is not equally stimulated.
Although initially exempting the FV production chain from taxation would signify a loss of revenue for the public sector, reductions in healthcare expenditures may
contribute to equilibrate the public budget.4,19 Imposing a small tax on groups of foods considered as unhealthy would be a solution for obtaining the necessary resour-ces for implementing FV subsidies.11 However, we could not detect a pattern that indicated in a conclusive manner the best candidates for taxation.
1. Abdulai A, Aubert D. A cross-section analysis of household demand for food and nutrients in Tanzania. Agric Econ. 2004;31(1):67-79.
2. Blisard N, Stewart H, Jolliffe D. Low-income households’ expenditures on fruits and vegetables. Washington; 2004. (Agricultural Economic Report, 833).
3. Carmo HCE. Pesquisa de Orçamentos Familiares 98-99: Principais resultados. Inf. FIPE. 2000;231:12-7.
4. Finkelstein EA, Ruhm CJ, Kosa KM. Economic causes and consequences of obesity. Annu Rev Public Health. 2005;26(supl):239-57.
5. Guo X, Popkin BM, Mroz TA, Zhai F. Food price can favorably alter macronutrient intake in China. J Nutr. 1999;129(5):994-1001.
6. Hoffmann R. Elasticidades-renda das despesas com consumo de alimentos em regiões metropolitanas do Brasil em 1995-1996. Inf. Econ. 2000;30(2):17-24.
7. Hoffmann R. Elasticidades-renda das despesas com consumo físico de alimentos no Brasil metropolitano em 1995-1996. Agric. Sao Paulo. 2000;47(1):111-22.
8. Instituto Brasileiro de Geografi a e Estatística. Estudo Nacional das Despesas Familiares-ENDEF: 1974-1975. Rio de Janeiro; 1978.
9. Instituto Brasileiro de Geografi a e Estatística. Pesquisa de Orçamentos Familiares 2002/2003: Aquisição alimentar domiciliar per capita, Brasil e grandes regiões. Rio de Janeiro; 2004.
10. Krebs-Smith SM, Kantor LS. Choose a variety of fruits and vegetables daily: understanding the complexities. J Nutr. 2001;131(2S-1):487s-501s.
11. Kuchler F, Tegene A, Harris JM. Taxing Snack Foods: What to expect for diet and tax revenues. Washington: United States Department Of Agriculture. Economic Research Service; 2004. (Agriculture Information
Bulletin, 747-08).Disponível em: http://www.ers.usda. gov/Publications/AIB747/aib74708.pdf [Acesso em nov 2004]
12. Menezes T, Silveira FG, Magalhães LCG, Tomich FA, Vianna SW. Gastos alimentares nas grandes regiões urbanas do Brasil: aplicação do modelo AID aos microdados da POF 1995/1996 IBGE. Brasília: IPEA; 2002. (Texto para Discussão, 896).
13. Monteiro CA, Mondini L, Costa RBL. Mudanças na composição e adequação nutricional da dieta familiar nas áreas metropolitanas do Brasil (1988-1996). Rev Saude Publica. 2000; 34(3):251-8.
14. NEPA/UNICAMP. Tabela brasileira de composição de alimentos. Taco. Versão 1. Campinas; 2004.
15. Ramsey JB, Lampart C. The decomposition of economic relationships by time scale using wavelets: expenditure and income. Stud Nonlinear Dynam Econometrics.1998;3(1):23-42.
16. Ravallion M. Issues in Measuring and Modelling Poverty. Econ J.1996;106(438):1328-43.
17. Willett W, Stampfer MJ. Total energy intake: implication for epidemiologic analyses. Am J Epidemiol.1986;124(1):17-27.
18. World Health Organization. The world report 2002: reducing risks, promoting healthy life. Geneva: World Health Organization; 2002.
19. World Health Organization. Diet, nutrition and the prevention of chronic diseases. report of a joint WHO/FAO expert consultation. Geneva; 2003. (WHO-Technical Report Series, 916).
20. You Z, Epperson JE, Huang CL. Consumer demand for fresh fruits and vegetables in the United States. Athens: University of Georgia;1998. (Research Bulletin University of Georgia, 431). Disponível em: http:// pubs.caes.uga.edu/caespubs/pubs/PDF/RB431.pdf [Acesso em nov 2004]
REFERENCES