68
STATE AID EVOLUTION OVERVIEW IN EUROPEAN UNION
CONTEXT DURING THE PERIOD 2007 – 2012
Anca D.B., Dodescu1
Abstract:
According to the European Union point of view, the fundamental principle of state aid is to ensure that inside the single market, competition is not distorted. In this context, by exception state aid can be justified when they contribute to achieving EU’s social and economic goals. This may take place when market forces obstruct the achieving of the proposed objectives or permit their achieving on unacceptable long terms and costs. This article is structured in four parts, focusing on European Union’s vision regarding state aid measures. The first part of the article refers to the general context of state aid in EU. The second part of the article tries to define this concept according to European Commission point of view and also studies the state aid information provided by the EU, through its benchmarking instrument regarding state aid expenditure called State Aid Scoreboard. The third part of the article mainly presents the EU state aid evolution during the period 2007 – 2012 and establishes a methodological point of view in order to classify and divide state aid in two main categories: non-crisis state aid and crisis state aid, with the purpose of avoiding the distortion trends regarding state aid expenditure granted for the financial sector. This part of the article also presents different types of state aid at EU27 level and granted by the selected member states (Romania, Hungary, Bulgaria and Germany) between 2007 and 2012 and also analysis horizontal aid, sectorial aid and state aid during the economic crisis 2008 – 2012, referring to recapitalization and asset relief measures and guarantees and liquidity measures. The last part of the article presents the conclusions and also states certain recommendations regarding EU state aid practices, based on the results obtained.
Keywords: horizontal state aid, sectorial state aid, recapitalization and asset relief measures, guarantees and liquidity measures
JEL classification: O52; R58
1. Introduction
In the late 1970s, the European Commission started defining state aid policies granted to certain sectors, by establishing specific instruction for each of the selected areas. An important EC communication in 1978 establishes the fundamental basis of state aid, rules that every EU member state still applies even today.
The fundamental principle is to ensure that inside the single market, competition is not distorted. In this context, by exception state aid can be justified when they contribute to achieving EU’s social and economic goals. This may take place when market forces obstruct the achieving of the proposed objectives or permit their achieving on unacceptable long terms and costs (Bacon, 2013).
Recently, the European Commission published a statistical study concerning the main types of state aid granted by EU in the context of the financial and economic crisis. The study conducted by the European Commission’s experts in the period 2008 – 2012 focuses on state aid impact on the member states economies affected by the financial instability generated by the economic crisis and also concentrates on the European Institutions’ response. (European Commission 2011)
The actual European regulations provide that the application of the European rules regarding state aid in the context of economic crisis must consider the exceptional character of every situation, insuring that this kind of measures do not lead to useless distortions of competition or to negative effects on the other member states. (European Commission, 2012)
69
Achieving this generic objective implies that all state aid schemes and measures must be periodically assessed, in order to avoid any negative situation. According to the European Commission, every member state must review and report its state aid scheme every semester.
2. Defining the concept of state aid in EU context
According to the European Commission definition of state aid, this concept is defined as being any form of advantage provided on a selective basis by any national, public authority. (State aid scoreboard, 2011)
Therefore, subsidies granted to certain individuals or general measures open to all entreprises are not covered by this prohibition and do not constitute the subject of State Aid (general taxation rules, legislation, etc).
The European Commission classifies as state aid, only the measures that perform the following characteristics:
There must be a proven state intervention or proven intervention through the
states’ resources which can take a variety of forms: grants, interest and tax exceptions, guarantees, government holdings of all or part of a company or providing goods and services on preferential conditions, etc);
The intervention gives the recipient an advantage on a selective basis; The competition is distorted;
The trade between certain member states is affected, or it creates a certain
prejudice / damage.
According to EU legislation, in some cases the government intervention is necessary for a well – functioning and equitable economy despite the general prohibition of state aid, and the TFEU leaves room for a number of policy objectives for which state aid can be considered compatible.
The European legislation establishes clearly all these exemptions and the laws are regularly reviewed in order to improve their efficiency. The European Commission adopts new legislation in close cooperation with the member states.
State aid measures can only be implemented after the approval by the Commission, which also has the power to recover incompatible state aid.
State aid control is conducted by three European bodies, called Commission Directorates General:
Fishery; Agriculture; Competition
This article studies the state aid information provided by the EU, through its benchmarking instrument regarding state aid expenditure in the EU, the member states and also in EFTA countries, called State Aid Scoreboard.
3. EU state aid trends between 2007 and 2012
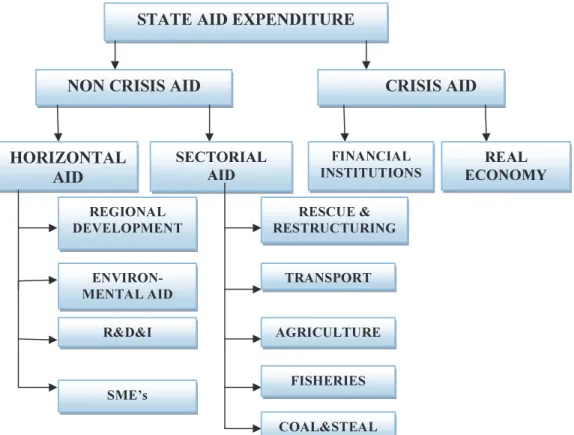
From a methodological point of view, in the context of European Union state aid is divided in two main categories: non-crisis state aid and crisis state aid, with the purpose of avoiding the distortion trends regarding state aid expenditure granted for the financial sector. State aid Scoreboard, 2011)
70
Figure 1: State aid expenditure classification
Source: Author’s representation, based on the information available on EU portal http://ec.europa.eu/competition/state_aid/studies_reports/archive/scoreboard_arch.html
This part of the article presents non crisis aid as a synthesis of EU expenditure, accompanied by an overview of state aid trends granted to the industry and services in the analysed period, 2007 – 2012.
Ϭ Ϭ͘Ϯ Ϭ͘ϰ Ϭ͘ϲ Ϭ͘ϴ
ϮϬϬϳ ϮϬϬϴ ϮϬϬϵ ϮϬϭϬ ϮϬϭϭ ϮϬϭϮ
dŽƚĂůƐƚĂƚĞĂŝĚ ĂƐйŽĨ'W͕ hϮϳ
Figure 2: EU 27 Total state aid (non-crisis aid) evolution as percentage of GDP
Source: Author’s representation based on data available on Eurostat database
Figure 2 presents non crisis state aid trend or evolution granted by EU27 between 2007 and 2012. It could be easily noticed that this type of state aid initially followed an increasing trend between 2007 and 2009. The maximum non crisis state aid expenditure was registered in 2009, and followed a moderate decreasing trend between 2009 and 2011, when it registered the lowest value. Compared to 2011, the state aid expenditure registered a slight increase.
According to the official European Commission estimates regarding EU27 GDP, the non – crisis state aid for 2012 totalised approximately 67,3 bil. EUR, representing 0,52% of EU27 GDP.
STATE AID EXPENDITURE
NON CRISIS AID CRISIS AID
HORIZONTAL AID
SECTORIAL AID
REGIONAL DEVELOPMENT
ENVIRON-MENTALAID
R&D&I
SME’s
RESCUE & RESTRUCTURING
TRANSPORT
AGRICULTURE
FISHERIES
COAL&STEAL FINANCIAL INSTITUTIONS
71
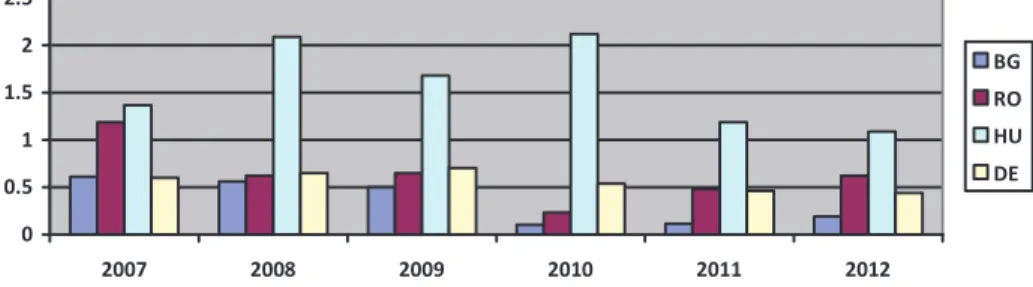
For a better and more clear situation and also for determining our country’s position compared to other member states, this article also tries to present a comparative analysis with reference to non - crisis state aid evolution as a percentage of GDP in certain member states in the period 2007 – 2012.
The selected member states are Romania, Bulgaria, Hungary and Germany and their situation is presented in Figure 3.
The motivation for choosing these countries is that Bulgaria also joined EU in the same time as Romania and it’s our Southern neighbour, Hungary joined EU in 2004 accession wave and it is the Western neighbour of Romania. Another reason for selecting these countries is that they are often taken together and compared, because they present several similarities regarding the political regime and history. Germany was selected because it has the healthiest economy, based on a strong, performant and efficient economic policy. Germany is also considered the engine of EU economy by the other member states.
Ϭ Ϭ͘ϱ ϭ ϭ͘ϱ Ϯ Ϯ͘ϱ
ϮϬϬϳ ϮϬϬϴ ϮϬϬϵ ϮϬϭϬ ϮϬϭϭ ϮϬϭϮ
' ZK ,h
Figure 3: Non crisis state aid evolution as a percentage of GDP in the selected member states between 2007 and 2012
Source: Author’s representation based on data published by Eurostat database
In the case of Bulgaria, the expenditure with non - crisis state aid is the lowest and it registered a decreasing trend, reaching its minimal value in 2010, and after it followed a moderate increasing evolution.
In our country’s situation, the expenditure with non - crisis state aid followed a decreasing trend until 2010, and after it registered a slight increase between 2010 and 2012.
Out of the four countries analysed Hungary has the highest expenditure with non - crisis state aid and it has a fluctuating trend, increasing and decreasing from year to year. A possible explanation for the instability of this rate may be the Hungarian interests and priorities in the period analysed.
Germany has the most constant non – crisis state aid expenditure evolution, registering similar values every year. We can also notice that after Bulgaria, Germany is the country with the lowest non crisis state aid expenditure.
72 Ϭ
Ϭ͘ϭ Ϭ͘Ϯ Ϭ͘ϯ Ϭ͘ϰ Ϭ͘ϱ
ϮϬϬϳ ϮϬϬϴ ϮϬϬϵ ϮϬϭϬ ϮϬϭϭ ϮϬϭϮ
,ŽƌŝnjŽŶƚĂůĂŝĚĂƐй ŽĨ'WĨŽƌhϮϳ ^ĞĐƚŽƌŝĂůĂŝĚĂƐйŽĨ 'WĨŽƌhϮϳ
Figure 4: EU27 Horizontal aid vs. EU Sectorial Aid as percentage of GDP between 2007 and 2012
Source: Author’s representation based on data published by Eurostat database
When trying to analyse the non - crisis state aid supported directions we can easily notice that the horizontal objectives enjoy EU’s attention, when compared to the sectorial objectives. The most supported directions are: regional development, environmental protection, R&D&I, and SME’s aid.
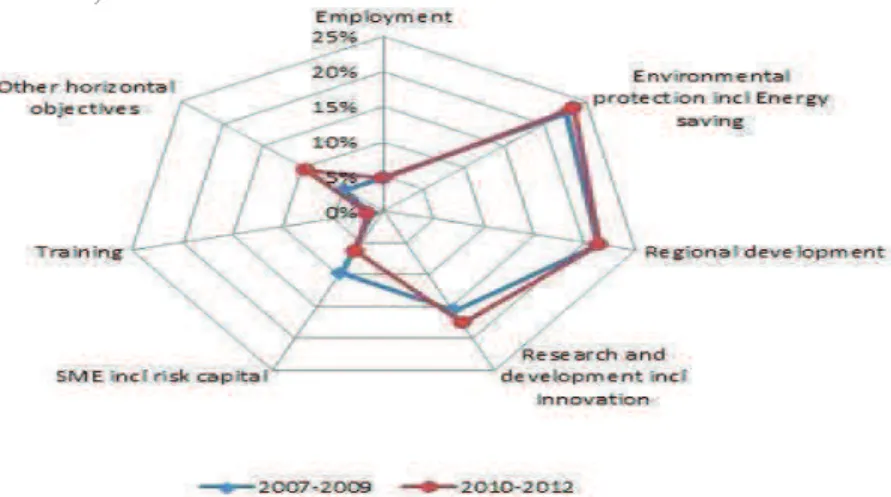
Figure 5: EU27 Horizontal state aid evolution as percentage of total state aid between 2007 and 2012
Source: European Commission, Competition DG, State Aid Overview, available online http://ec.europa.eu/competition/state_aid/scoreboard/horizontal_objectives_en.html#
In a general matter, the above figure presents EU27 horizontal objectives evolution in the analysed period of 2007 – 2012, determining the most supported directions (Environmental protection – 24%, Regional Development 21%, R&D&I – 18 %)
73 Ϭ
ϮϬ ϰϬ ϲϬ ϴϬ ϭϬϬ
' ZK ,h
ƵůƚƵƌĞ
ŵƉůŽLJŵĞŶƚ
ŶǀŝƌŽŶŵĞŶƚĂůƉƌŽƚĞĐƚŝŽŶ ZĞŐŝŽŶĂůĞǀĞůŽƉŵĞŶƚ ZΘΘ/
^DΖƐŝŶĐů͘ƌŝƐŬĐĂƉŝƚĂů
Figure 6: Horizontal objectives as % of total state aid in the selected member states in 2012
Source: Author’s representation based on data published by Eurostat database
In Figure 6 we can see each member state situation regarding the horizontal directions they granted in 2012 and we can easily compare the trends.
At first glance there is a similarity between Germany and Romania regarding the objective “Environmental protection”. Both of the countries grant the most for this horizontal objective, following EU27 trend. We can also notice a similarity between Hungary and Bulgaria regarding the objective “Regional Development”, granting the most for this horizontal objective.
In the case of Germany we can see that horizontal state aid is mainly granted for objectives as: “Environmental protection”, “Research, development and innovation” and “Regional Development” and less for directions like: “Culture”, “Employment” and “SME’s”. In the case of Hungary we may notice a certain uniformity in grating state aid to most of the analysed directions like: “Culture”, “Employment”, “Regional Development” and “Research, development and innovation”, less aid for “SME’s” and none for “Environmental protection”.
In the case of Romania we may notice that the most state aid grants are directed to “Environmental Protection”, less grants for “Regional Development” objectives and almost none for “Research, development and innovation”, “Culture”, “Employment” and “SME’s”.
If we compare the results obtained with the horizontal aid directions supported by EU27, we can see that Germany is the country that respects the most the European trends, granting aid to the most important sectors that also represent the engine of the economy: “Research, development and innovation”, “Regional Development” and “Environmental protection”.
Regarding the Sectorial state aid including agriculture and fisheries aid as percentage of total state aid, the amounts granted at EU27 level for the period 2007 – 2012 are presented in Figure 7.
Ϭ ϭϬ ϮϬ ϯϬ ϰϬ
ϮϬϬϳ ϮϬϬϴ ϮϬϬϵ ϮϬϭϬ ϮϬϭϭ ϮϬϭϮ
hϮϳ^ĞĐƚŽƌŝĂů ŝĚ;ŝŶĐů͘ ĂŐƌŝĐƵůƚƵƌĞĂŶĚ ĨŝƐŚĞƌŝĞƐͿĂƐйŽĨ
Figure 7: EU27 Sectorial Aid (including agriculture and fisheries) as % of total state aid in the period 2007 - 2012
74
Figure 7 presents the evolution of sectorial aid between 2007 and 2012 as percentage of total state aid and we can notice that it registered a continuous decreasing trend.
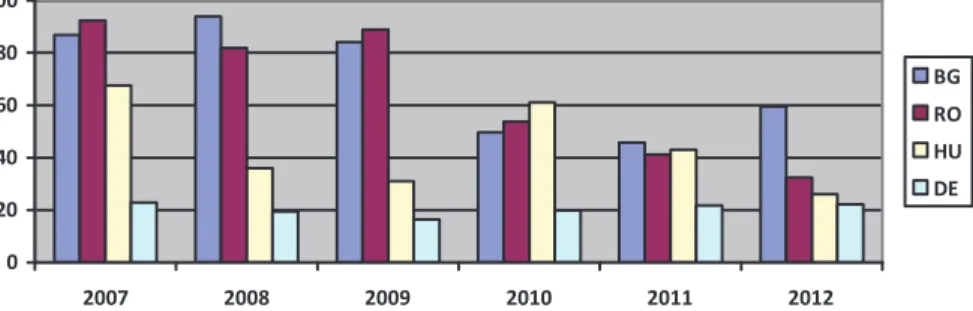
For the purpose of a better image regarding sectorial aid in the selected member states, we can analyse Figure 8.
Ϭ ϮϬ ϰϬ ϲϬ ϴϬ ϭϬϬ
ϮϬϬϳ ϮϬϬϴ ϮϬϬϵ ϮϬϭϬ ϮϬϭϭ ϮϬϭϮ
' ZK ,h
Figure 8: Sectorial aid as % of total state aid between 2007 and 2012 in the selected member states
Source: Author’s representation based on data provided by Eurostat database
Regarding the evolution of sectorial aid, Figure 8 presents the situation of the selected member states and the first aspect that we can notice is that Bulgaria and Romania have the highest sectorial state aid rates in the period analysed, registering more than 80% between 2007 and 2009. If we think about the directions of sectorial aid: “Rescue and restructuring”, “Transport”, “Agriculture”, “Fisheries” and “Coal and steel” we can say that this directions were supported the most of after joining the EU.
This article also studies the second main type of state aid, crisis aid granted by the member states in the period 2008 - 2012.
The financial market crisis in 2008 called for a massive intervention by all European governments, in order to reduce the negative effects present in every European economy. State aid granted to institutions has been the most important factor for restructuring the confidence in the financial sector and avoiding another breakdown. In addition to this, EU governments also used the Temporary Framework rules to offer assistance to the real economy, with the purpose to reduce the negative effects of the economic crisis.
According to the 2013 State Aid Scoreboard, between 2008 and 2013 EC took more than 400 decisions authorising state aid measures granted to the financial sector, disguised in several forms: recapitalization and asset relief, guarantees and other forms of liquidity.
In this part of the article we presented the situation of Recapitalization and asset relief aid and the situation of the guarantees and liquidities during the financial crisis at EU27 level and also at selected member states level.
Firstly, Figure 9 presents the crisis state aid situation granted by EU27 during the financial crisis 2008 – 2012.
In the above figure we can notice that in terms of “Guarantees and liquidity” measures the highest amount reached was in 2009, representing 7,6 % of EU27 GDP. Ever since then, the EU27 amounts have been decreasing until it reached 4,14 % of GDP in 2012.
75 Ϭ
Ϯ ϰ ϲ ϴ ϭϬ
ϮϬϬϴ ϮϬϬϵ ϮϬϭϬ ϮϬϭϭ ϮϬϭϮ
ZĞĐĂƉŝƚĂůŝnjĂƚŝŽŶ ĂŶĚĂƐƐĞƚƌĞůŝĞĨ
'ƵĂƌĂŶƚĞĞƐĂŶĚ ůŝƋƵŝĚŝƚLJŵĞĂƐƵƌĞƐ
Figure 9: EU27 crisis state aid evolution as % of GDP, during the financial crisis 2008 - 2012
Source: Author’s representations based on data provided by Eurostat database
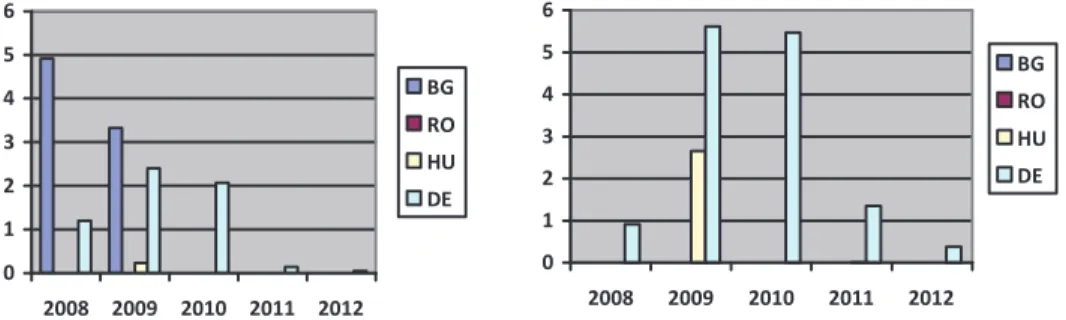
Following the same structure of the article, the next figure will present a comparative analysis between the selected member states in terms of “Recapitalization and asset relief” measures and “Guarantees and liquidity” measures adopted between 2008 and 2012.
Ϭ ϭ Ϯ ϯ ϰ ϱ ϲ
ϮϬϬϴ ϮϬϬϵ ϮϬϭϬ ϮϬϭϭ ϮϬϭϮ ' ZK ,h
Ϭ ϭ Ϯ ϯ ϰ ϱ ϲ
ϮϬϬϴ ϮϬϬϵ ϮϬϭϬ ϮϬϭϭ ϮϬϭϮ ' ZK ,h
Figure 10: Recapitalization and asset relief measures compared to Guarantees and Liquidity measures as % of GDP in 2008 – 2012
Source: Author’s representations based on data provided by Eurostat
From the above figure we may notice that Romania is the only country that hasn’t adopted any “Recapitalization and asset relief” measures during the financial crisis. The highest values of this kind of measures were registered in 2008 in Bulgaria and by the year 2011 and 2012 they were almost inexistent in the selected member states.
From the “Guarantees and liquidity” point of view, Romania and Bulgaria haven’t granted any support during 2008 – 2012, Germany is the country that applied the most “Guarantees and liquidity” measures, reaching the highest level in 2009 registering 5,61% of GDP, but reducing this kind of aid by 0.38% in 2012.
4. Conclusion
In the context of the “economic turbulences” caused by the financial crisis, state aid is a strong instrument used by the member states to counterattack the negative effects on the financial stability and also on the real economy.
The latest estimating remarks stated in the EC 2013 Fall Report are not optimist with reference to the evolution of EU economy and Eurozone sovereign debt crisis, continuing to negatively reverberate on the economic growth forecasts.
76
In conclusion, EU’s long term objective regarding state aid must concentrate on the horizontal objectives that distortion less the free trade and competition, like: research, development and innovation aid, environmental protection aid and SME’s including risk capital aid.
ACKNOWLEDGMENT
This paper has been financially supported within the project entitled „SOCERT. Knowledge society, dynamism through research”, contract number POSDRU/159/1.5/S/132406. This project is co-financed by European Social Fund through Sectoral Operational Programme for Human Resources Development 2007-2013. Investing in people!”
This article is part of the author’s research for the PhD Thesis “Competition vs.
competitiveness. State aid impact in Romania, after joining EU”.
References:
1. Bacon, K. (2013) European Union law of state aid, Oxford University Press, UK 2. Wishlade, F. (2003) Regional state aid and competition policy in the European Union,
European Monographs, Kluwer Law International
3. European Commission (2011) Report on state aid granted by the EU member states, Brussels
4. European Commission (2012) Overview of decisions and on-going in-depth investigations in the context of the financial crisis, Brussels, 13 September 2012. 5. European Commission (2012) Communication from the Commission on the application,
of State aid rules to support measures in favour of banks in the context of the financial crisis, Brussels