ANALYSIS OF PERSONAL INCOME TAX IN ROMANIA AND THE OTHER
MEMBER STATES OF THE EUROPEAN UNION
CHIRCULESCU MARIA FELICIA
TEACHING ASSISTANT FACULTY OF ECONOMICS AND BUSINESS ADMINISTRATION,
CONSTANTIN BRÂNCUŞI UNIVERSITY OF TÂRGU JIU, ROMANIA,
[email protected]
DOBROTĂ GABRIELA
PROFESSOR, FACULTY OF ECONOMICS AND BUSINESS ADMINISTRATION,
CONSTANTIN BRÂNCUŞI UNIVERSITY OF TÂRGU JIU, ROMANIA,
[email protected]
Abstract
The high tax burden on labor in the European Union is a subject of analysis often encountered in the speciality literature. This is probably due the fact that are more convenient to implement from the political point of view - there is the responsibility of an anonymous administration and not the responsibility of Prime Minister or President.
In recent years the personal taxation had a substantial increase in most European Union member states, a phenomenon that has generated some repercussions: it affects employment in the labor market, encouraging the substitution of labor with capital, increase unemployment, increase tax burden on labor and tax evasion amplification generates employment orientation towards the ground. Growing importance given to personal income tax is largely due to the fact that direct taxes within the EU this is a more stable basis of taxation. In Romania reduction in tax revenue from income tax was offset by increased tax revenues from value added tax. The evolution of tax revenues from direct taxes is normal if we consider that the remaining incomes to the taxpayers were available for consumption, which led to higher levels of indirect taxes collected to the budget.
The influence of employment on the labor market due to the size of the labor tax is explained by the fact that the option for such taxes is due to the ease of implement for policy makers but also by the fact that employees are not always aware of these taxes.
Key words: income tax, personal income tax rates for employees
JEL classification: G38; H 21; H 71
1.
Introduction
The personal income tax affects the operation manner of the labor market in the Member States of the European Union at least by two reasons. On one hand, though the fact that the option for taxation of this kind is due to the ease of implementation for policy decision makers, on the other hand by the fact that employees are not always aware of these taxes existences.
We believe that taxation is a complex work for the current tax system in particular due to individual's behavior, their response to taxation. Thus, we can assist in tax practice to:
-a substitution effect (where due the decrease in disposable income because to tax the taxpayer decides to replace labour time for leisure time;
- an effect of income, when the taxpayer decides to spend more time on leisure over labor, so to keep their income before increasing the tax burden;
- or the effect of income redistribution (determined by contributions and social transfers which increases the income of unemployment benefits, pensions, etc. also the reduce of labor supply.
2. Analysis of income tax share of GDP in Romania and other European Union member states
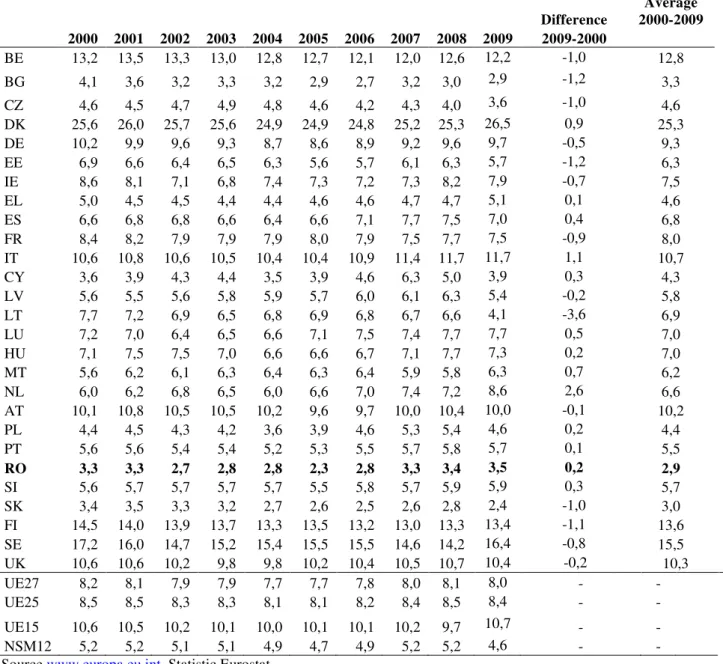
Tabel no. 1
Personal income tax rates in GDP in EU Member Statesduring the period 2000-2009 (%)
Difference
Average 2000-2009 2000 2001 2002 2003 2004 2005 2006 2007 2008 2009 2009-2000
BE 13,2 13,5 13,3 13,0 12,8 12,7 12,1 12,0 12,6 12,2 -1,0 12,8 BG 4,1 3,6 3,2 3,3 3,2 2,9 2,7 3,2 3,0 2,9 -1,2 3,3 CZ 4,6 4,5 4,7 4,9 4,8 4,6 4,2 4,3 4,0 3,6 -1,0 4,6 DK 25,6 26,0 25,7 25,6 24,9 24,9 24,8 25,2 25,3 26,5 0,9 25,3 DE 10,2 9,9 9,6 9,3 8,7 8,6 8,9 9,2 9,6 9,7 -0,5 9,3 EE 6,9 6,6 6,4 6,5 6,3 5,6 5,7 6,1 6,3 5,7 -1,2 6,3 IE 8,6 8,1 7,1 6,8 7,4 7,3 7,2 7,3 8,2 7,9 -0,7 7,5 EL 5,0 4,5 4,5 4,4 4,4 4,6 4,6 4,7 4,7 5,1 0,1 4,6 ES 6,6 6,8 6,8 6,6 6,4 6,6 7,1 7,7 7,5 7,0 0,4 6,8 FR 8,4 8,2 7,9 7,9 7,9 8,0 7,9 7,5 7,7 7,5 -0,9 8,0 IT 10,6 10,8 10,6 10,5 10,4 10,4 10,9 11,4 11,7 11,7 1,1 10,7 CY 3,6 3,9 4,3 4,4 3,5 3,9 4,6 6,3 5,0 3,9 0,3 4,3 LV 5,6 5,5 5,6 5,8 5,9 5,7 6,0 6,1 6,3 5,4 -0,2 5,8 LT 7,7 7,2 6,9 6,5 6,8 6,9 6,8 6,7 6,6 4,1 -3,6 6,9 LU 7,2 7,0 6,4 6,5 6,6 7,1 7,5 7,4 7,7 7,7 0,5 7,0 HU 7,1 7,5 7,5 7,0 6,6 6,6 6,7 7,1 7,7 7,3 0,2 7,0 MT 5,6 6,2 6,1 6,3 6,4 6,3 6,4 5,9 5,8 6,3 0,7 6,2 NL 6,0 6,2 6,8 6,5 6,0 6,6 7,0 7,4 7,2 8,6 2,6 6,6 AT 10,1 10,8 10,5 10,5 10,2 9,6 9,7 10,0 10,4 10,0 -0,1 10,2 PL 4,4 4,5 4,3 4,2 3,6 3,9 4,6 5,3 5,4 4,6 0,2 4,4 PT 5,6 5,6 5,4 5,4 5,2 5,3 5,5 5,7 5,8 5,7 0,1 5,5
RO 3,3 3,3 2,7 2,8 2,8 2,3 2,8 3,3 3,4 3,5 0,2 2,9
SI 5,6 5,7 5,7 5,7 5,7 5,5 5,8 5,7 5,9 5,9 0,3 5,7 SK 3,4 3,5 3,3 3,2 2,7 2,6 2,5 2,6 2,8 2,4 -1,0 3,0 FI 14,5 14,0 13,9 13,7 13,3 13,5 13,2 13,0 13,3 13,4 -1,1 13,6 SE 17,2 16,0 14,7 15,2 15,4 15,5 15,5 14,6 14,2 16,4 -0,8 15,5 UK 10,6 10,6 10,2 9,8 9,8 10,2 10,4 10,5 10,7 10,4 -0,2 10,3 UE27 8,2 8,1 7,9 7,9 7,7 7,7 7,8 8,0 8,1 8,0 - - UE25 8,5 8,5 8,3 8,3 8,1 8,1 8,2 8,4 8,5 8,4 - - UE15 10,6 10,5 10,2 10,1 10,0 10,1 10,1 10,2 9,7 10,7 - - NSM12 5,2 5,2 5,1 5,1 4,9 4,7 4,9 5,2 5,2 4,6 - - Source www.europa.eu.int, Statistic Eurostat
Regarding the share of personal income in GDP for countries of the EU in the period 2000-2009 (table no. 1.) we see that the average values for this indicator in the EU27 varies between 7,7% - 8,2%.
In the period under review, significant reductions in personal income taxes in GDP were recorded in Lithuania (from 7,7% in 2000 to 4,1% in 2009), Belgium (13,2% in 2000 to 12,2% in 2009), Bulgaria (from 4,1% in 2000 to 2,9% in 2009), Czech Republic (from 4,6% in 2000 to 3,6% in 2009), Slovakia (from 3,4% in 2000 to 2,4% in 2009) and Finland (from 14,5% in 2000 to 13,4% in 2009).
At the same time significant increases in personal income tax share of GDP were recorded in Denmark (from 25,6% in 2000 to 26,5% in 2009), Malta (from 5,6% in 2000 to 6,3% in 2008) and the Netherlands (from 6,0% in 2000 to 8,6% in 2009).
12,2 2,9 3,6 26,5 9,75,7 7,95,1 7 7,511,7 3,9 5,4 4,1 7,7 7,3 6,3 8,6 10 4,6 5,7 3,5 5,9 2,4 13,4 16,4 10,4 0 5 10 15 20 25 30 2000 2009
Chart no. 2. GDP personal income tax rates in EU Member States, in 2009 compared to 2000
From the data presented above we observe that the EU average rank registered in 2009 (8,0%) are only to a total of 9 countries: Belgium (12,2%), Denmark (26,5%), Germany (9,7%) , Italy (11,7%), Netherlands (8,6%), Austria (10,0%), Finland (13,4%), Sweden (16,4%), the UK (10,4%), and below this average remaining EU Member States: Bulgaria (2,9%), Czech Republic (3,6%), Estonia (5,7%), Ireland (7,9%), Greece (5,1%) Spain (7,0%), France (7,5%), Cyprus (3,9%), Latvia (5,4%), Lithuania (4,1%), Luxembourg (7,7%), Hungary (7,3%), Malta (6,3%), Poland (4,6%), Portugal (5,7%), Romania (3,5%), Slovenia (5,9%), Slovakia (2, 4%).
3.
Analysis of the share of income tax in total tax revenue in Romania and other European
Union member states
In 2009 the share of income tax in total tax revenue recorded a high level in Denmark (55.1%), followed by Sweden (31.2%). Slovakia was the opposite with a level of this share of 8.4%.
In Romania, at the same time, the share of income tax in tax revenue was 13.1%, with 1 percentage point more than the previous year and by 4.8 percentage points more than the level registered in the introduction of flat taxation.
The 1995-2009 time major growth occurred in Denmark (3.2%), Spain (3.6%), Greece (2.5%), Luxembourg (2.5%). Significant reductions occurred in Lithuania (11.5%), Czech Republic (3.0%), Estonia (6.2%).
28 10,2 10,5 55,1 24,4 15,9 27,8
16,923,118 27,1 11,2 20,4 14,1 20,8 18,5 18,3 22,5 23,4
14,618,513,115,7 8,4 31,2 35 29,9 0 20 40 60 80 100 120
BE BG CZ DK DE EE IE EL ES FR IT CY LV LT LU HU MT NL AT PL PT RO SI SK FI SE UK
2009 2000
Graph no. 2. Evolution of the share of income tax in total tax revenue in the EU27, 2009 vs. 2000 (%)
%
Significant changes in the time period 2000 - 2008 took place in Estonia (by -6.2 percentage points), Lithuania (-11.5%), Czech Republic (-3.0%), Portugal (-2.3%) as results from the chart. 3.
BE
BG CZ
DK
DE
EE IE
GR ES
FR ITCYLV
LT LU
HU MT NL
ATPL PT
ROSI
SK FI
SE UK
-15 -10 -5 0 5 10
0 5 10 15 20 25 30
Y-Values
Graph no. 3. The change in personal taxes in total tax revenue in EU Member States, in 2009 compared to 2000
According to the chart. 3, in 2000-2009, the share of personal taxes in total tax revenue recorded growth in 16 countries: Denmark, Ireland, Greece, Spain, Italy, Lithuania, Luxembourg, Netherlands, Austria, Poland, Portugal, Romania, Slovakia, Finland, Sweden and the United Kingdom and in a much larger number of countries there was a decrease in the share of personal taxes total tax revenues: Belgium, Bulgaria, Czech Republic, Estonia, France, Cyprus, Latvia, Malta. Depending on the average share of personal income taxes in total tax revenue for the period under review we group the countries into four categories according to chart. 4.
Graph no. 4. The level of personal taxes in total tax revenue in the EU27, during 2000-2009
BG CZ
EL FR CY LU HU MT NL PL PT SI RO EE SK
BE DE LV IE ES UK IT LT AT
4.
Personal income tax rates for employees in the eu27
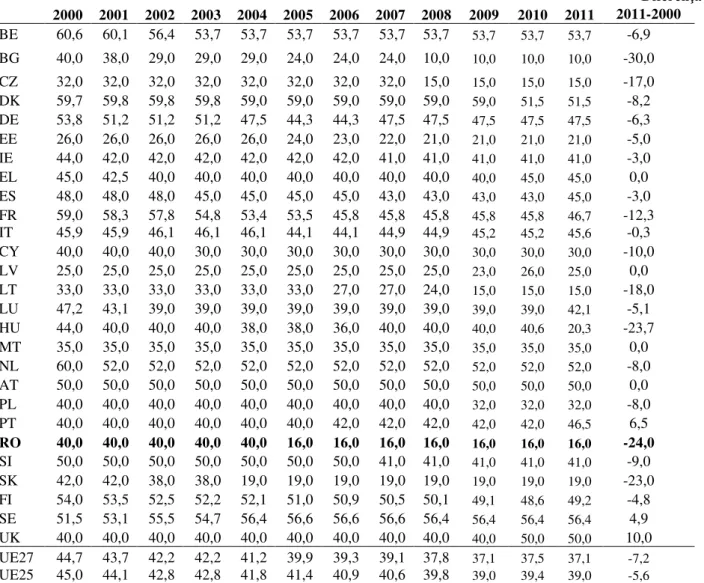
Tabel no. 2
Personal income tax rates for employees in the EU from 2000-2011 (%)
Diferenţă 2000 2001 2002 2003 2004 2005 2006 2007 2008 2009 2010 2011 2011-2000
BE 60,6 60,1 56,4 53,7 53,7 53,7 53,7 53,7 53,7 53,7 53,7 53,7 -6,9 BG 40,0 38,0 29,0 29,0 29,0 24,0 24,0 24,0 10,0 10,0 10,0 10,0 -30,0 CZ 32,0 32,0 32,0 32,0 32,0 32,0 32,0 32,0 15,0 15,0 15,0 15,0 -17,0 DK 59,7 59,8 59,8 59,8 59,0 59,0 59,0 59,0 59,0 59,0 51,5 51,5 -8,2 DE 53,8 51,2 51,2 51,2 47,5 44,3 44,3 47,5 47,5 47,5 47,5 47,5 -6,3 EE 26,0 26,0 26,0 26,0 26,0 24,0 23,0 22,0 21,0 21,0 21,0 21,0 -5,0 IE 44,0 42,0 42,0 42,0 42,0 42,0 42,0 41,0 41,0 41,0 41,0 41,0 -3,0 EL 45,0 42,5 40,0 40,0 40,0 40,0 40,0 40,0 40,0 40,0 45,0 45,0 0,0 ES 48,0 48,0 48,0 45,0 45,0 45,0 45,0 43,0 43,0 43,0 43,0 45,0 -3,0 FR 59,0 58,3 57,8 54,8 53,4 53,5 45,8 45,8 45,8 45,8 45,8 46,7 -12,3 IT 45,9 45,9 46,1 46,1 46,1 44,1 44,1 44,9 44,9 45,2 45,2 45,6 -0,3 CY 40,0 40,0 40,0 30,0 30,0 30,0 30,0 30,0 30,0 30,0 30,0 30,0 -10,0 LV 25,0 25,0 25,0 25,0 25,0 25,0 25,0 25,0 25,0 23,0 26,0 25,0 0,0 LT 33,0 33,0 33,0 33,0 33,0 33,0 27,0 27,0 24,0 15,0 15,0 15,0 -18,0 LU 47,2 43,1 39,0 39,0 39,0 39,0 39,0 39,0 39,0 39,0 39,0 42,1 -5,1 HU 44,0 40,0 40,0 40,0 38,0 38,0 36,0 40,0 40,0 40,0 40,6 20,3 -23,7 MT 35,0 35,0 35,0 35,0 35,0 35,0 35,0 35,0 35,0 35,0 35,0 35,0 0,0 NL 60,0 52,0 52,0 52,0 52,0 52,0 52,0 52,0 52,0 52,0 52,0 52,0 -8,0 AT 50,0 50,0 50,0 50,0 50,0 50,0 50,0 50,0 50,0 50,0 50,0 50,0 0,0 PL 40,0 40,0 40,0 40,0 40,0 40,0 40,0 40,0 40,0 32,0 32,0 32,0 -8,0 PT 40,0 40,0 40,0 40,0 40,0 40,0 42,0 42,0 42,0 42,0 42,0 46,5 6,5
RO 40,0 40,0 40,0 40,0 40,0 16,0 16,0 16,0 16,0 16,0 16,0 16,0 -24,0
SI 50,0 50,0 50,0 50,0 50,0 50,0 50,0 41,0 41,0 41,0 41,0 41,0 -9,0 SK 42,0 42,0 38,0 38,0 19,0 19,0 19,0 19,0 19,0 19,0 19,0 19,0 -23,0 FI 54,0 53,5 52,5 52,2 52,1 51,0 50,9 50,5 50,1 49,1 48,6 49,2 -4,8 SE 51,5 53,1 55,5 54,7 56,4 56,6 56,6 56,6 56,4 56,4 56,4 56,4 4,9 UK 40,0 40,0 40,0 40,0 40,0 40,0 40,0 40,0 40,0 40,0 50,0 50,0 10,0 UE27 44,7 43,7 42,2 42,2 41,2 39,9 39,3 39,1 37,8 37,1 37,5 37,1 -7,2
UE25 45,0 44,1 42,8 42,8 41,8 41,4 40,9 40,6 39,8 39,0 39,4 39,0 -5,6
Source
www.europa.eu.int
, Statistic Eurostat
Analyzing the data presented in the table above we see that EU income taxes on personal record high values, which demonstrates once again that labor taxes have a high level within the European Community.
In the paper"The structure of tax systems in the EU" is made a classification of taxes on work, taking into account the distinct between employees and unemployed.
All these changes are mainly due to changes to the income tax system. In order to determine income tax rates are frequently used proportional or progressive quotes, meeting frequently in the EU imposition proportionate share, as its shares dropped gradually progressive imposition composed (in installments). In table no. 2. are personal income tax rates for employees in the EU27. Member States have implemented a wide range of fiscal measures that had the effect of stimulating employment.
Reduce tax rates of wages was an important element of the targeted increase in labor supply or aimed at improving the living conditions of people with low incomes.
Graph no. 5 Statutory rates of personal income tax of employees in EU member states in 2011
In the EU Member States another indicator in order to express the employment tax burden is implicit tax rate on labor.
Implicit tax on labor share (implicit tax rates on labor) is defined as the sum of all direct and indirect taxes and social contributions of employers and employees required and placed on the income from employment (employees) divided by total compensation (payments) employees thus income from wages
100
_
_
_
_
x
incomes
wage
work
employeed
on
taxes
CIIM
=
(1)
Implicit tax on labor share is calculated only for employment (employee - employed labor), avoiding thus translating the tax burden on social transfers, including pensions (ie unemployed workers - non-employed labor). Direct taxes are defined as direct tax burden that reduces individual income. Called indirect taxes on labor income, currently applied in some Member States are taxes like those on payroll paid by the employer. Employers taxes include all taxes related to wages, especially withholding paid by the employee and the employer, including compulsory social contributions. It consists of taxes on personal income derived from various sources of employment, income from social benefits including pensions, dividends and interest of persons employed, retained compulsory social contributions on payroll employees, mandatory social security contributions paid by employers.
can hide important variations in real rates / effective tax from a household type to another or from one employee to another.
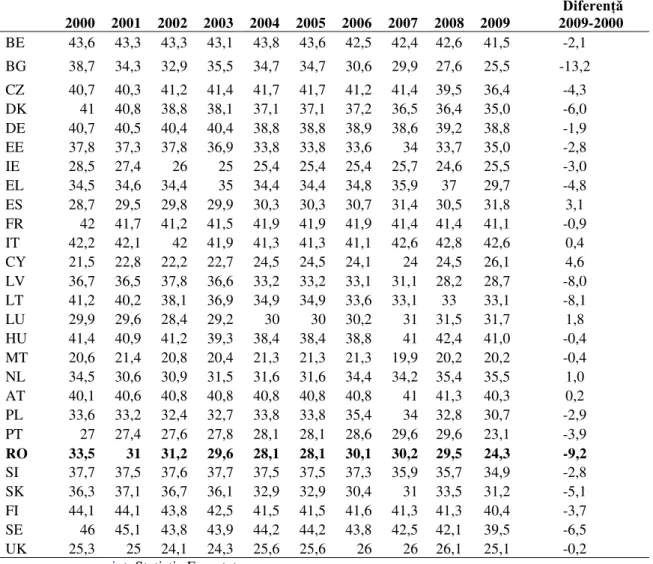
Tabel no. 3
Default rates of taxation on work in Member States of the European Union
during 2000-2009
2000 2001 2002 2003 2004 2005 2006 2007 2008 2009
Diferență 2009-2000
BE 43,6 43,3 43,3 43,1 43,8 43,6 42,5 42,4 42,6 41,5 -2,1 BG 38,7 34,3 32,9 35,5 34,7 34,7 30,6 29,9 27,6 25,5 -13,2 CZ 40,7 40,3 41,2 41,4 41,7 41,7 41,2 41,4 39,5 36,4 -4,3 DK 41 40,8 38,8 38,1 37,1 37,1 37,2 36,5 36,4 35,0 -6,0 DE 40,7 40,5 40,4 40,4 38,8 38,8 38,9 38,6 39,2 38,8 -1,9 EE 37,8 37,3 37,8 36,9 33,8 33,8 33,6 34 33,7 35,0 -2,8 IE 28,5 27,4 26 25 25,4 25,4 25,4 25,7 24,6 25,5 -3,0 EL 34,5 34,6 34,4 35 34,4 34,4 34,8 35,9 37 29,7 -4,8 ES 28,7 29,5 29,8 29,9 30,3 30,3 30,7 31,4 30,5 31,8 3,1 FR 42 41,7 41,2 41,5 41,9 41,9 41,9 41,4 41,4 41,1 -0,9 IT 42,2 42,1 42 41,9 41,3 41,3 41,1 42,6 42,8 42,6 0,4 CY 21,5 22,8 22,2 22,7 24,5 24,5 24,1 24 24,5 26,1 4,6 LV 36,7 36,5 37,8 36,6 33,2 33,2 33,1 31,1 28,2 28,7 -8,0 LT 41,2 40,2 38,1 36,9 34,9 34,9 33,6 33,1 33 33,1 -8,1 LU 29,9 29,6 28,4 29,2 30 30 30,2 31 31,5 31,7 1,8 HU 41,4 40,9 41,2 39,3 38,4 38,4 38,8 41 42,4 41,0 -0,4 MT 20,6 21,4 20,8 20,4 21,3 21,3 21,3 19,9 20,2 20,2 -0,4 NL 34,5 30,6 30,9 31,5 31,6 31,6 34,4 34,2 35,4 35,5 1,0 AT 40,1 40,6 40,8 40,8 40,8 40,8 40,8 41 41,3 40,3 0,2 PL 33,6 33,2 32,4 32,7 33,8 33,8 35,4 34 32,8 30,7 -2,9 PT 27 27,4 27,6 27,8 28,1 28,1 28,6 29,6 29,6 23,1 -3,9
RO 33,5 31 31,2 29,6 28,1 28,1 30,1 30,2 29,5 24,3 -9,2
SI 37,7 37,5 37,6 37,7 37,5 37,5 37,3 35,9 35,7 34,9 -2,8 SK 36,3 37,1 36,7 36,1 32,9 32,9 30,4 31 33,5 31,2 -5,1 FI 44,1 44,1 43,8 42,5 41,5 41,5 41,6 41,3 41,3 40,4 -3,7 SE 46 45,1 43,8 43,9 44,2 44,2 43,8 42,5 42,1 39,5 -6,5 UK 25,3 25 24,1 24,3 25,6 25,6 26 26 26,1 25,1 -0,2 Source: www.europa.eu.int, Statistic Eurostat
In 2009 default rate in Romania implicit working tax was 29.5%, ie by 7.8 percentage points less the maximum level then recorded in 2000 (33.5%).
Highest levels of implicit tax rates in work has recorded in countries such as Belgium, France, Italy, Hungary, Austria, Finland and Sweden above 40% level. At the opposite end is Ireland, Cyprus, Malta, where taxation has default rates of around 21%.
5.
Conclusions
At European Union level, in order to determine taxes for individuals, are taking into account the family status in the following situations:
1. Are taking into account the implementation of tax schemes that vary depending on family status. In some countries, the tax element is individual. This situation is typical of countries like Italy, Netherlands, United Kingdom. In contrast, in countries like France, Germany, Ireland and option of Spain, are taken into account the family in order to determine the amount of taxation.
children and is found in countries like France, Italy, Spain, Ireland, United Kingdom
In conclusion, we believe that increasing taxes on labor, as a part of the work offer determine to move towards informal work activities. Therefore, increasing tax generate reduction of work suply that generates decreasing tax revenues, while tax evasion development.
6.
References
:
1. Tatoiu A.M., Harmonization of tax systems in the complex integration in the European Union, House Book of Science, Cluj Napoca, 2008
2. Chirculescu M.F., Taxation. Theory and applications, Academic Publishing Brâncusi, 2010;
3. Popeangă V.N., Popeangă V., Direct taxes. National and international approaches, Focus Publishing House,
Petroşani, 2002;
4. Turcitu F.,, Socio-psychological income tax Mirton Publishing House, Timisoara,
5. Corduneanu C., Tax system in the science of finance, Publishing House Codecs, Bucharest, 1998;
6. Georgescu L., Moldovan N., Belea S., Danila S, Taxes and fees. Theory and Practice, Ph Romanian University Press, Timisoara, 2001;
7. Mărginean I., A. Balasa, Quality of life in Romania, Expert Publishing House, 2002
8. Mosteanu N.R., Taxation. Taxes and fees. Case Studies, University Publishing House, Bucharest, 2008 9. Mutaşcu M., Elements of tax theory, Mirton Publishing House, Timisoara, 2006