PAPER REF: 5710
! "#$% & ' () ' % ( * & +,-% .* )*/ ! 1
LAETA & INEGI / UMNMEE, Polytechnic Institute of Bragança, Bragança, Portugal
2
Polytechnic Institute of Bragança, Bragança, Portugal
3
Department of Mechanical Engineering (EPSZ), University of Salamanca, Spain
(*)
Partially Encased Beams (PEBs) are composite steel and concrete elements in which the web of the steel section is encased by reinforced concrete. The experimental investigation of the bending resistance was already verified in fire and under elevated temperature (Paulo A. G. Piloto ., 2013a) (Paulo A. G. Piloto ., 2013b). The three&dimensional finite element solution, with precise detail of each component (steel profile, reinforcement, stirrups and concrete) was used to determine the bending resistance under three point bending configuration. Four temperature levels were tested (20, 200, 400 and 600 ºC) and three lengths were considered (2.5, 4.0 and 5.5 m), using three different cross section types, based on the dimensions of IPE100, IPE200 and IPE300 steel profiles. Two distinct types of welded stirrups were simulated (PEBA with “C” shape stirrups welded to the web and PEBB with “I” shape stirrups welded to the flange). The solution method is incremental and iterative (arc length), based on geometric and material non&linear analysis (ANSYS), using reduced integration method. Results are in accordance to the new formula presented (P. M. M Vila Real , 2004) and adapted to partially encased beams. The bending resistance was not significantly influenced by the type of welded stirrup.
Partially Encased Beams, Numerical simulation, Fire, Elevated temperature, Composite Steel and Concrete.
0
1
2
tested fifteen PEB under fire conditions (small series) using three&point bending test to determine fire resistance. Results revealed the dependence of fire resistance on load level. Particular emphasis was given to the critical temperature on the composite section. Paulo Piloto et al. (Paulo Piloto et al., 2013b) determined the PEB bending resistance at elevated temperature (20, 200, 400 and 600 ºC) and compared also the resistance and the post buckling deformation behaviour with bare steel beams.
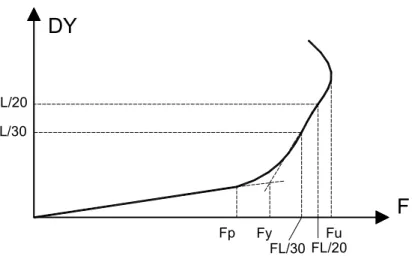
A total of 72 PEB models were simulated, showing conservative results with respect to the simple calculation method. The bending resistance of PEB was determined by numerical simulation and determined for different load events (The proportional limit force ; the force using the intersection method between two straight lines drawn from linear and non& linear interaction of the vertical displacement; the load event for the displacement limits /20 and /30; and the maximum load level for the asymptotic behaviour of lateral displacement
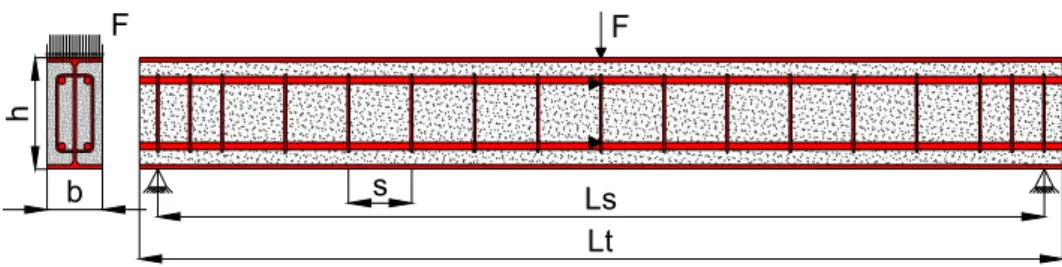
). The lateral torsional buckling analysis is presented for three types of cross section, two types of stirrups shape, three different lengths and four temperature levels. Table 1 presents the main characteristics of each beam under simulation also with mesh information (number of elements and nodes). Three&point bending test was considered, see Fig. 1. Special boundary conditions to simulate fork supports were defined. Each simulation used an incremental and iterative procedure to determine the bending resistance.
Table 2& Characteristics of PEB to be simulated at elevated temperature.
Id. Reinf. [mm]
Stirrups Dim. [mm]
Stirrups shape
stirrups spacing (S) [m]
Lt [m]
Ls [m]
Nodes Number
Elements Number
PEBA100_2,4F Ø10 Ø6 C 0,167 2,5 2,4 187473 171648 PEBA100_3,9F Ø10 Ø6 C 0,167 4,0 3,9 290301 266112 PEBA100_5,4F Ø10 Ø6 C 0,167 5,5 5,4 404415 370944 PEBA200_2,4F Ø12 Ø6 C 0,100 2,5 2,4 200165 183600 PEBA200_3,9F Ø12 Ø6 C 0,100 4,0 3,9 321195 294984 PEBA200_5,4F Ø12 Ø6 C 0,100 5,5 5,4 439565 403920 PEBA300_2,4F Ø20 Ø6 C 0,171 2,5 2,4 197715 182240 PEBA300_3,9F Ø20 Ø6 C 0,171 4,0 3,9 312375 288320 PEBA300_5,4F Ø20 Ø6 C 0,171 5,5 5,4 427035 394400 PEBB100_2,4F Ø10 Ø6 I 0,167 2,5 2,4 187473 171648 PEBB100_3,9F Ø10 Ø6 I 0,167 4,0 3,9 290301 266112 PEBB100_5,4F Ø10 Ø6 I 0,167 5,5 5,4 404415 370944 PEBB200_2,4F Ø12 Ø6 I 0,100 2,5 2,4 257985 238000 PEBB200_3,9F Ø12 Ø6 I 0,100 4,0 3,9 321195 294984 PEBB200_5,4F Ø12 Ø6 I 0,100 5,5 5,4 439565 403920 PEBB300_2,4F Ø20 Ø6 I 0,171 2,5 2,4 197715 182240 PEBB300_3,9F Ø20 Ø6 I 0,171 4,0 3,9 312375 288320 PEBB300_5,4F Ø20 Ø6 I 0,171 5,5 5,4 427035 394400
3
Fig. 1 & Simple supported PEB with three point bending simulation.
Fig. 2 presents all six different cross sections in analysis. Three different lengths between supports ( = 2.4, 3.9 and 5.4 m) were analysed. PEB were considered laterally unrestrained with exception to the supports, where two fork supports were simulated.
a) PEBA100 b) PEBA200 c) PEBA300
a) PEBB100 b) PEBB200 c) PEBB300
4
0
The bending resistance of the cross section may be determined by the capacity of the cross section to form a plastic hinge and by the capacity of the structural element to avoid lateral torsional buckling, see Fig. 3. To increase visibility of rebar and stirrups, one side of the encased concrete was removed from the post buckling deformed shape model.
(a) Plastic Hinge (b) Lateral torsional Buckling Fig. 3 & Ultimate Limit States for bending resistance of PEB.
The geometric properties of the composite section should consider the effect of both materials, being the concrete part taken in to account by the homogenized steel section method. Certain hypotheses were taken into to account, regarding the inertia characteristics of the cross section, in particular: the warping constant of the concrete part is neglected for the benefit of an easy application, the torsion constant and the second order moment of inertia , are calculated by the summation of the steel part and the homogenized part of concrete.
0
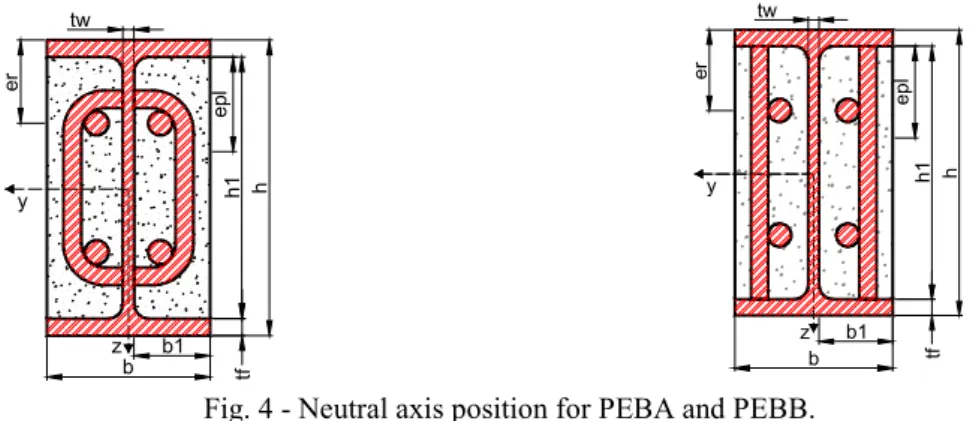
The bending resistance of the cross section depends on the position of the neutral axis, Eq. 1. Fig. 4 depicts the position of this axis, , for both PEB with welded stirrups in C&shape and I&shape.
Fig. 4 & Neutral axis position for PEBA and PEBB.
5
thickness, and represent the width and the thickness of the flange. The nominal design strength values for the steel of the profile and reinforcement are defined by and , while
represents the design strength of concrete in compression.
( )
(
)
( ) 0,85 2 85 , 0 ' ⋅ − + ⋅ ⋅ − + ⋅ ⋅ − + = (1)
Finally the plastic moment can be calculated accordingly to Eq. 2.
( − ) +⋅ ( − )+ ( − ) (⋅ − )
−
= , 1 2 2 0,85 21 0.51 0.5 2 2
, (2)
0
The bending resistance of the cross section at elevated temperatures should take into consideration the effect temperature in the material properties. The position of the neutral axis is modified according to Eq. 3 and the bending resistance moment should be updated according to Eq. 4.
( )
(
)
( ) θ
θ θ θ θ θ , , , ' , , , 85 , 0 2 85 , 0 ⋅ − + ⋅ ⋅ − + ⋅ ⋅ − + = (3) ( − ) + ⋅ ( − )+ ( − )⋅( − ) −
= , , , 1/2 , 2 0,85 , 2 1 , 0.51 0.5 , 2 , , /2
,
,θ θ θ θ θ θ θ θ θ (4)
The bending resistance for unrestrained beams shall be determined by Eq. 5. The Lateral Torsional Buckling (LTB) resistance depends on the modified reduction factor, χ ,mod. This reduction factor was introduced to include the effect of load type (bending moment diagram). A careful examination of the general procedure of Eurocode 3 part 1.1 (CEN, 2005c) quickly reveals that the influence of the bending moment diagram on the LTB resistance of the beam only appears indirectly through the value of the elastic critical moment and directly in this modified reduction factor.
, mod ,
, =χ × (5)
The plastic moment should be calculated according to Eq. 2. The modified reduction factor is determined by: = χ λ
χ min 1; 1 ;
2 mod
The non&dimensional slenderness λ , the intermediate factor φ , the reduction factor χ
and the factor should be determined according to Eqs. 7&10. The former factor depends on the non&dimensional slenderness and on the correction factor =0.86 used for this bending
diagram. The intermediate factor depends on the reference value for the slenderness λ ,0=0.2
and on the β=1.0 factor. These parameters were determined in accordance to National Annex
(IPQ, 2010). + − × = 2 2 1 λ β φ φ χ (7)
(
)
(
2)
0 ,
1 5 ,
0 α λ λ β λ
φ = + + × − + × (8)
, = λ (9) ( )
(
)
− × − × − × −=1 0,5 1 1 2 λ 0,82 (10)
The imperfection factor α , depends on the type of buckling curve adapted. The calculation of the non&dimensional slenderness depends on the ratio between the plastic moment and the critical moment. The critical moment depends on the load type and on the boundary conditions. For the case of 3 point bending simulation Eq. 11 applies.
( ) ( )
[
]
− + + =" 2 # "2 ! 2 "2 !
2 2 2 2 1 π π (11)
In Eq.11, Ls represents the length of the beam between supports with lateral restraint, C1 and C2 are factors that depend on loading and end restraint conditions. The parameter Kz =1 is the effective length factor and refers to the out of plane buckling length, ranging from 0.5 (perfect restraint) to 1 (no restraint). The parameter Kw refers to the warping condition of the beam ends and uses the same range. The parameter Zg=Za&Zs=h/2 represents the location of the point load, Za=h/2 and Zs=0 are the coordinate position to the point load and shear centre, both with respect to centroid of the cross section. Table 2 presents the resume of all the factors considered to this testing case.
Table 2 & Effective length factors, load factors and restraints to deformed shapes.
Type of load
Value of the factor 1
" "2
The uniform temperature in the cross§ion has been used so that comparison between the finite element results and the simple calculation formula of Eurocode can be made. In this paper the temperatures used were 200, 400 and 600 ºC, deemed to adequately represent the majority of practical situations under fire conditions. In order to provide the background for the subsequent parametric study, the Eurocode provisions for the lateral&torsional buckling of beams at elevated temperatures are described in detail, based on the assumption of an equivalent steel beam.
The LTB resistance moment under fire, according to P. M. M Vila Real (2004), depends on the modified reduction factor and on the bending resistance of the homogenised cross section for time “t”, during fire.
, , mod , , , ,
, =χ × (12)
This bending resistance is calculated for the design value of the resisting moment of the cross section to a uniform temperature, where 1 and 2 are adaptive factors to non uniform temperature distributions in section and along the beam. For the case of uniform temperature, both factors are equal to unity.
( 1 2)
, , ,
, = θ ⋅ (13)
The bending resistance of this cross sections should be calculated according to Eq. 4. The modified reduction factor χ , ,mod is determined by:
= , mod ,
, min 1;
χ
χ (14)
The non&dimensional slenderness under fire λ , and at elevated temperatureλ ,θ,$ , the
intermediate factor φ ,θ,$ , the reduction factor χ , and the factor should be determined according to Eqs. 15&19. The former factor depends on the correction factor =0.79 used for
this bending diagram. The imperfection factor α depends on the steel grade.
+ − = 2 , 2 , , , , , 1 $
$ φ λ
φ χ
θ
θ (15)
(
1)
;5 , 0 2 , , ,
, $ α λ λ
φ θ = + + × + (16)
/ 235 65 , 0 = α (17) θ θ λ
λ , = , ,$ = ,, / , (18)
(1 ,θ)
5 , 0
1− × −
-The critical moment at elevated temperature was calculated accordingly to Eq. 11, affecting the material properties of both materials with the appropriate reduction coefficients.
0
The bending resistance of Partially Encased Beams was defined using the three dimension model and determined by an incremental and iterative solution, based on the arc&length method. The geometric and material nonlinear analysis is considered, establishing the equilibrium in the deformed shape model for each load increment. The maximum load increment was 2000 N and the minimum was 20 N. This last value was defined as small as possible to follow the post buckling behaviour.
For the beams under investigation, all kind of imperfections were included, in particular the out&of&straightness, the residual stresses of the steel beam and the inhomogeneities of the encased concrete. This global imperfection was modelled by means of an equivalent out&of& straightness, defined as L/600 for maximum lateral displacement at mid span. The imperfection mode shape was determined by the result of an elastic stability analysis.
0
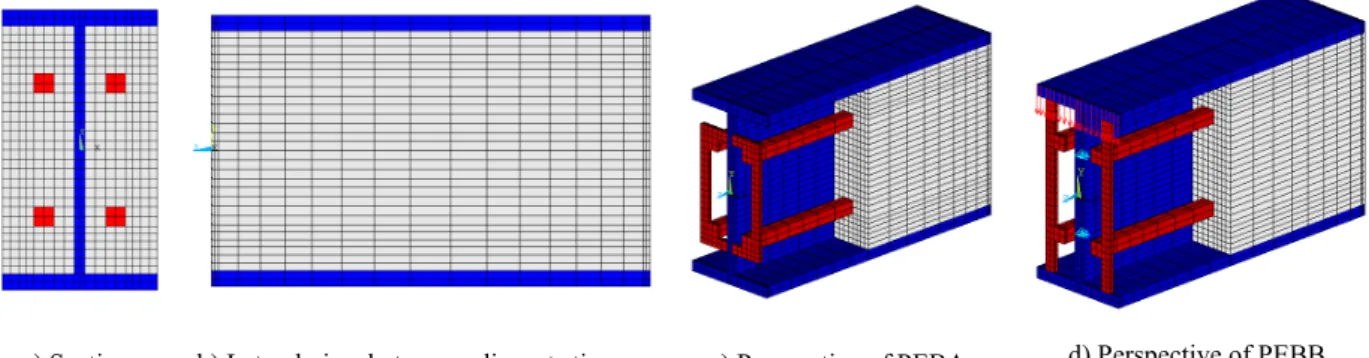
The three dimensional model used finite solid elements, with eight nodes and three degrees of freedom in each node (translations). The SOLID 65 finite element was used to model the concrete and the SOLID 185 was used to model each steel component (profile, stirrups and rebars). The dimension of the mesh was defined based on the solution convergence test of the elastic stability analysis. The maximum relative error for this convergence test was smaller than 0.5%. The number of elements used for each simulation is presented in table 1.
Fig 5 represents a small portion of the full 3D model, showing the two different configuration types of stirrups.
a) Section. b) Lateral view between adjacent stirrups. c) Perspective of PEBA. d) Perspective of PEBB.
Fig. 5 & Three dimension model and mesh for PEBA and PEBB.
Three types of integration methods were tested: full integration, uniform reduced integration with hourglass control and the enhanced strain integration method. The second method was adapted taking into considerations the problem type and the expected simulation time. All types of integration methods present similar post buckling behaviour with respect to vertical displacement, but different post buckling behaviour in lateral displacement. Typical result for vertical displacement is depicted in Fig. 6. The major important load events were recorded for each simulation.
Fig. 6 & Typical vertical displacement for bending simulation of PEB.
0
Steel grade S275 was selected for hot rolled steel profile and S500 was selected to model steel reinforcement. C20/25 was the class adapted for concrete. Table 3 represents the main reduction coefficients to be applied to the mechanical properties of S275. This table also presents the main points used to define the stress& strain behaviour of the material.
Table 3& Mechanical properties of S275 at room and elevated temperature.
θ
, ,θ
[ ]
θ"
º
[
% 2]
[
% 2]
[
% 2]
#
[
% 2]
ν ε ε1,00 1,00 20 275 430 210 80,76
0,3
0,0013095 0,15
1,00 0,90 200 275 430 189 94,50 0,001455 0,15
1,00 0,70 400 275 430 147 73,50 0,0018707 0,15
0,47 0,31 600 129,25 202,1 65,1 32,55 0,0019854 0,15
Fig. 7 depicts the model for stress with strain hardening behaviour. The elastic modulus starts to decrease after 100 ºC, being the stress strain curves not coincident for 20, 200 and 400 ºC.
Table 4 represents the main redu of C20/25 concrete. This table a behaviour of the material.
Table 4 & Mechanica
θ
, ,θ θ
[
1,00 1,00 20 0,95 0,80 200 0,75 0,40 400 0,45 0,00 600 Fig. 8 depicts the model for stre model was considered elastic pe
Fig.
Table 5 represents the main redu of reinforcing steel. This table a behaviour of the material, under
Fig. 7 & Stress strain model to steel S275.
in reduction coefficients to be applied to the mecha table also presents the main points used to define th
hanical properties of C20/25 at room and elevated temperat
[ ]
º"[
% 2]
[
% 2]
ν ε1,θ20 28 28 30
0,2
0,000933 200 26,6 26,6 28,5 0,005500
400 21 21 22,5 0,010000
600 12,6 12,6 13,5 0,025000 or stress & strain behaviour under tension and comp stic perfectly plastic, due to the confinement of con
Fig. 8 & Stress strain model to concrete C20/25.
in reduction coefficients to be applied to the mecha table also presents the main points used to define th , under tension and compression.
mechanical properties fine the stress& strain
perature.
θ
ε 1,
00933 0,020 05500 0,025 10000 0,030 000 0,035
compression. This of concrete.
Table 5 & Mechanic θ
, ,θ θ
[ ]
"
º
[
%1,00 1,00 20 500 1,00 0,87 200 500 0,94 0,56 400 470 0,40 0,24 600 200 Fig. 9 depicts the model for stre compression. The material mod
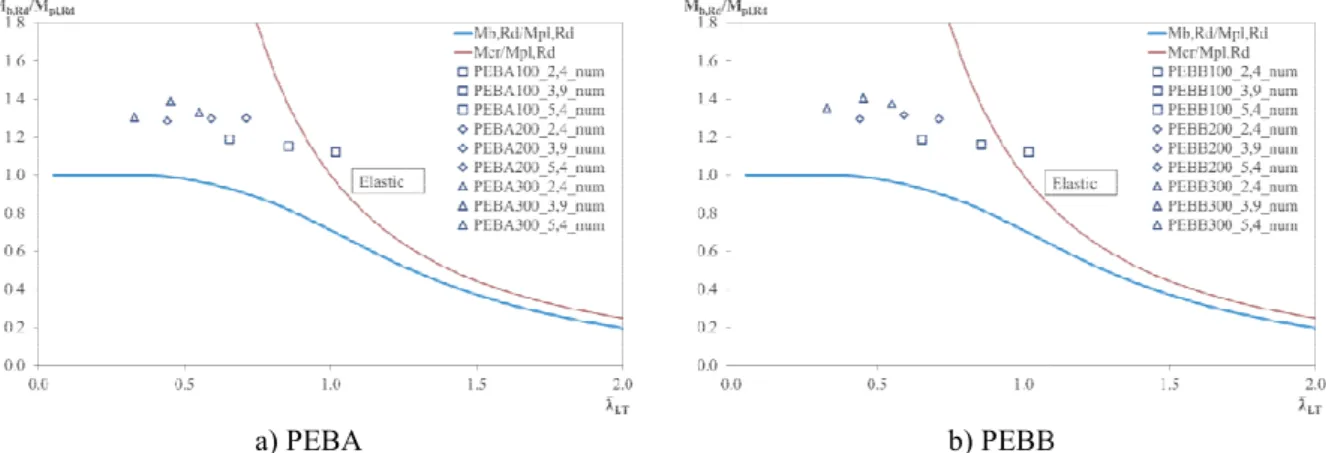
Fig. 10 depicts the results of th calculation formula of Eurocod resistance. All the simulated res Fig. 10a) corresponds to the be the web and Fig. 10b) correspo welded to the flanges.
a) PEBA Fig. 10& Lateral Torsional Buck
1
chanical properties of S500 at room and elevated temperatu
]
2
[
% 2]
[
% 2]
#[
% 2]
ν500 500 210,0 80,76923
0,3 0,0
500 500 182,7 91,35 0,0
470 470 117,6 58,8 0,0
200 200 50,40 25,2 0,0
or stress & strain behaviour of the reinforced steel, u l model was considered elastic perfectly plastic.
Fig. 9 & Stress strain model to steel S500.
s of the bending resistance defined by the lower li urocode (CEN, 2005c) and the upper limit of the ted results were determined by the load event that c the bending resistance of PEBA with “C” shape s rresponds to the bending resistance of PEBB with
b) PEBB l Buckling resistance of PEBA and PEBB at room temperatu
perature.
ε ε
0,0023810 0,15 0,0027367 0,15 0,0039966 0,15 0,0039683 0,15 steel, under tension and
wer limit of the simple of the critical moment t that corresponds to Fy. hape stirrups welded to with “I” shape stirrups
EBB
There is no significant differen conclusion is only valid for th events determined at room temp
Table 6 & Bendin
Id.
[
PEBA100_2,4F 2,4 PEBA100_3,9F 3, PEBA100_5,4F 5,4 PEBA200_2,4F 2,4 PEBA200_3,9F 3,9 PEBA200_5,4F 5,4 PEBA300_2,4F 2,4 PEBA300_3,9F 3,9 PEBA300_5,4F 5,4 PEBB100_2,4F 2,4 PEBB100_3,9F 3,9 PEBB100_5,4F 5,4 PEBB200_2,4F 2,4 PEBB200_3,9F 3,9 PEBB200_5,4F 5,4 PEBB300_2,4F 2,4 PEBB300_3,9F 3,9 PEBB300_5,4F 5,4
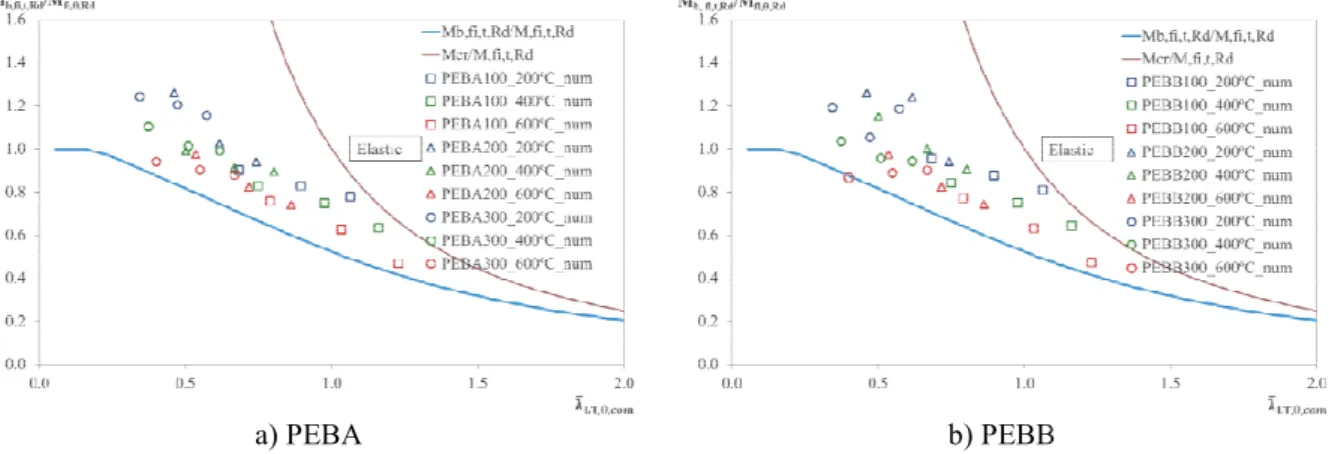
Fig. 11 depicts the results of th calculation formula proposed b the upper limit defined by the were determined for the load bending resistance of PEBA corresponds to the bending resis
a) PEBA Fig. 11& Lateral Torsional Buckli
2
ifference in the bending resistance between PEBA for the tested cross sections. Table 6 represents
temperature.
ending resistance for PEBA and PEBB at room temperature
[ ]
θ[ ]
º" [ ] % [ ] % 30[ ] % 20[ ] %2,4 20 22,00 27,05 27,88 28,69 3,9 20 13,70 16,13 16,68 17,13 5,4 20 8,50 11,35 11,68 11,99 2,4 20 145,00 154,90 166,42 170,44 3,9 20 83,00 96,30 100,90 103,98 5,4 20 59,00 69,60 71,60 73,65 2,4 20 390,00 433,50 462,53 457,65 3,9 20 250,00 283,50 309,74 307,29 5,4 20 183,00 196,50 230,86 229,72 2,4 20 23,00 27,00 27,88 28,70 3,9 20 13,50 16,25 16,68 17,13 5,4 20 9,20 11,35 11,68 11,99 2,4 20 145,00 156,00 167,67 172,23 3,9 20 76,00 97,60 101,28 104,41 5,4 20 56,00 69,40 71,82 73,89 2,4 20 385,00 449,00 461,78 456,26 3,9 20 248,00 287,00 310,26 307,54 5,4 20 178,00 203,20 234,23 232,09
s of the bending resistance defined by the lower li osed by Paulo Vila Real et al. (P. M. M Vila Real by the elastic critical moment resistance. All the load event that corresponds to Fy. Fig. 11a) co EBA with “C” shape stirrups welded to the we
g resistance of PEBB with “I” shape stirrups welde
b) PEBB Buckling resistance of PEBA and PEBB at elevated tempera
PEBA and PEBB. This sents all the other load
erature. [ ] % 34,47 18,31 12,27 172,38 115,22 87,82 463,25 310,76 230,97 34,57 18,28 12,27 176,29 117,89 89,08 462,89 312,04 234,39
wer limit of the simple a Real et al., 2004) and ll the simulated results 1a) corresponds to the the web and Fig. 11b) welded to the flanges.
EBB
3
There is no significant difference in the bending resistance at elevated temperatures between PEBA and PEBB. This conclusion is only valid for the tested cross sections. Table 7 represents all the other load events determined at different temperature levels.
Table 7& Bending resistance for PEBA and PEBB at elevated temperatures. Id.
[ ]
[ ] % [ ] % [ ] % 30 [ ] % 20 [ ] % [ ] % [ ] % [ ] % 30 [ ] % 20 [ ] % [ ] % [ ] % [ ] % 30 [ ] % 20 [ ] %
200ºC 200ºC 200ºC 200ºC 200ºC 400ºC 400ºC 400ºC 400ºC 400ºC 600ºC 600ºC 600ºC 600ºC 600ºC PEBA100_2,4F 2,4 18,00 20,50 25,38 24,02 25,85 18,40 18,55 20,02 18,85 20,92 7,50 7,90 7,60 7,35 8,17 PEBA100_3,9F 3,9 11,20 11,58 13,91 13,10 14,30 10,30 10,30 10,35 9,96 10,60 4,02 4,02 3,77 3,66 4,02 PEBA100_5,4F 5,4 7,65 7,87 8,92 8,50 9,03 6,30 6,30 6,24 6,15 6,49 2,18 2,18 2,24 2,22 2,31 PEBA200_2,4F 2,4 130,00 151,60 161,85 & 164,20 112,5
0 117,5
0 135,72 125,16 140,0
6 50,50 54,30 54,71 52,46 55,71 PEBA200_3,9F 3,9 71,00 76,00 94,42 90,68 94,78 64,50 66,30 73,73 69,41 76,65 28,20 28,20 27,46 26,67 29,06 PEBA200_5,4F 5,4 48,80 50,20 63,76 60,34 64,91 44,70 47,20 47,53 45,34 48,84 18,33 18,33 17,07 16,57 18,33 PEBA300_2,4F 2,4 325,00 412,00 449,26 443,73 450,56 260,0
0 361,0
0 399,26 & 407,0
4 115,0
0 145,5
0 169,95 & 183,4
1 PEBA300_3,9F 3,9 205,00 245,40 300,21 293,75 301,07 180,0
0 204,0
0 232,30 207,71 257,0
2 80,00 85,80 94,89 88,53 102,3
0 PEBA300_5,4F 5,4 147,00 170,00 214,19 193,41 220,27 127,0
0 144,0
0 158,37 143,08 176,0
0 60,30 60,30 61,68 58,78 67,71 PEBB100_2,4F 2,4 19,50 21,70 25,41 24,10 25,88 18,75 18,85 20,09 18,95 20,97 8,06 8,06 7,65 7,40 8,22 PEBB100_3,9F 3,9 11,50 12,25 13,94 13,14 14,33 10,33 10,33 10,40 10,00 10,64 4,06 4,06 3,81 3,68 4,06 PEBB100_5,4F 5,4 7,60 8,16 8,94 8,52 9,04 6,40 6,40 6,27 6,17 6,52 2,20 2,20 2,26 2,24 2,34 PEBB200_2,4F 2,4 120,00 151,20 163,06 165,33 165,50 113,5
0 136,2
0 136,78 124,35 141,0
9 52,50 54,23 54,61 51,69 55,91 PEBB200_3,9F 3,9 71,00 91,60 94,84 91,18 95,15 65,00 72,90 74,10 69,87 76,92 28,20 28,20 27,61 26,82 29,25 PEBB200_5,4F 5,4 46,50 50,30 64,03 60,65 65,09 44,50 47,70 47,72 45,58 49,02 18,41 18,41 & & 18,41 PEBB300_2,4F 2,4 320,00 395,00 447,44 & 448,78 260,0
0 338,5
0 & & 404,6
5 110,0
0 134,0
0 & & 182,9
8 PEBB300_3,9F 3,9 174,00 215,00 300,08 293,44 301,76 174,0
0 192,5
0 232,00 208,02 257,9
2 82,50 84,50 95,19 88,79 102,6
7 PEBB300_5,4F 5,4 137,50 174,70 215,73 194,06 223,78 125,0
0 137,2
0 159,38 143,81 177,8
2 59,00 61,90 62,76 59,48 67,81
This numerical study confirms that the bending resistance of Partially Encased Beams is defined by the lateral torsional buckling (LTB) resistance. The LTB resistance at room temperature may be determined by the formula of Eurocode 3 part 1.1 (CEN, 2005c) and at elevated temperature by the new proposed formula of Paulo Vila Real et al. (P. M. M Vila Real et al., 2004), using the necessary adaptations to the characteristics of the composite section.
The parametric study of 72 full 3D simulations revealed that bending resistance decreases with the temperature of the element, being the simple calculation formula always in the safe side. From the observation of the previous Fig. 10 and Fig.11, there is a small difference between the values obtained by the simple calculation formulas and numerical results. The difference may be explained by the inexistence of damage model for tension and compression of concrete, the inexistence of relative displacement between steel and concrete and by the additional resistance of concrete in tension with respect to compression.
4
[2]&Assi I.M., A. S. M., Hunaiti Y.M. (2002). "Flexural strength of composite beams partially encased in lightweight concrete." Pakistan Journal of Applied Sciences 2(3): 320&323.
[3]&CEN (2005a). EN 1994&1&2 & Eurocode 4: Design of Composite Steel and Concrete Structures & Part 1–2: General Rules—Structural Fire Design. Brussels: 225.
[4]&CEN (2004). EN 1992&1&2 & Eurocode 2: Design of concrete structures & Part 1&2: General rules & Structural fire design. Brussels, CEN: 97.
[5]&CEN (2005b). EN 1993&1&2 & Eurocode 3: Design of steel structures & Part 1&2: General rules & Structural fire design. Brussels, CEN: 72.
[6]&CEN (2005c). EN 1993&1&1 & Eurocode 3: Design of steel structures & Part 1&1: General rules and rules for buildings. Brussels: 91.
[7]&Correia, A. J. P. M. and J. P. C. Rodrigues (2011). "Fire resistance of partially encased steel columns with restrained thermal elongation." Journal of Constructional Steel Research 67(4): 593&601.
[8]&De Nardin, S. and A. L. H. C. El Debs (2009). "Study of partially encased composite beams with innovative position of stud bolts." Journal of Constructional Steel Research 65(2): 342&350.
[9]&Elghazouli, A. Y. and J. Treadway (2008). "Inelastic behaviour of composite members under combined bending and axial loading." Journal of Constructional Steel Research 64(9): 1008&1019.
[10]&Hosser, D., T. Dorn and O. Elnesr (1994). "Experimental and Numerical&Studies of Composite Beams Exposed to Fire." Journal of Structural Engineering&Asce 120(10): 2871& 2892.
[11]&IPQ (2010). NP EN 1993&1&1 & Eurocódigo 3 & Projecto de estruturas em aço Parte 1.1: Regras gerais e regras para edifícios. Portugal: 116.
[12]&Kindmann, R., R. Bergmann, L. G. Cajot and J. B. Schleich (1993). "Effect of Reinforced&Concrete between the Flanges of the Steel Profile of Partially Encased Composite Beams." Journal of Constructional Steel Research 27(1&3): 107&122.
[13]&Kordina, K. (1989). Behaviour of Composite Columns and Girders in Fire. Fire Safety Science&Proceedings of the Second International Symposium, Tokyo, Japan, International Association for Fire Safety Science.
[14]&Kvočák, V. and L. Drab (2012). "Partially&encased composite thin&walled steel beams." Steel Structures and Bridges 2012 & 23rd Czech and Slovak International Conference 40: 91& 95.
[15]&Lindner Joachim, B. N. (2000). Lateral torsional Bucking of partially encased composite beams without concrete slab. Comp. const. in steel and concrete IV, Banff, Alberta, Canada.
[16]&Nakamura, S. and N. Narita (2003). "Bending and shear strengths of partially encased composite I&girders." Journal of Constructional Steel Research 59 (12): 1435&1453.
-5
[18]&Paulo A. G. Piloto (2013b), Ana B. R. Gavilán, Luís M. R. Mesquita, Carlos Gonçalves, Luisa Barreira, “Experimental Investigation on the Performance of Partially Encased Beams at Elevated and Room Temperature”, artigo em atas do 2º congresso Ibero&Latino&Americano em Segurança Contra Incêndios, ISBN 978&972&96524&9&3, pp: 187&196, 29 de maio a 1 de junho de 2013, Universidade de Coimbra, Portugal.
[19]&P. M. M Vila Real (2004), N Lopes, L Simões da Silva, J.&M Franssen, Lateral&torsional buckling of unrestrained steel beams under fire conditions: improvement of EC3 proposal, Computers & Structures, Volume 82, Issues 20–21, August 2004, Pages 1737&1744, ISSN 0045&7949.
[20]&R. Maquoi, C. H., V. de Ville de Goyet, M. Braham, C. Richard, C. Müller, K. Weynand, Y. Galéa, A. Bureau, F. Espiga, P. Croce, S. Caramelli, L.&G. Cajot, M. Haller (2002). Lateral torsional buckling in steel and composite beams. Technical Steel Research Final Report EUR 20888 EN. E. Commission.