Experimental Analysis of a Producer Gas Generated by a Chir
Pine Needle (Leaf) in a Downdraft Biomass Gasifier
Mr. Akhilesh Kumar
*, Mr. Ravindra Randa
***(M.Tech. student, UIT, Rajiv Gandhi Technical University, Bhopal)
** ( Assistant Professor, Department of Mechanical Engineering, UIT, Rajiv Gandhi Technical University, Bhopal)
ABSTRACT
Today’s Indian scenario is facing an unprecedented energy crisis as the conventional energy resources of India are consistently deteriorating with the limited stock of these natural minerals posing a staggering threat to the Indian economy. Among all the available resources biomass proves to be a satisfactory substitute for compensating the energy void due to these natural resources. Biomass is a renewable resource with almost zero net CO2 emission which is processed with the help of biomass gasifier which is concurrently used with a chir pine needle. The performance of the biomass gasifier system is evaluated in terms of equivalence ratio, producer gas composition, calorific value of the producer gas, gas production rate and cold gas efficiency. The experimental results are compared with those reported in the literature.
Keywords
-
Biomass, gasification, chir pine needle, downdraft gasifier, equivalence ratioI.
INTRODUCTION
Biomass refers to all biologically produced
matter and all earth’s living matter whose energy is
derived from the plant sources, such as wood from natural forests, waste from agricultural and forestry processes and industrial, human or animal waste. Furthermore, it is a renewable source of carbon which can be converted into convenient solid, liquid or gaseous fuels. Chir pine needle on the other hand is still a predominant fuel which is being used in the domestic (for cooking and water heating) in the villages of hill areas (Uttarakhand, Himachal Pradesh
and Jammu and Kashmir).The conversion
technologies for utilizing biomass can be separated into four basic categories: direct combustion processes, thermo chemical processes, biochemical processes and agro-chemical processes. In the thermo
chemical conversion technologies, biomass
gasification has attracted the highest interest as it offers higher efficiencies compared to combustion and pyrolysis. Gasification is a process of conversion of solid carbonaceous fuel into combustible gas by partial combustion. The resulting gas, known as a producer gas, is a mixture of carbon monoxide, hydrogen, methane, carbon dioxide and nitrogen. The producer gas is burnt to produce heat and steam which is used in gas turbines to produce electricity. The entire process of pyrolysis and gasification is carried out using two reactors in series. Jorapur and Rajvanshi (1997) in their significant study reported the development of a commercial-scale (1080 MJ/h) gasification system using low-density biomass such
as sugarcane leaves, bajra stalks, sweet sorghum stalks and bagasse for thermal applications. Jayah et al. (2003) used a downdraft biomass gasifier using rubber wood as biomass in tea drying unit. Thus, various experimental researches have been carried out by diversified researchers in the past for elaborating the utility of biomass energy with its regards to the proposed work.
Fig.1-Potential of chir pine for fire histories in Northern India
II.
MATERIALS
AND
METHODS
2.1
EXPERIMENTAL SETUP
The downdraft gasifier has four distinct reaction zones: (1) drying,(2) pyrolysis, (3) oxidation and (4) reduction. In downdraft gasifiers, pyrolysed gas and moisture generated both in pyrolysis and drying zone, respectively flow downwards. Biomass is fed to the gasifier and oxidized in the zone where continuous air is supplied from two air nozzles. Released heat from the biomass combustion raises the temperature of the biomass particles resting above the oxidation zone and thus they get pyrolysed. The biomass particles are then decomposed into volatiles and
charcoal in the pyrolysis zone where the released volatiles from each of the biomass particles flow downward in the packed pyrolysis bed. Due to a high temperature of the combustion zone, tar of the pyrolysed gas mixture cracks into non-condensable gases and water. The cracked pyrolysed gas mixes with the carbon dioxide generated due to combustion and the inert N2 present in the air.
This gaseous mixture passes over the hot bed of charcoal and undergoes endothermic reduction reactions. Water seal is provided at the top of the gasifier to maintain the downward flow. The total height of the gasifier is 1134.35 mm and the diameter at the pyrolysis zone is 614.44 mm and the diameter at the reduction zone is 279.12 mm. The height of the reduction zone is 139.56 mm and that of oxidation zone is approximately 67.92 mm. Further, the charcoal in the reduction zone is supported by a movable grate at the bottom of the gasifier wherein the ash produced during gasification is removed by rotating the grate using the lever arrangement provided to unclog the grate. Further, the requisite parameters of the proposed work can be studied under the various descriptive sections as mentioned below.
2.2
EXPERIMENTAL PROCEDURE
Water is filled in the container placed below the gasifier andalso in the circular trough at the top of the gasifier which act as seals and hence to prevent the gas from escaping out of the gasifier. About 500 g of charcoal is dumped as a heap into the reduction zone of the gasifier above the grate. The initial charcoal used in the present experimentation is of the same quality as that generated in the gasification experiments by pyrolysis of wood. The air is introduced in the biomass gasifier through nozzles and its flow rate, which is maintained constant through a gate valve, is measured using a rotameter. Biomass is dumped in to the oxidation zone of the biomass gasifier and around 20 ml of diesel is poured to aid the combustion of biomass. Once combustion starts properly and spread across the oxidation zone which generally takes about 3–4 min, additional 5 kg of biomass is dumped inside the gasifier and it is closed from the top by cover. It is observed that by the time combustion starts properly in the oxidation zone most of the diesel gets combusted due to volatility of diesel and very high temperature generated in the oxidation zone. The time at which the cover is closed, is taken to be the starting time of the experiment. The samples of producer gas coming out from the gas burner are collected in the syringes at five minutes interval. Results presented in this study are the averaged values obtained over 5 mininterval each for five intervals. The averaging should take care of the variation with respect to time. Sampled gas is analysed with gas chromatograph (NUCON 5765) with thermal conductivity detector. Each experimental run is carried out for 10 min. At the end of the experiment any leftover biomass and charcoal is removed from the gasifier. In the present experimental study, air flow rate is varied from 7to 14 m3/h and moisture content is varied from 4% to 12%. It is found that the locally available biomass contains moisture content ranging from 4% to 13% only and hence the experiments are conducted with this range only. Biomass consumption rate is found to vary from 7 to 11.4 kg/h.
III.
RESULT AND DISCUSSION
3.1
BIOMASS CHARACTERISTICS
The Pinus Roxburghii, generally known as chir pine needle is used as a biomass in the present gasification studies. Table 1 lists the physical properties, the proximate analysis, ultimate analysis and chemical analysis of the chir pine needle. Higher heating value (HHV) is calculated using the empirical formula given by Eq.1
HHV (MJ/kg) =0.3536 FC+ 0.1559 VM—0.0078 ASH
……….(1)
Table 1
Characteristics of Chir Pine Needle.
3.2 BIOMASS GASIFICATION
The details of the range of parameters varied in this experimental analysis are shown in Table 2. Biomass consumption rate is found to vary from 7 to 11.4 kg/h for an air flow rate varying from 7 to 14.3 m3/h respectively whereas the moisture content is varied from 0.04 to 0.11wt fraction on wet basis. Also, an equivalence ratio is defined to reflect the combined effect of air flow rate, rate of biomass supply and duration of the run. The equivalence ratio
ER= (air flow rate/biomass consumption rate)/(air flow rate/biomass consumption rate for complete
combustion) ……….(2)
The stoichiometric ratio of air flow rate to biomass consumption rate is 4.6 m3air/kg (guo, xiao, 2009) of chir pine needle. The values of equivalence ratio are calculated for each run and reported in Table2.Total mass input includes feed stock, air and total water input and total mass outputs comprise of charcoal Physical properties
Length (mm) Diameter (mm) Bulk density (kg/m3) Mass (mg)
170-250 0.7-1.3 1.808 0.6
Proximate analysis (% by wt. dry basis)
Fixed carbon (FC) Volatile matter (VM) ASH Calculated HHV
(MJ/kg)
17.16 82.29 0.55 18.8925
Ultimate analysis (% by wt. dry basis)
Carbon Hydrogen Oxygen Nitrogen
50.54 7.08 41.11 0.15
Chemical analysis (% by wt.)
Lignin Holocellulose Extractives
the detailed mass input, mass output and the mass closure for all the experimental runs. The average
mass balance closure was found to be 87.94% over five experimental runs.
Table 2
Biomass gasification experimental run details.
Run Air flow rate (m3/h) Initial moisture content
Biomass consumption rate
(kg/h)
Equivalence ratio (ER)
1 9.11 0.1 7.89 0.251
2 13.27 0.04 11.36 0.2539
3 14.32 0.04 11.2 0.278
4 13.55 0.04 10.76 0.2738
5 7.98 0.11 7.2 0.241
Table 3
Material balance.Run ER Air flow
rate (m3/h)
Input (kg/h) Output (kg/h) Mass
balance (%) Air flow
rate (kg/h)
Biomass consumption rate (kg/h)
Producer
gas flow
rate (kg/h)
Char produced (kg/h)
1 0.251 9.11 16.1247 7.89 20.3 2.15 93.5
2 0.2539 13.27 23.488 11.36 23.44 3.15 76.3
3 0.278 14.32 25.35 11.2 27.32 3.2 83.5
4 0.2738 13.55 23.98 10.76 26.515 4.16 88.3
5 0.241 7.98 14.125 7.2 19.62 1.3 98.1
The average of mass balance=87.94%
3.2.1 EFFECT OF MOISTURE CONTENT
The effect of moisture content on biomass consumption rate is shown in fig.3 which shows that with an increase in the moisture content, thebiomass consumption rate decreases. The biomass moisture content greatly effects both the operation of the gasifier and the quality of the product gas.
Fig.3 Biomass consumption rate (kg/h) 0
0.02 0.04 0.06 0.08 0.1 0.12
0 2 4 6 8 10 12
3.2.2 EFFECT OF AIR FLOW RATE
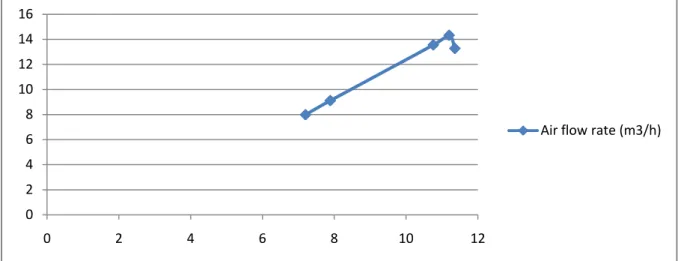
The effect of air flow rate on biomass consumption is shown in fig.4 It is found that with an increase in the air flow rate, biomass consumption rate increases. Biomass consumptionrate increases not only due to a higher combustion rate, but also due to the enhanced pyrolysis and drying rate.
Fig. 4 Biomass consumption rate (kg/h)
3.3
PERFORMANCE EVALUATION OF BIOMASS GASIFIER
3.3.1
PRODUCER GAS COMPOSITION
The gas composition of producer gas sampled at five minutes interval during gasification experiments is found using gas chromatograph (NUCON 5765) with thermal conductivity detector.
The averaged gas composition for each
experimental run is shown in Fig.5 Molar fraction of hydrogen and carbon dioxide decreases with an increase in ER up to a value of ER = 0.251 and for higher values of ER, molar fraction of hydrogen and carbon dioxide increases.
With an increase in ER from 0.25 to 0.255, increased CO2 amount in combustion zone is converted into carbon monoxide, and thereby the fraction of CO increases with ER till a value of ER = 0.251 and fraction of CO2 and N2 decreases. The increase in CO2 and decrease in CO fractions for the equivalence ratio higher than 0.251 represents that CO2 produced in combustion zone is in excess to that of the conversion capacity of reduction bed.
Fig.5 Equivalence ratio 0
2 4 6 8 10 12 14 16
0 2 4 6 8 10 12
Air flow rate (m3/h)
0 5 10 15 20 25 30 35 40
0.235 0.24 0.245 0.25 0.255 0.26 0.265 0.27 0.275 0.28
CO
H2
CO2
CnHm
CH4
3.3.2.
CALORIFIC VALUE OF GAS
Next comes the calorific value section which is given by the under mentioned equation 3 asLHV (Kj/Nm3) = 4.2 (30 CO +25.7 H
2 +85.4 CH4 +151.3 CnHm)
While table 4 reveals the gas composition & LHV of different gases with regards to air flow & biomass consumption rate as is depicted in the below mentioned table.
The variation of calorific value of the producer gas with equivalence ratio is presented in Fig.5 Carbon monoxide and hydrogen are the main components of the producer gas and are responsible for higher
calorific value. It is found that at an equivalence ratio of 0.245, the calorific value is the least at 10 MJ/Nm3. With a Small increase in the equivalence ratio at ER = 0.251, the calorific value reaches to a maximum of 10.56 MJ/Nm3 and then follows the decreasing trend. For an equivalence ratio higher than 0.251, calorific value steadily decreases with a further increase in the equivalence ratio. The increasing and decreasing trend of calorific value variation is exactly same as that of carbon monoxide variation with equivalence ratio as shown in fig.6.
Table 4
Gas composition and LHV at different air flow rate.
Run Air
flow rate (m3/h)
Biomass consumption rate (kg/h)
CO H2 CH4 CnHm O2 CO2 LHV
(MJ/Nm3)
1 9.11 7.89 29.56 31.4 6.23 1.9 0.89 30.02 10.56
2 13.27 11.36 24.59 28.49 6.58 2.32 1.61 36.41 10
3 14.32 11.2 25.53 28.93 6.82 2.35 1.48 34.88 10.28
4 13.55 10.76 25.2 29.16 8.21 2.02 1.05 34.36 10.55
5 7.98 7.2 27.92 35.39 4.36 1.31 0.91 30.11 9.734
Fig.6 Equivalence ratio
3.3.3 GAS PRODUCTION RATE
The relevant details of the gas production rate is been elaborated with the help of table 5.
fig.7 shows the effect of equivalence ratio on the producer gas production rate per unit weight of biomass (Nm3/kg)which shows that with an increase in the equivalence ratio, from 0.251 to
0.273, producer gas production rate continuously increases. After a certain value of the equivalence ratio, calorific value of the producer gas deteriorates due to higher amounts of carbon dioxide as depicted in fig.7,while the production rate of producer gas continue to increase.
9.6 9.7 9.8 9.9 10 10.1 10.2 10.3 10.4 10.5 10.6 10.7
0.235 0.24 0.245 0.25 0.255 0.26 0.265 0.27 0.275 0.28
LHV
Table 5
Gas production rate per unit weight of biomass (Nm3/kg) is illustrated in the table mentioned below.
Fig.7 Equivalence ratio
3.3.4 COLD GAS EFFICIENCY
Cold gas efficiency is defined as the ratio of energy of the producer gas per kg of biomass to the HHV of the biomass material.
Cold gas efficiency= (LHV×Gas production
rate)/HHV ……(4)
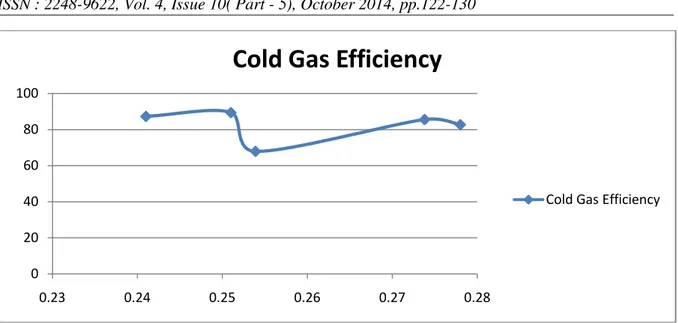
The variation of cold gas efficiency with equivalence ratio is given in fig.8. As given in Eq.4, cold gas efficiency depends upon the calorific value and the amount of producer gas released at a
constant HHV of biomass. Cold gas efficiency is at a lowest value of 0.65 for an equivalence ratio of 0.253. The value of cold gas efficiency becomes maximum at an equivalence ratio ER = 0.251. The effect of ER of on cold gas efficiency is comparatively lower for higher values of equivalence ratio where the cold gas efficiency increases from 0.65 to 0.85 for a change in the equivalence ratio from 0.253 to 0.275.
Table 6
LHV (MJ/Nm3) Gas production rate (Nm3/kg) Cold gas efficiency
10.56 1.6 89.43
10 1.283 67.91
10.28 1.52 82.71
10.55 1.532 85.55
9.734 1.694 87.28
0 0.2 0.4 0.6 0.8 1 1.2 1.4 1.6 1.8
0.23 0.24 0.25 0.26 0.27 0.28
Gas Prod. Rate
Gas Prod. Rate
Biomass consumption rate
(kg/h)
Producer gas flow rate (Nm3/h) Gas production rate
(Nm3/kg)
7.89 12.624 1.6
11.36 14.58 1.283
11.2 16.99 1.52
10.76 16.49 1.532
Fig.8. Equivalence ratio
3.4 COMPARISON OF PERFORMANCE OF BIOMASS GASIFIER
The comparison of the various assets withregards to their ER & CV value has been depicted in the below mentioned table no.7
The experimental results are compared with those reported in the literature. Hazel nutshell as a biomass was used in the gasification studies carried out by Dogru et al. (2002). The range of air-to-fuel ratio varied is 1.37–1.64 Nm3/kg and that of equivalence ratio varied is 0.262–0.314. The optimum operation of the gasifier is found to be between 1.44 and 1.47 Nm3/kg of air-to-fuel ratios at the values of 4.06 and 4.48 kg/h of wet feed rate, which produces the producer gas with a calorific value of about 5 MJ/m3.
Liewise, Zainal et al. (2002) performed
experimental study on a downdraft biomass gasifier using wood chips and charcoal with a varied
equivalence ratio from 0.259 to 0.46. It is found that the calorific value increases with equivalence ratio and reaches a peak value of 0.388, for which the calorific value is reported to be 5.62 MJ/Nm3.
Babu & seth (2009) performed experimental study on a downdraft biomass gasifierusing wood waste generated while making furniture in the carpentry
section of the institute’s workshop. Babu & seth (2009) varied theequivalence ratio from 0.1673 to 0.3546.
Table 7 shows the comparison of experimental results corresponding to the optimum equivalence ratio or air-to-fuel ratio for the present work with the work reported by Dogru et al. (2002),Zainal et al. (2002) and Babu & seth (2009) which manifests the highest calorific value of gas is producedin the present study.
Table 7
Comparison with published literature
4
CONCLUSIONS
This paper exhibits the various aspects of biomass gasification with regards to its utility in modern day to day life.
With an increase in the moisture content, biomass consumption rate decreases and with an increase in 0
20 40 60 80 100
0.23 0.24 0.25 0.26 0.27 0.28
Cold Gas Efficiency
Cold Gas Efficiency
Researcher Biomass Optimum ER CV (MJ/Nm3) Gas production
rate (Nm3/kg)
Cold gas
efficiency (%) Dogru et al.
(2002)
Hazelnutshell 0.276 5.15 2.73 80.91
Zainal et al. (2002)
Furniture wood + charcoal
0.388 5.62 1.08 33.72
Babu (2009) Furniture waste
of
Dalbergiasisoo
0.205 6.34 1.62 56.87
the air flow rate biomass consumption rate increases.
Whereas molar fraction of CO2 decrease with an increase in equivalence ratio (ER) till ER = 0.251, and for higher values of ER, they increase. Also, the fraction of CO shows increasing and decreasing trend exactly opposite to that of CO2. Also, the calorific value is maximum at ER = 0.251. However, the calorific value decreases for an equivalence ratio ranging from 0.251 to 0.254.
Also, with an increase in ER, the production rate of producer gas continuously increases.
Regarding the cold gas efficiency, it is at a lowest value of 0.65 for an equivalence ratio of 0.253. The value of cold gas efficiency becomes maximum at equivalence ratio at ER = 0.251. The effect of ER on cold gas efficiency is comparatively lower for higher values of ER.
Thus, the optimum equivalence ratio is 0.251 for a downdraft biomass gasifier which is analysed and simulated in the proposed research paper.
REFERENCES
[1] Sheth, P.N., Babu, B.V., 2009. Differential evolution approach for obtaining kinetic parameters in non isothermal pyrolysis of biomass. Materials and Manufacturing Processes 24, 47–52.
[2] Sheth, P.N., Babu, B.V., 2009.
Experimental studies on producer gas generation from wood waste in a downdraft biomass gasifier. Bioresource technology 100, 3127-3133.
[3] Guo, X.J., Xiao, B., Zhang, X.L., Luo, S.Y., He, M.Y., 2009. Experimental study on air-stream gasification of biomass micron fuel (BMF) in a cyclone gasifier. Bioresource technology 100, 1003-1006. [4] Babu, B.V., Raghuvanshi, S., 2009.
Experimental studies and kinetic modelling for removal of methyl ethyl ketone using bio filtration. Bioresource technology 100, 3855-3861.
[5] Jayah, T.H., Aye, Lu, Fuller, R.J., Stewart, D.F., 2003. Computer simulation of a downdraft wood gasifier for tea drying. Biomass and Bioenergy 25, 459–469. [6] Zainal, Z.A., Ali, R., Quadir, G.,
Seetharamu, K.N., 2002. Experimental investigations of a downdraft biomass gasifier. Biomass and Bioenergy 23, 283– 289.
[7] Dogru, M., Howrath, C.R., Akay, G.,
Keskinler, B., Malik, A.A., 2002.
Gasification of hazelnut shells in a downdraft gasifier. Energy 27, 415–427. [8] Demirbas, A., 2000. Biomass resources for
energy and chemical industry. Energy Education and Science Technology 5, 21– 45.
[9] Twidell, J., 1998. Biomass energy. Renewable Energy World 3, 38–39. [10] Jorapur, R.M., Rajvanshi, A.K., 1997.
Sugarcane leaf-bagasse gasifiers for industrial heating applications.Biomass and Bioenergy 13, 141–146.
[11] Tripathi, A.K., Iyer, P.V.R., Kndpal, T.C.,