Submitted19 November 2014 Accepted 28 December 2014 Published15 January 2015
Corresponding author
Elisabetta Palagi, [email protected]
Academic editor
Jennifer Vonk
Additional Information and Declarations can be found on page 16
DOI10.7717/peerj.729
Copyright
2015 Norscia and Palagi
Distributed under
Creative Commons CC-BY 4.0
OPEN ACCESS
The socio-matrix reloaded: from
hierarchy to dominance profile in wild
lemurs
Ivan Norscia1and Elisabetta Palagi1,2
1Natural History Museum, University of Pisa, Calci, Pisa, Italy
2Institute of Cognitive Sciences and Technologies, Unit of Cognitive Primatology & Primate
Center, CNR, Rome, Italy
ABSTRACT
Dominance hierarchy influences the life quality of social animals, and its definition should in principle be based on the outcome of agonistic interactions. However, defining and comparing the dominance profile of social groups is difficult due to the different dominance measures used and because no one measure explains it all. We applied different analytical methods to winner-loser sociomatrices to determine the dominance profile of five groups of wild lemurs (species:Lemur catta,Propithecus verreauxi, andEulemur rufusxcollaris) from the Berenty forest (Madagascar). They are an excellent study model because they share the same habitat and an apparently similar dominance profile: linear hierarchy and female dominance. Data were col-lected over more than 1200 h of observation. Our approach included four steps: (1) by applying the binary dyadic dominance relationship method (I&SI) on either aggressions or supplant sociomatrices we verified whether hierarchy was aggression or submission based; (2) by calculating normalized David’s scores and measuring steepness from aggression sociomatrices we evaluated whether hierarchy was shal-low or steep; (3) by comparing the ranking orders obtained with methods 1 and 2 we assessed whether hierarchy was consistent or not; and (4) by assessing triangle transitivity and comparing it with the linearity index and the level of group cohesion we determined if hierarchy was more or less cohesive. Our results show thatL. catta groups have got a steep, consistent, highly transitive and cohesive hierarchy.P. ver-reauxigroups are characterized by a moderately steep and consistent hierarchy, with variable levels of triangle transitivity and cohesion.E. rufusxcollarisgroup possesses a shallow and inconsistent hierarchy, with lower (but not lowest) levels of transitivity and cohesion. A multiple analytical approach on winner-loser sociomatrices other than leading to an in-depth description of the dominance profile, allows intergroup and cross-species comparisons.
Subjects Animal Behavior, Anthropology, Zoology
Keywords Lemurs, Sifaka, Steepness, Linearity, Strepsirhines, Prosimians, Madagascar, Social management, Transitivity
INTRODUCTION
reproductive potential (Preuschoft & van Schaik, 2000;Sapolsky, 2005). From a social perspective, dominance rank scaffolds the quality of inter-individual relationships and permeates all behavioral spheres (including aggression, affiliation, parental care, and sexual activity) (Clutton-Brock, Albon & Guinness, 1984;Ogola Onyango et al., 2008; Palagi, Chiarugi & Cordoni, 2008;Norscia, Antonacci & Palagi, 2009). From an ecological perspective, the structure of dominance relationships can influence reproductive success (Pusey, Williams & Goodall, 1997;von Holst et al., 2002), resource access (Clutton-Brock, 1982;Krebs & Davies, 1987), territory quality (Fox, Rose & Myers, 1981), predation risk (Hall & Fedigan, 1997), and energy budgets (Isbell & Young, 1993;Koenig, 2000).
Drews (1993)pointed out that the definitions of dominance could be based on theo-retical constructs or on certain observable behaviors, and focus on different parameters, such as dyads or single individuals, physical properties of subjects or their role, aggressive encounters or the lack of them. Indeed, the definition of dominance has been based on the confrontation of individuals in agonistic interactions (e.g.,Bernstein, 1981;Leiva & de Vries, 2011) and on other correlates, depending on species-specific behavioral repertoire (e.g., direction of approach-retreats, priority of access, special position, and genital display; de Waal & Luttrell, 1985;Cheney, 1977;Kitchen, Cheney & Seyfarth, 2005;Parr et al., 1997; Murray, 2007;Frank, 1986;Hirsch, 2010;Lemel & Wallin, 1993;Alvarez, 1975).
Within social groups, hierarchies can be either linear (A>B>C>D) or non linear (e.g., triangular: A>B and B>C but C>A, pyramidal: A>[B=C=D], or class system based: [A+B]>[C=D+E+F]). Such feature derives from relational properties of networks of dyads rather than from properties of individuals or single dyads (Preuschoft & van Schaik, 2000). In particular, linear hierarchy derives from a set of binary dominance relationships and depends on the number of established relationships and on the degree to which they are transitive (Landau, 1951;Kendall, 1962;Appleby, 1983;de Vries, 1995). The degree of linearity can be measured via the corrected Landau’s index (h′
measure is negatively influenced by the proportion of zero dyads in the matrix. If the zero dyads accurately reflect the absence of clear dominance-subordination relationships among individuals, interpreting lower steepness as an indication of less despotic hierarchy is correct. On the contrary, when these zero dyads are due to observational problems, this interpretation is questionable (de Vries, Stevens & Vervaecke, 2006).
To avoid the problems related to zero dyads,Shizuka & McDonald (2012)andShizuka & McDonald (2014)presented a new measure—based on network structural properties—for determining the level of hierarchy transitivity, less sensitive to observational zeros. This measure, called triangle transitivity(ttri)is based on the transitivity of dominance relations among sets of three individuals that all interact with each other. Triangle transitivity and linearity are essentially equivalent when the dominance relations of all dyads are known but—as discussed above—such conditions are not always met (Shizuka & McDonald, 2012). The method byShizuka & McDonald (2012)follows a logic similar to that ofde Vries (1995), but the procedure is conducted without filling in zero dyads with randomized dominance relations. In fact, filling in zero dyads artificially decreases the level of linearity because it creates cyclic (and not transitive) triads, e.g., A dominates B, B dominates C, and C dominates A (A>B>C>A). According to the framework presented above, it is clear that different aspects of dominance hierarchy can be distinguished that rely on different parameters, thus providing different outcomes. For the first time, we systematically combine different measures into a stepwise approach in order to verify how and whether they add to a more comprehensive definition of the dominance profile of social groups.
As a model for our investigation, we used five wild groups of three sympatric strepsirhine species (Lemur catta,Propithecus verreauxi, andEulemur rufusxcollaris) which share the same habitat and part of their home range in the Berenty forest (south Madagascar) and show similar social system features. In fact, they are characterized by multimale-multifemale group composition, linear hierarchy, and exclusive female dominance over males (Norscia & Palagi, 2011;Palagi & Norscia, 2011;Sclafani et al., 2012; Palagi, Antonacci & Norscia, 2008). Below, we describe the four steps of the methodological procedure applied in this study. For each step, we formulate predictions on lemurs aimed at assessing whether our approach is able to unveil differences in the dominance profile of social groups whose social system seems alike.
Step 1: In primates, either avoidance or aggression have been used to determine the dominance hierarchy (Watts, 1994;Pruetz & Isbell, 2000;Radespiel & Zimmermann, 2001; Cooper & Bernstein, 2008). By running the same test on both avoidance and aggression sociomatrices, based on I&SI rank orders (de Vries, 1998), this step allows one to detect if hierarchy linearity is established also via submission patterns other than via overt aggressions.
subordinate males toward the dominant males often occur simultaneously with submissive signals (Lewis & van Schaik, 2007).Eulemur fulvusseems not to possess formalized subordination signals (Kappeler, 1999;Eulemur fulvussubspecies have been later accorded species status, includingE. rufusandE. collaris;Mittermeier et al., 2008).E. rufusxcollaris in Berenty can have a linear hierarchy based on aggressions (Palagi & Norscia, 2011). In the light of this framework, we expect thatL. cattaandP. verreauxigroups, but not the group ofE. rufusxcollaris, may establish a linear hierarchy also using submissive behaviors (avoidance, in this study) (Prediction 1).
Step 2: By using a cardinal rank measure (based on normalized David’s scores, see methods) and considering the extent of power asymmetry between individuals (Flack & de Waal, 2004;de Vries, Stevens & Vervaecke, 2006), this step allows the evaluation of hierarchy steepness of social groups.
Dominance steepness was qualitatively defined as despotic forL. catta, egalitarian for P. verreauxiand unclear forE. fulvusspp. (Kappeler, 1999). Therefore, the groups ofP. verreauxiandE. rufusxcollarismight show less steep hierarchies compared toL. catta groups (Prediction 2).
Step 3: Although different, linearity and steepness both rely on the outcome of aggressive encounters between group members (de Vries, Netto & Hanegraaf, 1993;de Vries, Stevens & Vervaecke, 2006). By comparing the hierarchy obtained via binary dyadic relationships and via normalized David’s scores (the two analytical tools used for determining linearity and steepness), this step allows one to detect if the hierarchy remains consistent between methods.
We expect to find higher consistency inLemur cattathan in other groups because— based on the information provided at steps 1 and 2—L. cattagroups normally have a strict hierarchy established via submissive signals and aggression (Prediction 3).
Step 4: By comparing triangle transitivity (Shizuka & McDonald, 2012) with the linearity measures, we evaluate the impact that non interacting dyads have on different aspects of dominance hierarchy. By associating this information with the measure of group cohesion around the dominant, we assess whether dominance hierarchy was more or less “cohesive”; that is, more or less influenced by individuals’ spatial dispersal.
L. cattaand P.verreauxiform compact groups, defined as “troops” (Jolly, 1966) and “foraging units” (Richard, 1985), respectively. Instead, inEulemurspp both males and females show low cohesion levels (Kappeler, 1999). Thus, we expect individuals’ dispersal to affect hierarchy transitivity more inEulemur rufusxcollaristhan in the groups of the other study species (Prediction 4).
METHODS
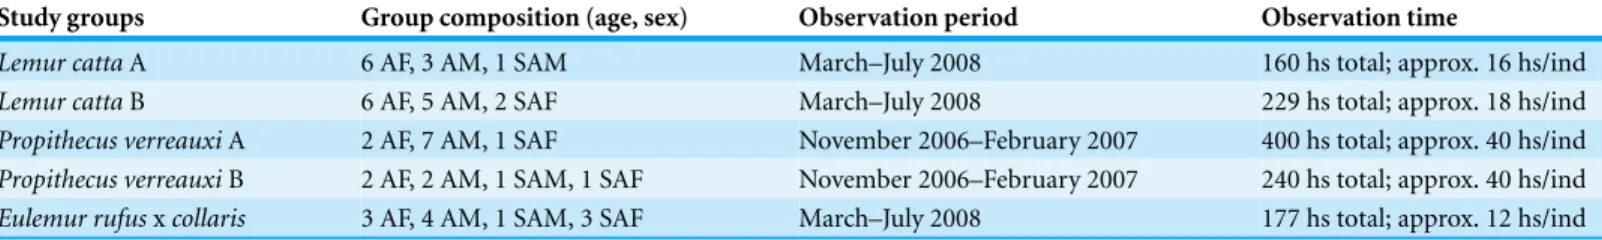
Ethics statementTable 1 Data collection information.Table listing group composition, observation period, and time of focal observations.
Study groups Group composition (age, sex) Observation period Observation time
Lemur cattaA 6 AF, 3 AM, 1 SAM March–July 2008 160 hs total; approx. 16 hs/ind
Lemur cattaB 6 AF, 5 AM, 2 SAF March–July 2008 229 hs total; approx. 18 hs/ind
Propithecus verreauxiA 2 AF, 7 AM, 1 SAF November 2006–February 2007 400 hs total; approx. 40 hs/ind
Propithecus verreauxiB 2 AF, 2 AM, 1 SAM, 1 SAF November 2006–February 2007 240 hs total; approx. 40 hs/ind
Eulemur rufusxcollaris 3 AF, 4 AM, 1 SAM, 3 SAF March–July 2008 177 hs total; approx. 12 hs/ind
Notes.
AF, adult females; AM, adult males; SAF, subadult females; SAM, subadult males.
Study site, groups, and data collection
This study was performed in the Berenty forest (South Madagascar, S 25.00◦
; E 46.30◦ ). The site is characterized by two main climatic periods: a wet season from October to March and a dry season from April to September (Jolly et al., 2006). We observed animals of three sympatric species, and in particular two groups (A and B) ofLemur catta(ring-tailed lemurs), two groups (A and B) ofPropithecus verreauxi(Verreaux’s sifaka), and a single group of introducedEulemur rufusxcollaris(brown lemurs). Group composition is reported inTable 1. In the study we considered both adults and subadults, determined on the basis of scent marking frequency and body size (Kappeler, 1998;Palagi, Gregorace & Borgognini Tarli, 2002;Jolly, 1966).
The physiological seasons (mating, pregnancy, birth and lactating/weaning seasons) influence the frequency of aggressive encounters. InL. catta, for example, aggression levels are highest—and conciliatory tendencies lowest—in the period around mating (Sclafani et al., 2012;Palagi & Norscia, 2014;Jolly, 1966). For this reason, observations were conducted in the period around mating for the three species (Table 1). The study groups shared part of their home range. The animals, habituated to human presence, were sexed and individually identified via facial-body features (Jolly, 1966).
three species (Kaufman & Rosenthal, 2009). For each behavioural category (submissive acts and aggressive events) we provide the kappa range (min–max) for all observer dyads:ksubmissive=0.71–0.75;kaggression=0.79–0.83. Group size and compositions, and observation periods and time are reported inTable 1.
Each day two observers randomly checked for the level of group cohesion (3–4 times a day) by recording the inter-individual spatial distance (more or less than 20 m) between group-members.A posteriori(after determining animals’ rank), we calculated the cohesion level at any given time as the number of individuals within 20 m from the dominant female over the total animal number of group members.
Hierarchy linearity, steepness, triangle transitivity and statistical approach
Hierarchy linearity was determined using Matman 1.0 (10.000 randomizations) by determining value of the Landau’s corrected linearity indexh′(which takes the number of unknown relationships and ties into account) and its statistical significance (de Vries, Netto & Hanegraaf, 1993;de Vries, 1995). When significant linearity was detected, dominance ranks were determined using the I&SI method and re-ordered to minimize inconsistencies and strengths of inconsistencies in dominance relationships (de Vries, 1998). The analysis was conducted on either aggression socio-matrices (based on dyadic decided conflicts) or avoidance socio-matrices.
The steepness was calculated from matrices of decided conflicts via Steepness 2.2 (Leiva & de Vries, 2011) and refers to the absolute slope of the straight line fitted to the normalized David’s scores plotted against the subjects’ ranks (de Vries, Stevens & Vervaecke, 2006). Normalized David’s scores (NDS) were calculated on the basis of a dyadic dominance index (Dij) in which the observed proportion of wins (Pij) is corrected for the chance occurrence of the observed outcome. The chance occurrence of the observed outcome is calculated on the basis of a binomial distribution with each animal having an equal chance of winning or losing in every dominance encounter (de Vries, Stevens & Vervaecke, 2006). The correction is necessary when, as in the case of our study groups, the interaction numbers greatly differ between dyads. We determined the NDS-based hierarchy by ranking the individuals according to their NDSs.
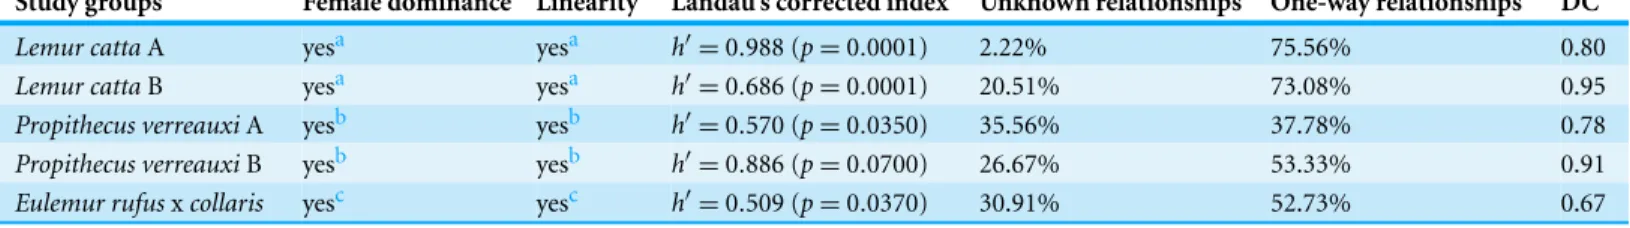
Table 2 Table referring to the presence of linearity and female dominance based on aggression sociomatrices.Landau’s corrected index (h′), level of probability, percentage of unknown and one-way relationships, and Directional Consistency Index (DC) are also reported.
Study groups Female dominance Linearity Landau’s corrected index Unknown relationships One-way relationships DC
Lemur cattaA yesa yesa h′=0.988 (p=0.0001) 2.22% 75.56% 0.80
Lemur cattaB yesa yesa h′=0.686 (p=0.0001) 20.51% 73.08% 0.95
Propithecus verreauxiA yesb yesb h′=0.570 (p=0.0350) 35.56% 37.78% 0.78
Propithecus verreauxiB yesb yesb h′=0.886 (p=0.0700) 26.67% 53.33% 0.91
Eulemur rufusxcollaris yesc yesc h′=0.509 (p=0.0370) 30.91% 52.73% 0.67
Notes.
aSclafani et al., 2012.
bPalagi, Antonacci & Norscia, 2008. cNorscia & Palagi, 2011.
By applying the correlation test via randomization we evaluated the correlation between the two hierarchies obtained via both binary dyadic dominance relationships (I&SI) (de Vries, Netto & Hanegraaf, 1993) and NDS values (Leiva & de Vries, 2011).
We calculated the proportion of transitive triangles relative to all triangles(Pt)and the triangle transitivity metric(ttri)using the codes provided inShizuka & McDonald(2012; supplementary material; errata corrige:Shizuka & McDonald, 2014). The codes to estimate triangle transitivity were applied on aggression sociomatrices using the package ‘statnet’ (Hankcock et al., 2003) in the R programming environment (R Development Core Team, 2011). To this purpose, data were entered in csv files.
RESULTS
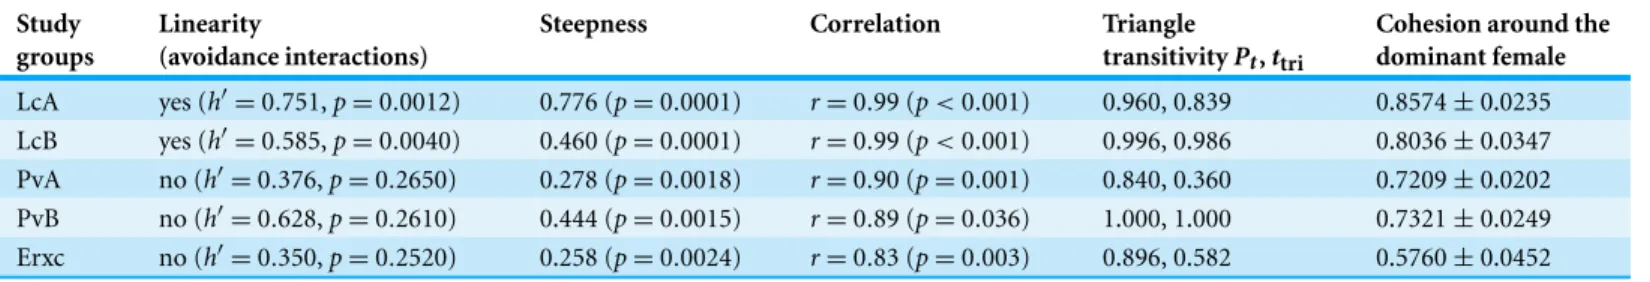
Table 2refers to aggression sociomatrices and shows all of the values related to binary dyadic relationships (I&SI), including Landau’s corrected index (h′), unknown and one-way relationships (%), and the Directional Consistency Index (DC).Table 3shows the other results: linearity derived from avoidance sociomatrices (I&SI method) and outcomes from aggression sociomatrices (steepness, triangle transitivity, and consistency between NDS and I&SI hierarchies).
Avoidance-based matrices did not provide linear hierarchies forPropithecus verreauxi andEulemur rufusxcollarisgroups. In contrast, the hierarchy of bothLemur cattagroups remained linear and showed exclusive female dominance when based on avoidance-based matrices (Table 3). Yet in group A the ranking order in the avoidance based hierarchy was the same observed when the individuals were ordered on the basis of aggression sociomatrices (Table 4) whereas in group B nine individuals out of 13 changed their ranking position in the avoidance based hierarchy (compared to the aggression based hierarchy).
Table 3 Different dominance measures.Summary of values and/or level of probability referring to linearity (presence/absence) based on avoidance interactions (Landau’s corrected index,h′); steepness based on aggression sociomatrices; results of the correlation via randomization (coefficientr
and probability); triangle transitivity based on aggression sociomatrices (Pt: proportion of transitive triangles over the total;ttri: triangle transitivity
metric); and cohesion around the dominant female. Steepness and triangle transitivity values are based on the matrices of aggressive interactions. The correlation via randomization refers to the correlation between hierarchies obtained via I&SI and normalized David’s scores (aggression sociomatrices).
Study groups
Linearity
(avoidance interactions)
Steepness Correlation Triangle
transitivityPt,ttri
Cohesion around the dominant female
LcA yes (h′=0.751,p=0.0012) 0.776 (p=0.0001) r=0.99 (p<0.001) 0.960, 0.839 0.8574±0.0235 LcB yes (h′=0.585,p=0.0040) 0.460 (p=0.0001) r=0.99 (p<0.001) 0.996, 0.986 0.8036±0.0347
PvA no (h′=0.376,p=0.2650) 0.278 (p=0.0018) r=0.90 (p=0.001) 0.840, 0.360 0.7209±0.0202
PvB no (h′=0.628,p=0.2610) 0.444 (p=0.0015) r=0.89 (p=0.036) 1.000, 1.000 0.7321±0.0249 Erxc no (h′=0.350,p=0.2520) 0.258 (p=0.0024) r=0.83 (p=0.003) 0.896, 0.582 0.5760±0.0452
Table 4 Comparison of hierarchical orders assessed according to binary diadic dominance relationships (I&SI) and normalized David’s scores corrected for chance (NDS).Hierarchies of the different lemur groups,Lemur cattaA (LcA) and B (LcB),Propithecus verreauxiA (PvA) and B (PvB), andEulemur rufusxcollaris(E), assessed according to binary diadic dominance relationships (I&SI) and normalized David’s scores corrected for chance (NDS). For all groups, the I&SI and NDS hierarchies deriving from aggression sociomatrices is reported. For the two groups ofL. catta, the hierarchy obtained via I&SI methods from avoidance sociomatrices was linear. It is reported for LcB only, because for LcA the aggression and avoidance based hierarchies coincide. Grey blocks refer to females and white blocks to males. Females ranking under males are all subadult.
LcAI&SI LcANDS LcBI&SI-agg LcBI&SI-av LcBNDS PvAI&SI-agg PvANDS PvBI&SI-agg PvBDS EI&SI-agg ENDS
M M MY MY MY P MT CA BA TS OB
T2 T2 CS CV S MT P BA CA BAPA TS
TV TV S CS CS GR GR BO BRA OB BAPA
MS MS BI S BI TB UA BRA BO PAL PEN
T1 T1 CV BI BV SCR TB BRO BRO PEN PAL
BR BR BV CSV CV UA SCR CL CL CM FF
GR GR 2T BV 2T OT OT MCN CM
BO BALL CSV 2T CSV U S SX ST
BALL BO P PG P N U ST SX
R R PG P PG S N FF MCN
CO CO CO FC FC
N N N
C C C
Figure 1 Normalized David’s scores plotted against rank order. The graph—output of Steepness 2.2—shows normalized David’s scores (corrected for chance, based on aggression sociomatrices) plotted against ordinal rank order (dashed black line), and the fitted line (black, solid line) for all the study groups (Lemur cattaA and B,Propithecus verreauxiA and B,Eulemur rufusxcollaris). TheYaxis reports the Normalized David’s scores and theXaxis reports the individuals of each group.
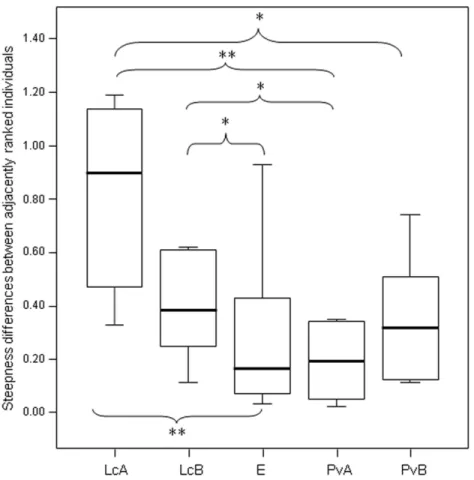
Figure 3 Difference in the group cohesion around the dominant across the five study groups.Box plot showing the comparison of the absolute differences of NDS values between adjacently ranked individuals of each group, across the five study groups (LcA,Lemur cattaA; LcB,Lemur cattaB; PvA,Propithecus verreauxiA; PvB,Propithecus verreauxiB; E,Eulemur rufusxcollaris). Sample size (individuals):nLcA=9, nLcB=11,nPvA=9,nPvB=5,nE=9. Results of the post-hoc randomization tests on two independent samples: PvB versus PvA:t= −0.704,p=0.506; E versus PvB: t=0.642,p=0.545; E versus PvA;
t= −0.068,p=0.943; PvB versus LcB:t=0.160,p=0.281; PvA versus LcB;t=2.150,p=0.046; PvA versus LcA;t=3.479;p=0.005; PvB versus LcA;t=2.225,p=0.044; E versus LcB:t=2.078,
p=0.049; E versus LcA:t=3.462,p=0.003; LcB versus LcA:t=0.846,p=0.413. (*) significant results (p<0.05); (**) highly significant results(p<0.01). Solid horizontal lines indicate medians; length of the boxes corresponds to inter-quartile range; thin horizontal lines indicate the range of observed values.
When—based on aggression sociomatrices—the individuals of each group were ordered according to both I&SI (based on binary dyadic dominance relationships) and their NDS (normalized David’s scores) (Table 4), the two resulting hierarchies correlated in all groups. The coefficient indicates that the group ofE. rufusxcollaris(ErI&SIversus ErNDS: r=0.83,p=0.003) and the twoP. verreauxigroups (PvAI&SIversus PvANDS:r=0.90,p= 0.001; PvBI&SIversus PvBNDS:r=0.89,p=0.036) had lower correlation levels than the twoL. cattagroups (LcAI&SIversus LcANDS:r=0.99,p<0.001; LcBI&SIversus LcBNDS: r=0.99,p<0.001), withE. rufusxcollarisshowing the lowest correlation coefficient.
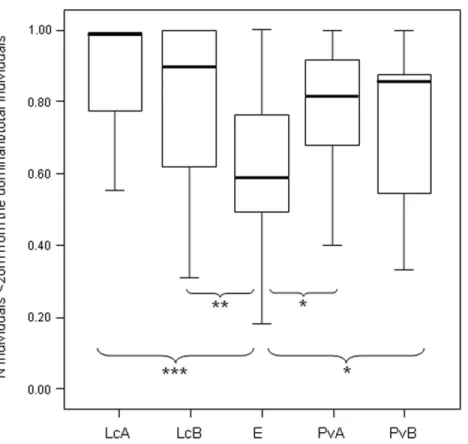
Figure 4 Difference in the group cohesion around the dominant across the five study groups.Box plot showing the difference in group cohesion around the dominant (proportion of individuals within 20 m from the dominant over the total animal number) across the five study groups (LcA,Lemur catta
A; LcB,Lemur cattaB; PvA,Propithecus verreauxiA; PvB,Propithecus verreauxiB; E,Eulemur rufusx
collaris). Observational cohesion bouts for the five groups:nLcA=65,nLcB=40,nPvA=60,nPvB=77, nE=34. Results of the post-hoc randomization tests on two independent samples: PvB versus PvA:
t= −1.656,p=0.101; E versus PvB:t=2.101,p=0.036; E versus PvA;t=2.355,p=0.021; PvB versus LcB:t= −1.800,p=0.080; PvA versus LcB;t= −1.592,p=0.121; PvA versus LcA;t= −1.581;
p=0.118; PvB versus LcA;t= −1.901,p=0.058; E versus LcB:t= −2.995,p=0.004; E versus LcA:
t= −3.840,p<0.001; LcB versus LcA:t= −0.326,p=0.752. (∗) significant results(p<0.05); (∗∗) highly significant results(p<0.01); (∗∗∗) extremely significant results(p<0.001). Solid horizontal lines indicate medians; length of the boxes corresponds to inter-quartile range; thin horizontal lines indicate the range of observed values.
DISCUSSION
As indicated in previous reports, all the groups under study are characterized by linear hierarchy and female dominance determined using aggression sociomatrices (Norscia & Palagi, 2011;Palagi & Norscia, 2011;Sclafani et al., 2012;Palagi, Antonacci & Norscia, 2008). Based on these characteristics only, we would conclude that similar dominance features apply to all groups. The multistep approach proposed here allows the drawing of a more detailed dominance profile of social groups, thus leading to a fine-grained distinction between them.
Aggression- and submission-based hierarchy (step 1, prediction 1)
The first step of our approach allows the detecting of how hierarchy linearity is established (via either overt aggressions or avoidance, or both) in different social groups. We used avoidance, not elicited by any aggressive behavior but indirectly correlated with the outcome of decided agonistic encounters, to verify whether it provides the same dom-inance structure (linearity, female domdom-inance) obtained via aggression sociomatrices. The twoL. cattagroups stand out because they maintained linearity whereas the other groups did not (Tables 2and3; Prediction 1 partly confirmed). Contrary to the prediction,P. verreauxigroups did not have a linear hierarchy based on avoidance probably because the use of avoidance behavior does not reflect the use of formalized submissive chatters and/or because the hierarchical relationships are more relaxed (Kappeler, 1999;Norscia, Antonacci & Palagi, 2009). InL. cattagroups the linearity of avoidance based hierarchy derives from the highest frequency of unidirectional dyadic avoidance behavior inL. cattagroups and it can indicate greater acceptance of the inferior social rank to dominants by subordinates (deference), greater intolerance by dominants to subordinates, or both. We define hierarchy here as aggression-based if it is exclusively unveiled by overt aggressions and submission-based if its detection does not necessarily depend on an arena of aggressive en-counters. According to this definition, linear hierarchy is both aggression- and submission-based inL. cattagroups and aggression-based inP. verreauxiandE. rufusxcollarisgroups.
(Table 4). Even though the same leader and exclusive female dominance were maintained in both aggression and avoidance based hierarchies, many individuals possessed a different position in the two hierarchies (Table 4). Thus, the power discrepancy perceived by individuals (asymmetry derivable from avoidance behavior) does not necessarily go in tandem with the asymmetry established via aggressive interactions.
The difference observed in the ranking order and linearity level is also related to the lower number of avoidance events compared to decided agonistic encounters recorded in the study groups, which is in line with the fact that in the period around mating aggression rates are higher than in other periods in wild lemurs (L. catta:Jolly, 1966;Gould & Ziegler, 2007;P. verreauxi:Brockman, 1998;Brockman et al., 1998;Eulemur rufus:Ostner, Kappeler & Heistermann, 2002).
The twofold approach presented here, which considers both submissive and aggressive interactions, unravels divergences between perceived and aggression based power asymmetry in species that are classically considered as despotic (e.g., baboons,Rowell, 1967; mandrills,Wickings & Dixson, 1992; wolves,Cordoni & Palagi, 2008).
Shallow versus steep hierarchy (step 2, prediction 2)
The second step allows separating social groups according to hierarchy steepness. When steepness is used to evaluate the dominance structure based on aggression sociomatrices, other inter-group differences—not revealed by linearity—emerge. The different groups in-deed differed in their hierarchical steepness (Fig. 1;Fig. 2). The comparison of dyadic NDS values across groups allowed segregating theL. cattagroups from the group ofE. rufusx collaris, with ringtailed lemur groups showing the steepest hierarchy gradient. Conversely, P. verreauxigroups and theE. rufusxcollarisgroup showed similar steepness levels. Prediction 2 is overall supported but it is worth remarking that the differences in steepness levels betweenL. cattaandP. verreauxigroups varied depending on the groups considered (Fig. 3). This situation is in line with the observations ofBalasubramaniam et al. (2012)on different macaque species (ranked from grade 1 to 4 depending on their tolerance levels). The authors observed that steepness measures were more continuous than other measures (e.g., counter-aggression) and did not fully match the species separation into different tolerance grades. Consequently, they noted that different aspects of social style may display somewhat different patterns of variation across species, and that covariation between even closely related measures may be imperfect (Balasubramaniam et al., 2012).
Weakly versus strongly consistent hierarchy (step 3, prediction 3)
As specified above, different ranking positions in the same group can be observed for the same individuals when they are context or behavior dependent (e.g., present study, aggression- versus submissive-based hierarchy inLemur catta;Richard, 1974;Alvarez, 1975; de Waal & Luttrell, 1985). In the case of our study groups, the two different hierarchical arrangements, especially detectable in sifaka and brown lemurs (Table 4), are both generated by the same aggression sociomatrices, through the application of different analyses: I&SI which focuses on the direction of aggression asymmetry; and NDS, which also considers the extent of aggression asymmetry and dyadic encounter probability. It is the quantitative approach itself that reveals two different hierarchy properties.
Less versus more cohesive hierarchy (step 4, prediction 4)
In our case, it is possible to state thatL. cattaandP. verreauxigroups show more cohesive hierarchies thanEulemur rufusxcollaris, meaning that in the two former species a higher proportion of group members is found close to the dominant females (within 20 m) at any given time. However, the level of relationship transitivity is higher inEulemur rufusxcollaristhan in one group ofP. verreauxi(Table 3). We could interpret this very last result (Eulemur rufusxcollarisnot showing the lowest transitivity values of all) as a result biased by the presence of non-interacting diads. In fact, if patterns of non-interactions are not random because some dyads do not actually interact, the formation of transitive versus cyclic triangles can be skewed (Shizuka & McDonald, 2012). Instead, we speculate that the comparison between triangle transitivity and linearity provides the hierarchy assessment with an added value because it suggests that in the core group ofEulemur rufusxcollaris (composed by individuals that actually interact with each other) relationships are more transitive than it appears by considering linearity alone. The observation of the different cohesion levels helps in explaining this difference by reinforcing the idea that hierarchy is less cohesive in the brown lemur group because the presence of non interacting dyads (informed by the weak group cohesion around the dominant) does not affect transitivity (non interacting dyads excluded) as much as it affects linearity (non interactive dyads included).
CONCLUSIONS
We applied a four-step approach on a large database gathered, with the same observation protocol, on five wild multimale-multifemale lemur groups. The groups shared the same habitat, and part of the home range, and they were all characterized by linear hierarchy and female dominance (Norscia & Palagi, 2011;Palagi & Norscia, 2011;Sclafani et al., 2012;Palagi, Antonacci & Norscia, 2008). This information alone would lead to conclude that their dominance profile is alike. We used different measures (linearity, steepness, consistency, triangle transitivity and group cohesion) to determine whether group hierarchy was (i) aggression or submission based; (ii) shallow or steep; (iii) weakly or strongly consistent; and (iv) more or less cohesive.
In conclusion, the use of the same method (I&SI) applied to different behavioral databases (aggression/avoidance), and different methods (normalised David’s scores, binary dyadic dominance relationships, triangle transitivity) applied to the same behavioral database (aggression sociomatrices), resulted in different dominance outlines relative to the same study subjects. The use of different methodological approaches is important because each single measure has its own limits: for example, linearity does not appreciate the different extent of power asymmetry between individuals, steepness can suffer from the presence of zero dyads, triangles of individuals may not be fully independent because each triangle within a social network can share nodes (individuals) and ties (connections) with other triangles (Flack & de Waal, 2004;de Vries, Stevens & Vervaecke, 2006;Wasserman & Katherine, 1994). Finally, a multiple analytical approach can lead to a more in-depth description of dominance profile, which is a multilevel concept combining many aspects of social dominance.
ACKNOWLEDGEMENTS
We thank Alison Jolly for leading us to Berenty, M De Heaulme and his family for the possibility to conduct our investigation in the Berenty Reserve. We express our gratitude to the directors of the Italian parks Paolo Cavicchio (Giardino Zoologico di Pistoia), Iole Palanca (Parco Zoo Falconara), and Maria Rodeano (Parco Zoo Punta Verde, Lignano Sabbiadoro) for their support. We are also grateful to Daniela Antonacci, Chandra Brondi, Stefania Dall’Olio and Valentina Sclafani for field assistance and to Paolo Rosa-Clot for helping with the triangle transitivity tool. Finally, we wish to thank David Leiva and Hans de Vries for providing Steepness 2.2 and useful suggestions and Nera Malvasia for helping with result discussion.
ADDITIONAL INFORMATION AND DECLARATIONS
Funding
Giardino Zoologico di Pistoia, Parco Zoo Falconara, and Parco Zoo Punta Verde (Italy) reimbursed travel and accommodation fees for field data collection. The funders had no role in study design, data collection and analysis, decision to publish, or preparation of the manuscript.
Grant Disclosures
The following grant information was disclosed by the authors: Giardino Zoologico di Pistoia.
Parco Zoo Falconara. Parco Zoo Punta Verde.
Competing Interests
Author Contributions
• Ivan Norscia and Elisabetta Palagi conceived and designed the experiments, performed
the experiments, analyzed the data, contributed reagents/materials/analysis tools, wrote the paper, prepared figures and/or tables, reviewed drafts of the paper.
Animal Ethics
The following information was supplied relating to ethical approvals (i.e., approving body and any reference numbers):
Because the study was purely observational, the Animal Care and Use board (University of Pisa) waives the need for a permit. The study was conducted with no manipulation of animals. The study was carried out in the private Berenty Reserve (South Madagascar). The owners Mr De Heaulme (and family) permitted us to conduct the observational study.
Supplemental Information
Supplemental information for this article can be found online athttp://dx.doi.org/ 10.7717/peerj.729#supplemental-information.
REFERENCES
Altmann J. 1974.Observational study of behaviour sampling methods.Behaviour49:227–265
DOI 10.1163/156853974X00534.
Alvarez F. 1975.Social hierarchy under different criteria in groups of squirrel monkeys,Saimiri sciureus.Primates16:437–455DOI 10.1007/BF02382741.
Appleby MC. 1983.The probability of linearity in hierarchies.Animal Behaviour31:600–608
DOI 10.1016/S0003-3472(83)80084-0.
Balasubramaniam KN, Dittmar K, Berman CM, Butovskaya M, Cooper MA, Majolo B,
Ogawa H, Schino G, Thierry B, de Waal FBM. 2012. Hierarchical steepness,
counter-aggression, and macaque social style scale.American Journal of Primatology74:915–925
DOI 10.1002/ajp.22044.
Bernstein IS. 1981.Dominance: the baby and the bathwater.Behavioral and Brain Sciences
4:419–457DOI 10.1017/S0140525X00009614.
Brockman DK. 1998.Reproductive behavior of femalePropithecus verreauxiat beza mahafaly,
Madagascar.International Journal of Primatology20:375–398DOI 10.1023/A:1020500804442.
Brockman DK, Whitten PL, Richard AF, Schneider A. 1998.Reproduction in free-ranging male
Propithecus verreauxi: the hormonal correlates of mating and aggression.American Journal of Physical Anthropology105:137–151
DOI 10.1002/(SICI)1096-8644(199802)105:2<137::AID-AJPA3>3.0.CO;2-S.
Cheney DL. 1977. The acquisition of rank and the development of reciprocal alliances
in freeranging immature baboons. Behavioral Ecology and Sociobiology 2:303–318
DOI 10.1007/BF00299742.
Clutton-Brock TH. 1982.Red deer. Behaviour and ecology of two sexes. Edinburgh: Edinburgh University Press.
Clutton-Brock TH, Albon SD, Guinness FE. 1984.Maternal dominance, breeding success and
birth sex ratios in red deer.Nature308:358–360DOI 10.1038/308358a0.
Cooper MA, Bernstein IS. 2008.Evaluating dominance styles in assamese and rhesus macaques.
Cordoni G, Palagi E. 2008.Reconciliation in wolves (Canis lupus): new evidence for a comparative perspective.Ethology114:298–308DOI 10.1111/j.1439-0310.2008.01474.x.
de Vries H. 1995.An improved test of linearity in dominance hierarchies containing unknown or
tied relationships.Animal Behaviour50:1375–1389DOI 10.1016/0003-3472(95)80053-0.
de Vries H. 1998.Finding a dominance order most consistent with a linear hierarchy: a new
procedure and review.Animal Behaviour55:827–843DOI 10.1006/anbe.1997.0708.
de Vries H, Netto WJ, Hanegraaf PLH. 1993. MatMan: a program for the analysis of
sociometric matrices and behavioural transition matrices.Behaviour 125:157–175
DOI 10.1163/156853993X00218.
de Vries H, Stevens JMG, Vervaecke H. 2006.Measuring and testing steepness of dominance
hierarchies.Animal Behaviour71:585–592DOI 10.1016/j.anbehav.2005.05.015.
de Waal FBM. 1982.Chimpanzee politics: power and sex among apes. New York: Harper and Row.
de Waal FBM. 1986.The integration of dominance and social bonding in primates.The Quarterly
Review of Biology61:459–479DOI 10.1086/415144.
de Waal FBM, Luttrell LM. 1985. The formal hierarchy of rhesus macaques (Macaca
mulatta): an investigation of bared-teeth display.American Journal Primatology 9:73–86
DOI 10.1002/ajp.1350090202.
Donati G, Baldi N, Morelli V, Ganzhorn JU, Borgognini-Tarli SM. 2009. Proximate and
ultimate determinants of cathemeral activity in brown lemurs.Animal Behaviour77:317–325
DOI 10.1016/j.anbehav.2008.09.033.
Drews C. 1993.The concept and definition of dominance in animal behaviour.Behaviour
125:283–313DOI 10.1163/156853993X00290.
Flack J, de Waal FBM. 2004.Dominance style, social power, and conflict. In: Thierry B, Singh M, Kaumanns W, eds.Macaque societies: a model for the study of social organization. Cambridge: Cambridge University Press, 157–185.
Fox SF, Rose E, Myers R. 1981.Dominance and the acquisition of superior home ranges in the
lizardUta stansburiana.Ecology62:888–893DOI 10.2307/1936985.
Frank LG. 1986.Social organization of the spotted hyaenaCrocuta crocuta. II. Dominance and reproduction.Animal Behaviour34:1510–1527DOI 10.1016/S0003-3472(86)80221-4.
Gould L, Ziegler TE. 2007.Variation in fecal testosterone levels, inter-male aggression, dominance rank and age during mating and post-mating periods in wild adult male ring-tailed lemurs (Lemur catta).American Journal of Primatology69:1325–1339DOI 10.1002/ajp.20438.
Hall CL, Fedigan LM. 1997.Spatial benefits afforded by high rank in white-faced capuchins.
Animal Behaviour53:1069–1082DOI 10.1006/anbe.1996.0392.
Hankcock M, Hunter D, Butts C, Goodreau S, Morris M. 2003.Statnet: software tools for the
statistical modelling of network data.Available athttp://statnetproject.org.
Hemelrijk CK, Wantia J, Isler K. 2008. Female dominance over males in primates:
self-organisation and sexual dimorphism.PLoS ONE3(7):e2678
DOI 10.1371/journal.pone.0002678.
Hewitt SE, Macdonald DW, Dugdale HL. 2009.Context-dependent linear dominance
hierarchies in social groups of European badgers,Meles meles.Animal Behaviour77:161–169
DOI 10.1016/j.anbehav.2008.09.022.
Hirsch BT. 2010.Within-group spatial position in ring-tailed coatis: balancing predation, feeding competition, and social competition.Behavioral Ecology and Sociobiology65:391–399
von Holst D, Hutzelmeyer H, Kaetzke P, Khachei M, Rodel HG, Schrutka H. 2002.Social rank, fecundity and lifetime reproductive success in wild European rabbits (Oryctolagus cuniculus).
Behavioral Ecology and Sociobiology51:245–254DOI 10.1007/s00265-001-0427-1.
Isbell LA, Young TP. 1993.Social and ecological influences on activity budgets of vervet monkeys, and their implications for group living.Behavioral Ecology and Sociobiology32:377–385
DOI 10.1007/BF00168821.
Jolly A. 1966.Lemur behavior: a Madagascar field study. Chicago: University of Chicago Press.
Jolly A, Caless S, Cavigelli S, Gould L, Pereira ME, Pitts A, Pride RE, Rabenandrasana HD,
Walker JD, Zafison T. 2000.Infant killing, wounding, and predation inEulemurandLemur.
International Journal of Primatology23:327–353DOI 10.1023/A:1013835612314.
Jolly A, Koyama N, Rasamimanana H, Crowley H, Williams G. 2006.Berenty Reserve: a research
site in southern Madagascar. In: Jolly A, Sussman RW, Koyama N, Rasamimanana H, eds.
Ringtailed lemur biology: Lemur catta in Madagascar. New York: Springer, 32–42.
Kappeler PM. 1999.Lemur social structure and convergence in primate socioecology. In: Lee PC,
ed.Comparative primate socioecology. Cambridge: Cambridge University Press, 273–299.
Kappeler PM. 1998.To whom it may concern: the transmission and function of chemical signals
inLemur catta.Behavioral Ecology and Sociobiology42:411–421DOI 10.1007/s002650050455.
Kaufman AB, Rosenthal R. 2009.Can you believe my eyes? The importance of inter-observer
reliability statistics in observations of animal behaviour.Animal Behaviour78:1487–1491
DOI 10.1016/j.anbehav.2009.09.014.
Kendall M. 1962.Rank correlation methods. London: Griffin.
Kitchen DM, Cheney DL, Seyfarth RM. 2005.Contextual factor mediating contests between male
chacma baboons in Botswana: effects of food, friends, and females.International Journal of
Primatology26:105–125DOI 10.1007/s10764-005-0725-y.
Klass K, Cords M. 2011.Effect of unknown relationships on linearity, steepness and rank ordering of dominance hierarchies: simulation studies based on data from wild monkeys.Behavioural Processes88:168–176DOI 10.1016/j.beproc.2011.09.003.
Koenig A. 2000.Competitive regimes in forest-dwelling Hanuman langur females (Semnopithecus
entellus).Behavioral Ecology and Sociobiology48:93–109DOI 10.1007/s002650000198.
Koyama N, Nakamichi M, Oda R, Ichino S, Miyamoto N, Takahata Y. 2001.A ten year summary
of reproductive parameters for ring-tailed lemurs at Berenty, Madagascar.Primates42:1–14
DOI 10.1007/BF02640684.
Krebs JR, Davies NB. 1987.An introduction to behavioural ecology. Boston: Blackwell.
Landau HG. 1951.On dominance relations and the structure of animal societies: I. Effect of inherent characteristics.Bulletin of Mathematical Biophysics13:1–19DOI 10.1007/BF02478336.
Leiva D, de Vries H. 2011.Steepness: testing steepeness of dominance hierarchies. R package version 0.2.Available athttp://CRAN.R-project.org/package=steepness.
Lemel J, Wallin K. 1993.Status signaling, motivational condition and dominance: an experimental study in the great tit,Parus major.Animal Behaviour45:549–558DOI 10.1006/anbe.1993.1065.
Lewis RJ. 2002.Beyond dominance: the importance of leverage.The Quarterly Review of Biology
77:149–164DOI 10.1086/343899.
Manly BFJ. 1997.Randomization, bootstrap and Montecarlo methods in biology. London: Chapman
and Hall.
Martin P, Bateson P. 1986.Measuring behaviour: an introductory guide. Cambridge: Cambridge University Press.
Mittermeier RA, Ganzhorn JU, Konstant WR, Glander K, Tattersall I, Groves CP, Rylands AB, Hapke A, Ratsimbazafy J, Mayor MI, Louis Jr EE, Rumpler Y, Schwitzer C, Rasoloarison RM. 2008.Lemur diversity in Madagascar.International Journal of Primatology29:1607–1656
DOI 10.1007/s10764-008-9317-y.
Murray CM. 2007.Method for assigning categorical rank in femalePan troglodytes schweinfurthii
via the frequency of approaches. International Journal of Primatology 28:853–864
DOI 10.1007/s10764-007-9164-2.
Norscia I, Palagi E. 2011.Do brown lemurs reconcile? Not always.Journal of Ethology29:181–185
DOI 10.1007/s10164-010-0228-y.
Norscia I, Antonacci D, Palagi E. 2009.Mating first, mating more: biological market fluctuation in a wild prosimian.PLoS ONE4:e4679DOI 10.1371/journal.pone.0004679.
Ogola Onyango P, Gesquiere LR, Wango EO, Alberts SC, Altmann J. 2008. Persistence
of maternal effects in baboons: mother’s dominance rank at son’s conception predicts stress hormone levels in subadult males.Hormones and Behavior 54:319–324
DOI 10.1016/j.yhbeh.2008.03.002.
Ostner J, Kappeler PM, Heistermann M. 2002.Seasonal variation and social correlates of
androgen excretion in male redfronted lemurs (Eulemur fulvus rufus).Behavioral Ecology and
Sociobiology52:485–495DOI 10.1007/s00265-002-0532-9.
Palagi E, Norscia I. 2011. Scratching around stress: hierarchy and reconciliation make the difference in wild brown lemurs (Eulemur fulvus). Stress 14:93–97
DOI 10.3109/10253890.2010.505272.
Palagi E, Norscia I. 2014.The season for peace: reconciliation in a despotic species (Lemur catta).
PeerJ PrePrints2:e568v1DOI 10.7287/peerj.preprints.568v1.
Palagi E, Antonacci D, Norscia I. 2008. Peacemaking on treetops: first evidence of
reconciliation from a wild prosimian (Propithecus verreauxi).Animal Behaviour76:737–747
DOI 10.1016/j.anbehav.2008.04.016.
Palagi E, Chiarugi E, Cordoni G. 2008.Peaceful Post-conflict interactions between aggressors and bystanders in captive lowland gorillas (Gorilla gorilla gorilla).American Journal of Primatology 70:949–955DOI 10.1002/ajp.20587.
Palagi E, Gregorace A, Borgognini Tarli SM. 2002.Development of olfactory behavior in
captive ring-tailed lemurs (Lemur catta).International Journal of Primatology23:587–599
DOI 10.1023/A:1014973717945.
Paoli T, Palagi E. 2008.What does agonistic dominance imply in bonobos? In: Takeshi F,
Thompson J, eds.Bonobos: behaviour, ecology, and conservation. New York: Springer-Verlag, 35–54.
Parr LA, Matheson M, Bernstein IS, de Waal FBM. 1997.Grooming down the hierarchy:
allogrooming in captive brown capuchin monkeys,Cebus apella.Animal Behaviour54:361–367
DOI 10.1006/anbe.1996.0419.
Pereira ME. 2006.Obsession with agonistic power. In: Jolly A, Sussman RW, Koyama N,
Rasamimanana H, eds.Ringtailed lemur biology: Lemur catta in Madagascar. New York: Springer, 245–270.
Pereira ME, Kappeler PM. 1997.Divergent systems of agonistic behaviour in lemurid primates.
Pinkus S, Smith JNM, Jolly A. 2006.Feeding competition between introducedEulemur fulvusand nativeLemur cattaduring the birth season at Berenty Reserve, Southern Madagascar. In: Jolly A, Sussman RW, Koyama N, Rasamimanana H, eds.Ringtailed lemur biology. New York: Springer, 119–140.
Preuschoft S, Van Schaik CP. 2000.Dominance and communication: conflict management in
various social settings. In: Aureli F, de Waal FBM, eds.Natural conflict resolution. Berkeley: University of California Press, 77–105.
Pruetz JD, Isbell LA. 2000. Correlations of food distribution and patch size with
agonistic interactions in female vervets (Chlorocebus aethiops) and patas monkeys (Erythrocebus patas) living in simple habitats.Behavioral Ecology and Sociobiology49:38–47
DOI 10.1007/s002650000272.
Pusey A, Williams J, Goodall J. 1997.The influence of dominance rank on the reproductive
success of female chimpanzees.Science277:828–831DOI 10.1126/science.277.5327.828.
R Development Core Team. 2011.R: a language and environment for statistical computing. Vienna: the R Foundation for Statistical Computing.Available athttp://www.R-project.org/.
Radespiel U, Zimmermann E. 2001.Female dominance in captive gray mouse lemurs (Microcebus
murinus).American Journal of Primatology54:81–192DOI 10.1002/ajp.1029.
Richard AF. 1974.Intra-specific variation in the social organization and ecology ofPropithecus verreauxi.Folia Primatologica22:178–207DOI 10.1159/000155624.
Richard AF. 1985.Social boundaries in a Malagasy Prosimian, the Sifaka (Propithecus verreauxi).
International Journal of Primatology6:553–568DOI 10.1007/BF02692288.
Rowell TE. 1967.A quantitative comparison of the behaviour of a wild and a caged baboon troop.
Animal Behaviour15:499–509DOI 10.1016/0003-3472(67)90050-4.
Sapolsky RM. 2005.The influence of social hierarchy on primate health.Science308:648–652
DOI 10.1126/science.1106477.
Sclafani V, Norscia I, Antonacci D, Palagi E. 2012.Scratching around mating: factors affecting anxiety in wildLemur catta.Primates53:247–254DOI 10.1007/s10329-012-0294-6.
Shizuka D, McDonald DB. 2012.A social network perspective on measurements of dominance
hierarchies.Animal Behaviour83:925–934DOI 10.1016/j.anbehav.2012.01.011.
Shizuka D, McDonald DB. 2014.Errata corrige to Shizuka D & McDonald DB (Animal Behaviour,
83, 925-934).Animal Behaviour87:243DOI 10.1016/j.anbehav.2013.10.016.
Simmen B, Hladik A, Ramasiarisoa P. 2003.Food intake and dietary overlap in nativeLemur catta
andPropithecus verreauxiand introducedEulemur fulvusat Berenty, Southern Madagascar.
International Journal of Primatology24:949–968DOI 10.1023/A:1026366309980.
Tanaka M. 2007.Habitat use and social structure of a brown lemur hybrid population
in the Berenty Reserve, Madagascar. American Journal of Primatology 69:1189–1194
DOI 10.1002/ajp.20416.
Wasserman S, Katherine F. 1994.Social network analysis in the social and behavioral sciences. In:Social network analysis: methods and applications. Cambridge: Cambridge University Press.
Watts DP. 1994.Agonistic relationships between female mountain gorillas (Gorilla gorilla beringei).Behavioral Ecology and Sociobiology34:347–358DOI 10.1007/BF01209781.
Wickings EJ, Dixson AF. 1992. Testicular function, secondary sexual development, and
social status in male mandrills (Mandrillus sphinx).Physiology and Behavior52:909–916
DOI 10.1016/0031-9384(92)90370-H.