© FECAP
DOI: 10.7819/rbgn.v16i52.1411
Subject Area: Organizational Strategy And Behavior
RBGN
Complementarity between Internal R&D and R&D Cooperation in the
Context of Spanish Technological Opportunities
Complementaridade entre a P&D Interna e a Cooperação em P&D no Contexto das
Oportunidades Tecnológicas Espanholas
Complementariedad entre la I+D interna y la cooperación en I+D en el contexto de
las oportunidades tecnológicas españolas
Manuel Guisado González1
Manuel Guisado Tato2
Carlos Ferro Soto3
Received on August 7, 2012 / Approved on November 18, 2014 Responsible editor: João Maurício Gama Boaventura, Dr. Evaluation process: Double Blind Review
1. Doctor in Economic and Business Sciences from University of Vigo – Spain. [[email protected]] 2. University Professor, University of Vigo – Spain. [[email protected]]
3. Full Professor of University of Vigo – Spain. [[email protected]]
Authors’ address: University of Extremadura. Unit: School of Business Studies and Tourism. Department: Financial Economics and Accounting
Avenida de la Universidad S/N, 10003 – Cáceres – Extremadura – Spain ABSTRACT
In this paper, we analyse the existence of complementarity between the internal R&D activities and the R&D cooperative agreements of Spanish innovative manufacturing irms. his analysis is conducted concerning to the context of technological opportunities (industrial and non-industrial) and companies’ protection mechanisms (legal and strategic). he database used is the Community Innovation Survey referring to the Spanish economy. he discussion about the results is performed once the coeicients have been obtained by the Heckman correction method. he results indicate evidence of substitutability between internal R&D and R&D cooperation,
and non-industrial technological opportunities and strategic protection mechanisms have no inluence on innovation output. In addition, we found that non-industrial technological opportunities increase the probability of innovation in companies, although they have no inluence on their innovative performance. In contrast, industrial technological opportunities do not contribute to increasing the likelihood of innovation, but inluence their innovative performance.
RESUMO
Neste artigo analisamos a existência de complementaridade entre o desenvolvimento interno de P&D e os acordos de cooperação em P&D das empresas industriais inovadoras. A análise é feita no contexto das oportunidades tecnológicas espanholas (industriais e não industriais) e dos mecanismos de proteção (legais e estratégicos). O banco de dados utilizado é o Community Innovation Survey, baseada na economia espanhola, ea técnica de regressão empregada é a correção de Heckman em dois estágios. Os resultados mostram que há evidências de substituibilidade entre a P&D interna e os acordos de cooperação em P&D e que as oportunidades tecnológicas não-industriais e os mecanismos estratégicos de proteção não mostram nenhuma inluência estatística sobre o desempenho inovador das empresas. Nós também achamos que as oportunidades tecnológicas não industriais aumentam a probabilidade de inovar das empresas. Por outro lado, as oportunidades tecnológicas industriais não têm efeito sobre a probabilidade de inovar das empresas, mas elas mostram inluência sobre o desempenho inovador.
Palavras-chave: Complementaridade. P&D interna. Cooperação em P&D. Oportunidades tecnológicas. Condições de apropriabilidade.
RESUMEN
En este trabajo analizamos la existencia de complementariedad entre el desarrollo interno de I+D y los acuerdos de cooperación en I+D de las empresas manufactureras innovadoras. El análisis es realizado en el contexto de las oportunidades tecnológicas españolas (industriales y no industriales) y de los mecanismos de protección (legales y estratégicos). La base de datos utilizada es la Community Innovation Survey, referida a la economía española, y la técnica de regresión empleada ha sido la Corrección de Heckman en dos etapas. Los resultados señalan que existen evidencias de sustituibilidad entre la I+D interna y los acuerdos de cooperación en I+D y que las oportunidades tecnológicas no industriales y los mecanismos de protección
estratégicos no ejercen influencia estadística sobre el desempeño innovador de las empresas. Asimismo, encontramos que las oportunidades tecnológicas no industriales incrementan la probabilidad de innovar de las empresas. Por el contrario, las oportunidades tecnológicas industriales no inluyen sobre la probabilidad de innovar de las empresas, pero sí lo hacen sobre su desempeño innovador.
Palabras clave: Complementariedad. I+D interna. Cooperación en I+D. Oportunidades tecnológicas. Condiciones de apropiabilidad.
1 INTRODUCTION
Nowadays, very few companies rely solely on internal investigation to build their competitive advantages. hus, within the 6094 manufacturing irms that make up the Spanish sample of the Community Innovation Survey of 2000 (CIS 2000), only 230 companies (3.8%) use internal R&D as a single innovation strategy. Typically, companies use diferent combinations of innovation strategies. Such combinations are a clear indication of the coexistence of diferent innovation strategies within companies, and possibly evidence of complementarity between some of these strategies. hat is, it seems logical to infer that if companies develop more than one innovation strategy simultaneously; this must mean that some kind of beneit is expected to be obtained from such combination (ROSENKOPF; ALMEIDA, 2003; BELDERBOS; CARREE; LOKSHIN, 2006).
external R&D) can result in a superior impact on the irms’ innovative performance compared with what would be achieved by the development of two separate innovation strategies (CASSIMAN; VEUGELERS, 2006). This superior impact constitutes what Milgrom and Roberts (1990) conceptualized as complementarity. his has been deined as the marginal performance increase in one of the innovation strategies, assessed by a production function, when another strategy is used more intensively.
The resources and capabilities theory also emphasize the importance of combining heterogeneous resources in a unique way as the key to building competitive advantages (WERNERFELT, 1984; BARNEY, 1991; PETERAF, 1993). For this purpose, the aforementioned theory suggests that companies, on one hand, must identify the strategic resources possessed, that is, the resources that act as a differentiator against competitors and allow companies to build one or more solid and durable competitive advantages (BARNEY, 1991; AMIT; SCHOEMAKER, 1993), while, on the other hand, they must identify gaps in more signiicant resources that place them at disadvantage in relation to their rivals. Having identified these shortcomings, the company should try to incorporate the complementary resources needed, either by generating them internally or by acquiring them using the market.
However, there are situations in which neither of the two identified alternatives is feasible for the company. When this happens, many companies turn to the implementation of cooperation agreements to obtain these complementary resources (MARKIDES; WILLIAMSON, 1996; PARK; MEZIAS; SONG, 2004). Further, as Teece (1986) noted the diversity of technological resources and capabilities that irms need to compete successfully have been very high for 20 years, and it is growing. his fact makes it diicult or even impossible for a single company to remain up to date and possess the necessary technology by itself. hus, cooperation agreements are very efective when the objective is to acquire tacit knowledge from other companies
(HENNART, 1988; JORDE; TEECE, 1990; INKPEN, 1998), since it expands the knowledge base of the company (VASUDEVA; ANAND, 2011) and, consequently, complements the knowledge generated internally. Companies use cooperative agreements as a means to complement the resources that they already have, in order to build competitive advantages. In this regard, a significant number of these cooperative arrangements take place in the R&D ield. his is because here many core competencies of the irms reside (TEECE, 1992) and here their respective learning skills increase and become stronger (LANE; LUBATKIN, 1998; ROSENKOPF; ALMEIDA, 2003).
In line with the above, this article explores, in the Spanish manufacturing context, the complementarity between the internal R&D strategy (do) and the cooperative R&D strategy (cooperation with other companies and institutions). In that sense, this article contributes to the analysis of the do–cooperate relationship in R&D from four important perspectives: irst, to explore whether there is complementarity between the two innovation strategies identiied; second, to carry out such exploration in the context of the technological opportunities available to companies, distinguishing between industrial and non-industrial technological opportunities; third, to explore the inluence of the legal and strategic protection mechanisms on the likelihood of innovation and on innovation performance; and four, to test whether the variables that inluence the innovation likelihood exhibit similar levels of agreement to the results generated by the innovation (innovative performance).
2 T H E I N T E R A C T I O N B E T W E E N INTERNAL R&D AND COOPERATIVE R&D
The absorption capacity approach indicates that internal R&D not only inluences the innovative performance of irms positively, but also increases their capabilities to recognize the value of new external knowledge (TRIGERO; CÓRCOLES, 2013) and to facilitate its assimilation and helps them to ind one or more business purposes. herefore, from this viewpoint, internal R&D and cooperation agreements do not necessarily have to be substitutive strategies, but both contribute to the development of better communication networks between internal and external knowledge, which will lead to increased innovation output (LIN; HSIAO; LIN, 2013).
herefore, it is obvious that the absorptive capacity approach conceives internal R&D as the cornerstone on which the other innovation strategies designed and implemented by companies rest. Thus, in the field of R&D cooperative agreements, strong internal R&D helps to strengthen the learning capacity that any cooperation agreement entails, helping to identify the most suitable partners (ARORA; GAMBARDELLA, 1994). Also, as Bougrain and Haudeville (2002) noted, strong and complex internal R&D improves the communication and coordination among partners, thus contributing to the successful development of cooperation agreements. On the other hand, the existence of strong and valuable internal knowledge makes the company attractive to potential cooperation partners, encouraging the use of R&D cooperative agreements (COLOMBO; GRILLI; PIVA, 2006). From the above it is inferred that the internal generation of knowledge and the establishment of R&D cooperative agreements are not substitutes but can coexist or even be complementarities. This will be so to the extent that through these agreements assets and knowledge that complement and that can lead to bidirectional lows could be shared.
In general, the literature on innovation strategies suggests that internal R&D forms the backbone of the irm’s absorptive capacity (CASSIMAN; VEUGELERS, 2006). From the above, we deduce the complementarity between internal R&D and cooperative agreements, because the absorption capacity available will increase the marginal return from such agreements, and vice versa. In this regard, Bougrain and Vaudeville (2002) noted that absorptive capacity improves communication and coordination between irms that establish cooperation agreements, while Lucena (2009) stressed that as the success of partnerships depends on the possession of a large learning capacity, the prior possession of a strong absorption capacity is needed. hus, several authors point out the greater potential for complementarity between internal R&D and R&D cooperation activities than between internal R&D and R&D outsourcing activities (SCHMIEDEBERD, 2008; LUCENA, 2009). In this sense, we must take into account that the possession of a strong absorption capacity depends on the previous level of knowledge possessed (KIM, 2001), and such a knowledge comes mainly from the irm’s internal R&D activities (SCHOENMAKERS; DUYSTERS, 2006).
Likewise, the existence of potential complementarities between internal R&D and R&D cooperation has been considered by several authors (MIRAVETE; PERNÍAS, 2006; CHAVAS et al., 2012). his efect stems from economies of scope in R&D due to the knowledge spillovers generated, because the combination of the two R&D activities generates strong complementarities in knowledge creation.
Moreover, the resources and capabilities approach emphasizes the possible existence of complementarities derived from the diferent natures of the assets that are provided with some cooperation agreements, to the extent that one partner brings assets of a productive nature and the other, assets of a commercial nature (TEECE, 1986; ROTHAERMEL; HILL, 2005).
regarding complementarity have contributed to the development of an important stream of empirical literature. Their common goal was to clarify the complementary interaction that can occur between the internal R&D and the acquisition of new knowledge generated outside the walls of the company (CASSIMAN; VEUGELERS, 2006).
In the specific area of cooperation agreements, Arora and Gambardella (1994) found that among U.S. pharmaceutical companies there is a signiicant and positive correlation between internal R&D and R&D cooperation agreements. Colombo (1995) indicated identical situation among U.S. irms in the information technology sector. In relation to other countries, several studies have contrasted similar results (CASSIMAN; VEUGELERS, 2002; BONTE; KEILBACH, 2005; LOPEZ, 2008). On the other hand, Becker and Peters (2000) found that cooperation agreements with universities have a positive and signiicant inluence on internal R&D, as well as the existence of complementarity between these agreements and the generation of patents in R&D, while Love and Roper (2001) contrasted the existence of complementarity between the cooperation strategies and internal knowledge development in industry in the UK and Ireland. Recently, Abramovsky et al. (2009) tested the existence of a positive inluence of internal R&D on the likelihood of establishing R&D cooperation agreements in the industrial context of four European countries. Finally, note that although the studies recognizing the complementarity between R&D cooperation and internal R&D at present are the ones that predominate (SERRANO-BEDIA; LÓPEZ-FERNÁNDEZ; GARCÍA-PIQUERES, 2012; SCHMIEDEBERG, 2008); also, recent empirical studies have found a substitutive relationship between these two types of innovation (JIRJAHM; KRAFT, 2011).
In this work, we are interested in testing whether there is a positive interaction between internal R&D and R&D cooperative agreements among Spanish innovative manufacturing irms.
Such complementarity will be evaluated through the impact of interaction results on the turnover percentage in 2000, from the market introduction of new or significantly improved products during the period 1998–2000. Besides the two innovation strategies there are other factors that influence firms’ innovative performance and should be properly considered.
hus, from the perspective of industrial economics, it is often noted that the innovative performance of irms depends on a number of characteristics that somehow deine the structure of the industry in which they compete. In this research, we consider the irms’ size, available technological opportunities (GEROSKI, 1990), and so-called appropriability conditions (LEVIN et al., 1987).
We use size as a control variable and do not advance any hypotheses about its inluence on the irm’s innovative performance. In this sense, the results are ambiguous in numerous studies (COHEN; KLEPPER, 1996; COHEN, 2010). Some studies have found the existence of a positive efect (BELDERBOS; CARREE; LOKSHIN, 2004); others, however, have found that this relationship is negative (CZARNITZKI; KRAFT, 2004).
between the absorptive capacity of technological opportunities and the R&D intensity (BECKER; PETERS, 2000; NIETO; QUEVEDO, 2005). Other researchers have sought to test the inluence of technological opportunities on innovation capacity (HARABI, 1995; KLEVORICK et al., 1995). However, few studies have addressed the impact analysis of technological opportunities on a measure of irms’ innovative performance (BECKER; PETERS, 2000; VEGA-JURADO et al., 2008). We proceed from the assumption that a greater number of technological opportunities should positively impact on the likelihood of irms’ innovation and on their corresponding innovative performance. Therefore, besides being interested in testing the inluence of the technological opportunities available on the irms’ innovative propensity, we are also interested in exploring how these opportunities affect the innovative activity results. Thus, we shall be able to contrast whether there is concordance between opportunity, innovation and results. In order to enable a more precise analysis of the concordance outlined, this study distinguishes between industrial technological opportunities and those with no industrial source.
Howe ve r, t h e m e re e x i s t e n c e o f technological environments with ample opportunities is not suicient to guarantee that companies will seize such opportunities properly. It depends on the so-called appropriability conditions, i.e. that irms have efective legal (COHEN, 1995) and/or strategic (TEECE, 1986; BRUSONI; PRENCIPE; PAVITT, 2001) mechanisms that prevent or hinder other irms from taking ownership of the technical knowledge generated or incorporated into the processes, products or services ofered. If it is possible to construct such protection mechanisms eiciently, companies can take risks in their internal knowledge generation and undertake investments and acquisitions in the science and technology fields (VEUGELERS; CASSIMAN, 1999; CASSIMAN; VEUGELERS, 2006). In general, the literature on innovation has worked with the hypothesis that appropriability conditions have
a signiicant positive inluence on innovative activity. In this work, we also believe that the legal and strategic protection has a positive and signiicant inluence on the probability of innovation and on the results of innovation.
Finally, note that according to the tradition in the literature, we assume that belonging to an enterprise group and the R&D intensity exhibit a positive and significant influence on the likelihood of innovation and the corresponding performance (BELDERBOS et al., 2006), while we assume that diferent measures of barriers to innovation (market, internal, and other obstacles) have a signiicant negative inluence (MOHNEN; RÖLLER, 2005).
3 DESCRIPTION OF THE EMPIRICAL
STUDY
3.1 Data
he data used in this study come from the Third Community Innovation Survey (CIS3), carried out in Spain by the Instituto Nacional de Estadística (INE, 2000) under the name Encuesta de Innovación Tecnológica en las Empresas, according to the guidelines of Eurostat and the Oslo Manual1 (OECD and
determined by the size of the enterprise and its principal activity. At least all enterprises with 10 or more employees in any of the speciied sectors were included in the statistical population. he statistical unit is the enterprise. An enterprise is deined as the smallest combination of legal units
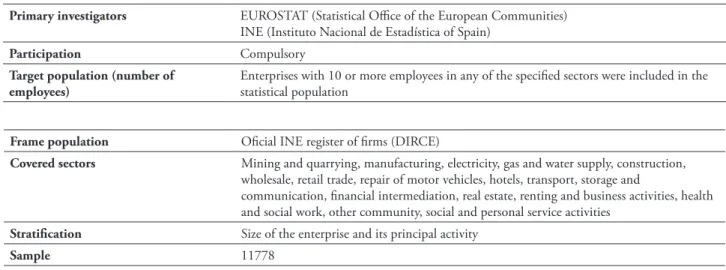
that is an organizational unit producing goods or services. he surveys were based on mail. he Community Innovation Surveys are carried out every four years in European Union countries to investigate a irrm’s innovation activities. Table 1 summarizes the main features of CIS3 for Spain.
TABLE 1 – Main characteristics of CIS3 for Spain
Primary investigators EUROSTAT (Statistical Oice of the European Communities) INE (Instituto Nacional de Estadística of Spain)
Participation Compulsory
Target population (number of employees)
Enterprises with 10 or more employees in any of the speciied sectors were included in the statistical population
Frame population Oicial INE register of irms (DIRCE)
Covered sectors Mining and quarrying, manufacturing, electricity, gas and water supply, construction, wholesale, retail trade, repair of motor vehicles, hotels, transport, storage and
communication, inancial intermediation, real estate, renting and business activities, health and social work, other community, social and personal service activities
Stratiication Size of the enterprise and its principal activity
Sample 11778
Source: he author
Out of the total of 11,778 companies that make up the sample, we have selected 2 samples of them. he irst is the screening sample of 6094 companies, composed entirely of manufacturing companies. he second is the main sample of 2601 companies, comprised of manufacturing companies that claim to engage in product and/ or process innovation.
3.2 Variables
Because we work with two regression models in our analysis, we use two dependent variables. In the main model, to measure the irm’s innovative performance, we use the percentage of the company’s total turnover in 2000, which represents the contribution of new or signiicantly upgraded products or services introduced by the company in the market during the period 1998– 2000 (% SALESNEWP). In the selection model, we use INNOVPP as the dependent variable. If the company did not carry out innovation activities during the period 1998–2000, the
dependent variable takes the value zero; if the irm undertook product and/or process innovation activities2, it takes the value one.
Innovation strategies are reflected by means of dichotomous values (0.1), distinguishing between IRD, when, during the analysis period, the company conducted internal R&D activities systematically, and DRC, when, during this period, it established R&D cooperation agreements with other companies and institutions.
cooperated and this cooperation has been of paramount importance (BECKER; DIETZ, 2004). From such data, the average value of these four scores is determined for each company. his average value is a gauge of the technological opportunities of industrial origin (ITO). To determine the indicator of non-industrial origin (NITO), we operate, as we previously did, using the consulting irms (IMCOOP5), commercial laboratories and R&D companies (IMCOOP6), universities and higher education institutions (IMCOOP7), and public research institutions and technology centres (IMCOOP8) as reference.
In connection with the appropriability conditions, we distinguish between legal protection mechanisms and strategic protection mechanisms. By legal mechanisms we refer to patents (LMP1), registered utility models (LMP2), trademarks (LMP3), and copyright (LMP4). Each of these elements is rated on a scale from one to four, where one indicates that the mechanism has not been used and four relects that it has been used and has been given the utmost importance. he average value of these four mechanisms is the indicator of legal protection mechanisms that the company has used (LMP). he above mechanisms are also known as written mechanisms of protection, to the extent that their constancy is duly recorded. However, further increasing the competitive advantages of companies comes from complex knowledge, the constancy and legal defence of which cannot materialize in writing. hese are the so-called strategic mechanisms of protection. In this study we use the so-called trade secrecy (SMP1), design complexity (SMP2), and lead time over competitors (SMP3). Each of these elements is scored in the same way as legal protection mechanisms, and the average scores for each company constitute the indicator of strategic protection mechanisms (SMP).
he irm size (SIZE) is measured on a scale from one to four: one comprises all the companies that had a turnover in 2000 exceeding the top quartile of sales for the manufacturing sector to which the company belongs; two indicates
that the turnover is greater than the irst quartile and less than or equal to the median of the sales of the corresponding manufacturing sector; three shows that the turnover is higher than the median and less than or equal to the third quartile of sales of the relevant manufacturing sector; inally, four corresponds to companies with a turnover exceeding the third quartile of sales of the manufacturing sector to which the company belongs.
In the selection model, besides using most of the previously deined variables, we use ive new variables. First, through the dichotomous variable GROUP, we diferentiate whether the irm in question belongs to an enterprise group (one) or not (zero). Furthermore, we use an indicator of the irm’s technological intensity (TECIN), because we work on the database without suicient information to calculate the true value of this variable. he technological intensity is deined as the total expenditure on innovation normalized by the corresponding turnover. In our case, an indicator close to TECIN is accomplished by setting a relationship between the innovation expenditure (INNOVRANK) and the irm’s volume of sales related to the branch of economic activity to which it belongs (SIZE). INNOVRANK is a ranking of the total innovation expenditures incurred by the company in 2000. he scale and the measurement philosophy of this variable are identical to those used for the variable size, but in this case, the quartiles and median refer to the costs of innovation for the industry concerned. Obviously, as there are companies that do not perform any innovation expenditure, the scale ranges from zero (no innovation expenditure) to four (indicating that the company in question is in the category of those that make the greatest innovation expenditure in their industry). herefore, the TECIN variable will have a potential scale from zero to four.
the name of economic factors (ECOFACT). Organizational rigidities, the lack of qualiied personnel, lack of technological information, and lack of market information are grouped under the name of internal factors (INTERFACT). Finally, the excessive rigidity of rules and regulations and the lack of consumer sensibilities about new products and services are labelled other factors (OTHERFACT). The measurement scale of all these factors ranges from one to four, where one means that the factor is not relevant to the innovativeness of the company and four indicates
that the company has had very important diiculties in developing this innovative capacity attributable to such a factor. he values taken by the variables ECOFACT, INTERFACT, and OTHERFACT correspond to the average value of the relevant factors within them.
A detailed synthesis of all the variables employed in our model can be found in Appendix A.
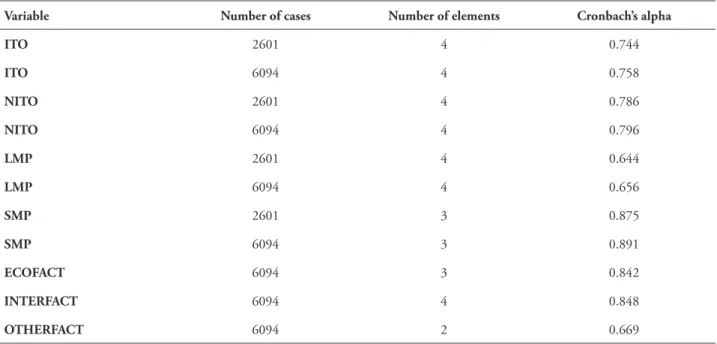
In order to assess the reliability of the scale used, Table 2 shows the Cronbach’s alphas of all the variables, which are the result of the grouping of diferent factors (McDONALD, 1999).
TABLE 2 – Cronbach’s alpha for composite variables
Variable Number of cases Number of elements Cronbach’s alpha
ITO 2601 4 0.744
ITO 6094 4 0.758
NITO 2601 4 0.786
NITO 6094 4 0.796
LMP 2601 4 0.644
LMP 6094 4 0.656
SMP 2601 3 0.875
SMP 6094 3 0.891
ECOFACT 6094 3 0.842
INTERFACT 6094 4 0.848
OTHERFACT 6094 2 0.669
Source: he author
3.3 Econometric speciications and estimation techniques
In order to control the additive and multiplicative effects generated by the joint
consideration of innovative strategies (internal development and cooperation) on the basic variable of the analysis (IRD), we estimate three models:
%SALESNEWP=β +β IRD+β ITO+β NITO+β LMP+β SMP+β SIZE Modelo( )
0 1 2 3 4 5 6 1
%SALESNEWP=
β
+β
IRD+β
RDC+β
ITO+β
NITO+β
LMP+β
SMP+β
SIZE Modelo( )0 1 2 3 4 5 6 7 2
%SALESNEWP=β +βIRD+β RDC+β IRD RDC* +β ITO+β NITO+β LMP+β SMP+β SIZE Modelo( )
With the above three models we perform two diferent estimation techniques, using the sample of 2601 observations from innovative manufacturing irms. he irst uses an ordinary least squares regression (OLS), because the dependent variable is continuing in nature (WOOLDRIDGE, 2009). However, disregarding the impact of non-innovative companies may cause problems of selection bias. To alleviate this possible contingency, we
conduct a second estimate on each of the three models using the Heckman correction method in two stages (WOOLDRIDGE, 2009). In the irst stage, a probity estimation is performed on all the manufacturing irms (6094) in order to calculate the inverse Mills ratio (λ) and then the corresponding correction of the coeicients of models 1, 2, and 3 is made. he model selection is as follows:
INNOVPP GROUP TECIN ECOFACT INTERFACT OTHERFACT ITO NITO LMP SMP SIZE
= + + + + +
+ + + + +
β β β β β β
β β β β β
0 1 2 3 4 5
6 7 8 9 10
With the data obtained from the estimation of the selection model coeicients, the intended correction is not only performed, but it also allows us to compare the simultaneous concurrence of the interest variables in regard to the likelihood of innovation and its performance.
According to the literature (LEIPONEN, 2005; CASSIMAN; VEUGELERS, 2006; VEGA-JURADO et al., 2008), the approval of the existence of complementarity between internal R&D and R&D cooperation activities is performed through the interaction term (IRD*DRC), the coefficient of which has to be significantly larger than zero. If the coeicient of the interaction term is signiicant and negative, it is interpreted as a sign of
substitutability between the two innovation activities (SCHMIEDEBERG, 2008).
4 RESULTS AND DISCUSSION
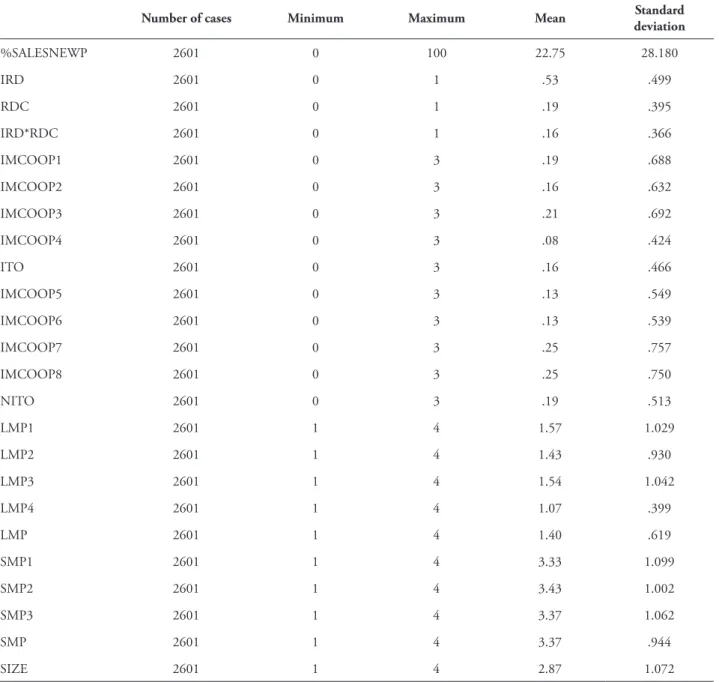
TABLE 3 – Descriptive statistics
Number of cases Minimum Maximum Mean Standard
deviation
%SALESNEWP 2601 0 100 22.75 28.180
IRD 2601 0 1 .53 .499
RDC 2601 0 1 .19 .395
IRD*RDC 2601 0 1 .16 .366
IMCOOP1 2601 0 3 .19 .688
IMCOOP2 2601 0 3 .16 .632
IMCOOP3 2601 0 3 .21 .692
IMCOOP4 2601 0 3 .08 .424
ITO 2601 0 3 .16 .466
IMCOOP5 2601 0 3 .13 .549
IMCOOP6 2601 0 3 .13 .539
IMCOOP7 2601 0 3 .25 .757
IMCOOP8 2601 0 3 .25 .750
NITO 2601 0 3 .19 .513
LMP1 2601 1 4 1.57 1.029
LMP2 2601 1 4 1.43 .930
LMP3 2601 1 4 1.54 1.042
LMP4 2601 1 4 1.07 .399
LMP 2601 1 4 1.40 .619
SMP1 2601 1 4 3.33 1.099
SMP2 2601 1 4 3.43 1.002
SMP3 2601 1 4 3.37 1.062
SMP 2601 1 4 3.37 .944
SIZE 2601 1 4 2.87 1.072
Source: he author
From the reading of the descriptive statistics, it is inferred that the average percentage of the total turnover in 2000 is 22.75%. his igure represents the contribution of new products and services, or signiicant improvements introduced by enterprises in 1998–2000. Also, 53% of 2601 manufacturing companies developed internal R&D systematically, and these companies implemented cooperative strategies that account for 19%. In turn, it follows that most companies
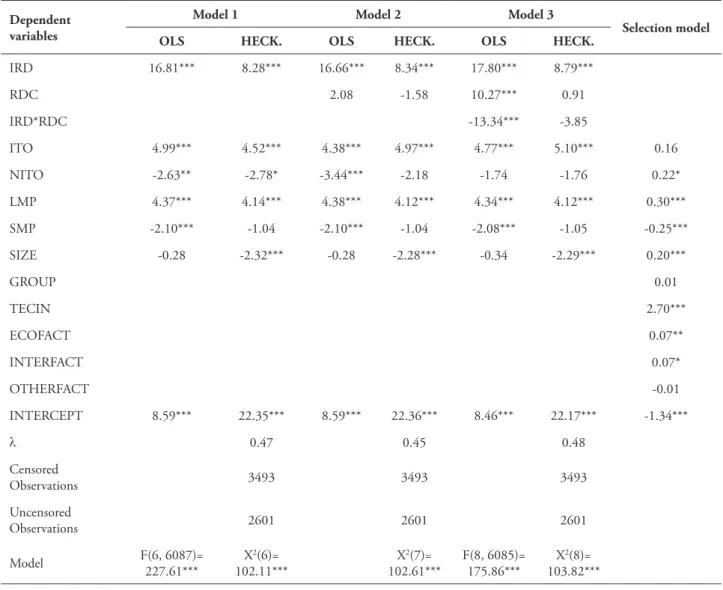
TABLE 4 – Regressions ordinary least squares, heckman correction, and selection model
Dependent variables
Model 1 Model 2 Model 3
Selection model
OLS HECK. OLS HECK. OLS HECK.
IRD 16.81*** 8.28*** 16.66*** 8.34*** 17.80*** 8.79***
RDC 2.08 -1.58 10.27*** 0.91
IRD*RDC -13.34*** -3.85
ITO 4.99*** 4.52*** 4.38*** 4.97*** 4.77*** 5.10*** 0.16
NITO -2.63** -2.78* -3.44*** -2.18 -1.74 -1.76 0.22*
LMP 4.37*** 4.14*** 4.38*** 4.12*** 4.34*** 4.12*** 0.30***
SMP -2.10*** -1.04 -2.10*** -1.04 -2.08*** -1.05 -0.25***
SIZE -0.28 -2.32*** -0.28 -2.28*** -0.34 -2.29*** 0.20***
GROUP 0.01
TECIN 2.70***
ECOFACT 0.07**
INTERFACT 0.07*
OTHERFACT -0.01
INTERCEPT 8.59*** 22.35*** 8.59*** 22.36*** 8.46*** 22.17*** -1.34***
λ 0.47 0.45 0.48
Censored
Observations 3493 3493 3493
Uncensored
Observations 2601 2601 2601
Model F(6, 6087)= 227.61*** 102.11***X2(6)= 102.61***X2(7)= F(8, 6085)=175.86*** 103.82***X2(8)=
Source: he author
Statistical signiicance of the coeicients at 1% ***, 5% **, and 10% *.
If we compare the two econometric estimation methods used (OLS and Heckman correction), the irst thing to note is that the amount of the coeicients in the two methods is not comparable, although the sign and the significance of the estimated coefficients are comparable. Thus, comparing the results of the full model (model 3), we found that both estimation methods lead to identical signs of inluence of the independent variables on the dependent variable. However, they are not the same in relation to the coeicient signiicance, because the strategic protection mechanisms (SMP) go from being fully signiicant in the OLS estimate to being not signiicant in the
the last estimation procedure (WOOLDRIDGE, 2009).
he results from model 1 show the efect of internal R&D and industry characteristics (technological opportunities, appropriability conditions, and size) on innovation output when the R&D cooperation and its interaction with internal R&D (IRD*RDC) are not taken into account. he results indicate that internal R&D has a strong and signiicant impact on innovation output.
Regarding the technological opportunities, the results indicate that the technological opportunities from industry have a positive and signiicant inluence, corroborating the hypothesis that we raised. However, the technological opportunities from non-industrial sources have a negative and statistically significant weak inluence, contradicting the hypothesis previously made. According to these results, we can infer that Spanish manufacturing innovative companies increase their innovative performance through the use of the technological opportunities of their competitors, suppliers, customers, and companies in the same group. However, their relationship with universities, consulting irms, and public research organizations is counterproductive to the improvement of their innovative performance.
Regarding the appropriability conditions, the results are also contradictory. The legal mechanisms of protection have the expected influence, i.e. the existence of effective and encoded protection methods allows companies to protect their technological knowledge, and, therefore, they influence product innovation positively and significantly. However, the strategic mechanisms of protection do not have a signiicant inluence.
One import point emerges from the above. Although the Spanish manufacturing irms give greater emphasis to strategic protection mechanisms (computed as an average of 3.37 points) than to legal protection mechanisms (computed as an average of 1.40 points), the legal mechanisms are those that have a positive and statistically significant influence. This contradiction may stem from the production
model prevalent in Spanish industry. Such a production model mostly uses small companies with less complex traditional technology, mainly belonging to areas of low and medium technological intensity, and therefore they have no need to defend their competitive advantages through the deployment of complex protection strategies (trading secrets, design complexity, and lead time over competitors). he signiicance and sign of the coeicient of size variable further reinforce this interpretation, because they indicate that the smaller companies are those that have a greater impact on innovation output, which contradicts that stream of literature which claims that large companies will have better innovative performance because of their internal inancial capacity or their easier access to external inancing (CONTE; VIVARELLI, 2014). Besides, we have already mentioned that the technological opportunities of non-industrial origin (mainly from the scientiic world) have a negative impact on innovation output, an issue that contributes to reinforcing the idea that the majority of the Spanish productive sector consists of small and medium enterprises, is supported by traditional technology, dependent on the technological opportunities of industrial origin, and uses encrypted protection mechanisms.
When we incorporate the R&D cooperation variable (alone) into model 1 (model 2), we ind that all the variables of model 1 maintain their sign and significance level, except the technological opportunities of non-industrial sources, which although they still maintain their negative sign, cease to be signiicant, reinforcing the earlier comments. We also ind that the R&D cooperation is not statistically signiicant.
Model 3 also includes the joint implementation of internal R&D and R&D cooperation (IRD*RDC). As the corresponding coeicient is not statistically signiicant, we can say that there is no complementarity between internal R&D and R&D cooperation activities.3
same as those in model 2, except for the variable DRC (cooperation) that changes sign.
Finally, we compare the behaviour of the coeicients of the common variables of the selection model (probability of innovation) and the Heckman correction model (innovation output). hus, we ind that although the technological opportunities of industrial origin (model 3) afect the innovation output signiicantly, they do not inluence the probability of innovation (selection model). By contrast, technological opportunities from non-industrial sources increase the probability of innovation signiicantly but they do not have a signiicant inluence on the innovation output. We ind, then, the discordant inluence that technological opportunities have: non-industrial technological opportunities (NITO) are important for companies that are beginning to innovate, but then they have no influence over the results of innovation. On the other hand, industrial technological opportunities (ITO) are not the driving force that pushes companies to innovate, but are critical to achieving good innovation outcomes.
Something similar happens with the company size; large companies are the most innovative (selection model), but the smaller ones are those that achieve the best performances (Heckman correction model). his result is similar to those of many previous works (Cohen, 2010). On the other hand, legal protection mechanisms have a positive and significant inluence on both the probability of innovation and the corresponding performance, while strategic protection mechanisms have a negative and signiicant inluence on the probability to innovate and have no signiicant inluence on the innovation output.
5 CONCLUSIONS
In this study, we have found that the internal R&D is the innovation strategy that has the greatest explanatory weight in innovation
output, when it is measured by the sales share of new products in relation to the total turnover. By contrast, R&D cooperation (alone) is insigniicant, and internal R&D and R&D cooperation are not complementary activities, because the interaction term (IRD*RDC) is not positive nor signiicant. Although this result is in line with other previous studies (BECKER; PETERS, 2000; CASSIMAN; VEUGELERS, 2002; SCHMIEDEBERG, 2008), some qualiications should be presented about the Spanish case.
In general, in recent times, the innovation promotion policies in different Spanish administrations have tended to provide public subsidies for innovation projects carried out in cooperation with other companies or public agencies (GUISADO – TATO; VILA- ALONSO; GUISADO - GONZÁLEZ, 2010). Companies competing alone are less likely to obtain grants. The results of our study allow us to shed some doubts on the implementation of these kinds of policies. his is because in order to obtain satisfactory results from the cooperation agreements powerful and complex internal R&D is required; it would not be possible to absorb properly the size of the wealth of knowledge that the other partners provide.
Moreover, the absence of complementarity also makes us think that a large majority of Spanish manufacturing firms use internal R&D as a basic lever for their technological development and rely on R&D cooperation agreements in a speciic manner, i.e. only in those cases that they deem necessary to obtain the technological competences that the company does not have. hat is, it is possible that Spanish irms do not seek cooperation agreements to absorb knowledge, but to solve speciic problems, hence the complementarity and the evidence of substitutability between technology strategies revealed by the study results.
herefore, it is likely that the public policies that promote R&D cooperation agreements to strengthen the innovation capacity of Spanish companies do not produce the desired results. Primarily, firms should be encouraged to strengthen their internal R&D capabilities. When the irms have complex internal technological capabilities, they will be able to exploit the full potential offered by R&D cooperation agreements, and therefore they will not only be used to solve their speciic research problems. Consequently, the indiscriminate promotion of cooperation agreements between firms to strengthen their internal innovative capacity is neither efective nor eicient. In the area of many Spanish manufacturing irms, the sequence of public actions should be reversed, i.e. supporting the strengthening and complexiication of internal R&D. This is the only way to increase the cooperation agreements and thus achieving wider dissemination of technology on the production network.
From the above arguments, an obvious policy implication follows: before establishing a programme of public support for innovation, the level of skills and internal competencies for R&D that the companies from diferent manufacturing sectors have must be carefully analysed. In the sectors in which these abilities are high, policies can be promoted to support the establishment of R&D cooperation agreements. In other sectors, the promotion should be based on the development of capabilities in R&D. In our view,
before the implementation of a comprehensive policy of public support for innovation activities, it is necessary to carry out a redeinition of the ields of action of the public policy in order to meet the technology development needs of Spanish companies4.
All of the above considerations also found strong support in the fact that the strategic protection mechanisms do not have a signiicant inluence on the innovative performance of irms. However, the legal mechanisms of protection inluence this performance. his behaviour is indication that the technological development of Spanish companies is based on traditional technologies, defensible through coding systems. By contrast, complex technological developments, the defence of which does not depend so much on coding systems but on strategic methods, are not relevant. However, many traditional technologies are accessible through the market, without the need for a strong internal R&D department. Nevertheless, for the development of complex technologies, the irm must have a strong and sophisticated internal R&D department. Therefore, from the non-significance of the coeicient of strategic protection mechanisms, it is not unreasonable to infer that, in general, Spanish companies have no strong and complex internal R&D departments.
Concerning to size, we ind that smaller companies attain the best innovative performances, precisely the firms that resort to the use of traditional technology.
NOTES
1. he Oslo Manual 1997 is a guide for collecting and interpreting technological innovation data. It is edited jointly by OECD and Eurostat. As a guide, deines concepts and clariies the activities that are part of the innovation process and the types of innovation and the impact of these innovations on irm perform.
2. We ruled out the consideration of innovative activities in progress and frustrated activities, because both, by definition, have no impact on the variable % SALESNEWP.
3. his result regarding the complementarity coincides with that obtained by Schmiedeberg (2008) for the German manufacturing industry when she used as the innovation output the sales of new products (as we do in this study).
4. In Spain, and generally throughout the European Union, is usual to grant public aid for innovation under the conditionality of establish cooperation agreements with other companies. However, apply this policy to all kinds of businesses seems incorrect. In Spain, a large portion of the companies belong to sectors of medium and low technological intensity. These companies do not have a suiciently well developed R&D department. herefore, such companies are not able to absorb the knowledge, skills and routines that the more advanced companies achieve through the implementation of cooperation agreements with other companies. For this kind of companies the innovation aid should not be conditional on the establishment of cooperative agreements (GUISADO-GONZÁLEZ; GUISADO-TATO; FERRO-SOTO, 2013).
REFERENCES
ABRAMOVSKY, L. et al. Understanding co-operative innovative activity: evidence from four European countries. Economics of Innovation and New Technology, [S. l.], v. 18, n. 3, p. 243-265, 2009.
AMIT, R.; SCHOEMAKER, P. J. Strategic assets and organizational rent. Strategic Management Journal, Chichester, v. 14, n. 1, p. 33-46, Jan. 1993.
ARORA, A.; GAMBARDELLA, A. Evaluating technological information and utilizing it. Scientiic knowledge, technological capability, and external linkages in biotechnology. Journal of Economic Behavior and Organization, Amsterdam, v. 24, n. 1, p. 91–114, June 1994.
BARNEY, J.B. Firm resources and sustained competitive advantage. Journal of Management, housand Oaks, v. 17, n. 1, p. 99-120, 1991.
BECKER,W.; DIETZ, J. R&D cooperation and innovation activities of irms-evidence for the German industry. Research Policy, [S. l.], v. 33, n. 2, p. 209–223, Mar. 2004.
_ _ _ _ _ _ ; P E T E R S , J . Te c h n o l o g i c a l opportunities, absorptive capacities, and innovation. May 2000. Working Paper Series of the Department of Economics. University of Augsburg. Augsburg. n. 195.
BELDERBOS, R.; CARREE, M.; LOKSHIN, B. Cooperative R&D and irm performance. Research Policy, [S. l.] v. 33, n. 10, p. 1477-1492, Dec. 2004.
______; ______; ______. Complementarity in R&D cooperation strategies. Review of Industrial Organization, Dordrecht, v. 28, n. 4, p. 401–426, June 2006
BÖNTE, W.; KEILBACH, M. Concubinage or marriage? Informal and formal cooperations for innovation. International Journal of Industrial Organization, Amsterdam, v. 23, n. 3-4, p. 279 – 302, 2005.
BOUGRAIN, F.; HAUDEVILLE, B. Innovation, collaboration and SMEs’ internal research capacities. Research Policy, [S. l.], v. 31, n. 5, p. 735–747, July 2002.
BRUSONI, S.; PRENCIPE, A.; PAVITT, K. Knowledge specialization and the boundaries of the irm: why do irms know more than they make? Administrative Science Quarterly, Ithaca, v. 46, n. 4, p. 597–621, Dec. 2001.
CASSIMAN, B.; VEUGELERS, R. R&D cooperation and spillovers: some empirical evidence from Belgium. American Economic Review, Nashville, v. 92, n. 4, p. 1169–1184, Sep. 2002.
knowledge acquisition. Management Science, Linthicum, v. 52, n. 1, p. 68–82, Jan. 2006.
CHAVAS, J. P. et al. Analysis and decomposition of scope economies: R&D at U.S. research universities. Applied Economics, London, v. 44, n. 11, p. 1387-1404, 2012.
COHEN, W. M. Empirical studies of innovative activity. In: STONEMAN, P. (Ed.). Handbook of the economics of innovation and technological change. Oxford: Blackwell, 1995, p. 182–264.
______. Fifty years of empirical studies of innovative activity and performance. In: HALL, B. H.; ROSENBERG, N. (Eds.). Hand book of the economics of innovation. North-Holland: Elsevier, 2010. v. 1.
______; KLEPPER, S. A reprise of size and R&D. he Economic Journal, [S. l.], v. 106, n. 437 p. 925–951, July 1996.
______; LEVINTHAL, D. Innovation and learning: the two faces of R&D. he Economic Journal, [S. l.],v. 99, n. 397, p. 569–596, Sept.
1989.
______; ______. Absorptive capacity: a new perspective on learning and innovation. Administrative Science Quarterly, Ithaca, v. 35,
n. 1, p. 128-152, Mar. 1990.
COLOMBO, M. G. Firm size and cooperation: the determinants of cooperative agreements in information technology industries. International Journal of the Economics of Business, London, v. 2, n. 1, p. 3–29, 1995.
______; GRILLI, L.; PIVA, E. In search of complementary assets: the determinants of alliance formation of high-tech start-ups. Research Policy, [S. l.], v. 35, n. 8, p. 1166–1199, Oct. 2006.
CONTE, A.; VIVARELLI, M. Succeeding in innovation: key insights on product and process innovations drawn from company data. Empirical Economics, Heidelberg, v. 47, n. 4, p. 1317-1340, Dec. 2014.
C Z A R N I T Z K I , D . ; K R A F T, K . Fi r m leadership and innovative performance: evidence from seven EU countries. Small Business Economics, Dordrecht, v. 22, n. 5, p. 325-332, June 2004.
GEROSKI, P. A. Innovation, technological opportunity, and market structure. Oxford Economic Papers, Oxford, v. 42, n. 3, p. 586-602, July 1990.
G R I M PE , C . ; H U S S I N G E R , K . Pre -empting technology competition through irm acquisitions. Economics Letters, Amsterdam, v. 100, n. 2, p. 189-191, Aug. 2008.
GONZÁLEZ, M.; GUISADO-TATO, M.; FERRO-SOTO, C. Ayudas públicas como determinante de la cooperación en investigación y desarrollo. Revista Venezolana de Gerencia, Maracaibo, v. 18, n. 64, p. 631-648, oct./dic. 2013.
GUISADO-TATO, M.; VILA-ALONSO, M.; GUISADO-GONZÁLEZ, M. Financiación pública de la innovación. Cooperación en I+D y pertenencia al sector gráico. DYNA, Ingeniería e Industria, Bilbao, v. 85, n. 9, p. 760-767, dic. 2010.
HARABI, N. Appropriability of technical innovations: an empirical analysis. Research Policy, [S. l.], v. 24, n. 6, p. 981–992, Nov. 1995.
HENNART, J. F. A transaction cost theory of equity joint ventures. Strategic Management Journal, Chichester, v. 9, n. 4, p. 361-74, July/ Aug. 1988.
INKPEN, A. C. Learning, knowledge acquisition and strategic alliances. European Management Journal, Oxford, v. 16, n. 2, p. 223-229, Apr. 1998.
JIRJAHN, U.; KRAFT, K. Do spillovers stimulate incremental or drastic product innovations? Evidence from German establishment data. Oxford Bulletin of Economics and Statistics, Oxford, v. 73, n. 4, p. 509-538, Aug. 2011.
JORDE, T. M.; TEECE, D. J. Innovation and cooperation: implications for competition and antitrust. Journal of Economic Perspectives, Nashville, v. 4, n. 3, p. 75-96, Summer 1990.
KIM, L. he dynamics of technological learning in industrialization. International Social Science Journal, Paris; Oxford, v. 53, n. 168, p. 297–308, June 2001.
KLEVORICK, A. K. et al. On the sources and signiicance of interindustry diferences in technological opportunities. Research Policy, [S. l.], v. 24, n. 2, p. 185–205, Mar. 1995.
LANE, P. J.; LUBATKIN, M. Relative absorptive capacity and interorganizational learning. Strategic Management Journal, Chichester, v. 19, n. 5, p. 461-477, May 1998.
LEVIN, R. C. et al. Appropriating the returns from industrial R&D. Brookings Papers on Economic Activity, Washington, D. C., v. 3, p. 783–820, 1987.
LEIPONEN, A. Skills and innovation. I n t e r n a t i o n a l J o u r n a l o f I n d u s t r i a l Organization, Amsterdam, v. 23, n. 5-6, p. 303–323, 2005.
LIN, E. S.; HSIAO, Y. C.; LIN, H. L. Complementarities of R&D strategies on innovation performance: evidence from Taiwanese manufacturing irms. Technological and Economic Development of Economy, Abingdon, v. 19, p .134–156, 2013. Supplement 1.
LOVE, J. H.; ROPER, S. Location and network effects on innovation success: evidence for UK, German and Irish manufacturing plants. Research Policy, [S. l.], v. 30, n. 4, p. 643–661, Apr. 2001.
LÓPEZ, A. Determinants of R&D cooperation: evidence fro m Spanish manufacturing firms. International Journal of Industrial Organization, Amsterdam, v. 26, n. 1,
p. 113-136, Jan. 2008.
LUCENA, A. he organizational design of R&D activities and their performance implications: empirical evidence for Spain. Industry & Innovation, [S. l.], v. 18, n. 2, p. 151-176, May 2009.
McDONALD, R. P. Test theory: a unified treatment. New York: Routlege Taylor & Francis Group, 1999.
MARKIDES, C. C.; WILLIAMSON, P. J. Corporate diversification and organizational structure: a resource-based view. Academy of Management Journal, New York, v. 39, n. 2, p. 340-367, Apr. 1996.
MILGROM, P.; ROBERTS, J. he economics of modern manufacturing: Technology, strategy, and organization. American Economic Review, Nashville,v. 80, n. 3, p. 511-528, Jun. 1990.
MIRAVETE, E. J.; PERNÍAS, J. C. Innovation complementarity and scale of production. he Journal of Industrial Economics, [S. l.], v. 54, n. 1, p. 1–29, Mar. 2006.
MOHNEN, P.; RÖLLER, L. Complementarities in innovation policy. European Economic Review, Amsterdam, v. 49, n. 6, p. 1431 – 1450, 2005.
MOWERY, D.; OXLEY, J.; SILVERMAN, B. Strategic alliances and interirm knowledge transfer. Strategic Management Journal, Chichester,v. 17, n. 52, p. 77-91, Winter 1996.
NIETO, M.; QUEVEDO, P. Absorptive capacity, technological opportunity, knowledge spillovers, and innovative efort. Technovation, [S. l.], v. 25, n. 10, p. 1141–1157, Oct. 2005.
PARK, N. K.; MEZIAS, J. M.; SONG, J. A resource-based view of strategic alliances and irm value in the electronic marketplace. Journal of Management, housand Oaks, v. 30, n. 1, p. 7-27, Feb. 2004.
PETERAF, M. A. he cornerstones of competitive advantage: a resource-based view. Strategic Management Journal, Chichester, v. 14, n. 3, p. 179–191, Mar. 1993.
ROSENKOPF, L.; ALMEIDA, P. Overcoming local search through alliances and Mobility. Management Science, Linthicum, v. 49, n. 6, p. 751-766, June 2003.
ROTHAERMEL, F.; HILL, C. W. Technological discontinuities and complementary assets: A longitudinal study of industry and firm performance. Organization Science, Linthicum, v. 16, n. 1, p. 52-70, Jan./Feb. 2005.
SCHMIEDEBERG, C. Complementarities of innovation activities: an empirical analysis of the German manufacturing sector. Research Policy, [S. l.],v. 37, n. 9, p. 1492-1503, Oct. 2008.
SCHOENMAKERS, W.; DUYSTERS, G. Learning in strategic technology alliances. Technology Analysis & Strategic Management, [S. l.], v. 18, n. 2, p. 245–264, May 2006.
S E R R A N O B E D I A , A . M . ; L Ó P E Z -FERNÁNDEZ, M.C.; GARCÍA-PIQUERES, G. Complementarity between innovation activities and innovation performance: evidence from Spanish innovative firms. Journal of Manufacturing Technology Management, Bradford, v. 23, n.5, p. 557-577, 2012.
TEECE, D. J. Profiting from technological innovation: implications for integration,
collaboration, licensing and public policy. Research Policy, [S. l.], v. 15, n. 6, p. 285–305, Dec. 1986.
______. Competition, cooperation, and innovation: organizational arrangements for regimes of rapid technological progress. Journal of Economic Behavior & Organization, Bradford, v. 18, n. 1, p. 1–25, June 1992.
TOPKIS, D. L. Minimizing a submodular function on a lattice. Operations Research, Baltimore, v. 26, n. 2, p. 305-321, Mar./Apr. 1978.
TRIGUERO, A.; CÓRCOLES, D. Understanding innovation: an analysis of persistence for Spanish manufacturing irms. Research Policy, [S. l.], v. 42, n. 2, p. 340– 352, Mar. 2013.
VASUDEVA, G.; ANAND, J. Unpacking absorptive capacity: a study of knowledge utilization from alliance portfolios. Academy of Management Journal, New York, v. 54, n. 3, p. 611-623, June 2011.
VEGA-JURADO, J. et al. he efect of external and internal factors on irms’ product innovation. Research Policy, [S. l], v. 37, n. 4, p. 616-632, May 2008.
VEUGELERS, R.; CASSIMAN, B. Make and buy in innovation strategies: evidence from Belgian manufacturing irms. Research Policy, [S. l.], v. 28, n. 2, p. 63-79, Jan. 1999.
WERNERFELT, B. A resource-based view of the irm. Strategic Management Journal, Chichester, v. 5, n. 2, p. 171-180, 1984.
APPENDIX A - Variable deinitions
Variable Variable construction
% SALESNEWP Percentage of the company’s total turnover of new or signiicantly upgraded products or services introduced by the company in the market
INNOVPP he irm undertook product and/or process innovation activities (0,1) IRD he irm conducted internal R&D activities systematically (0,1)
DRC he irm established R&D cooperation agreements with other companies and institutions (0,1)
ITO Industrial Technological Opportunities
he average value from the importance attached to cooperation on innovation activities with (number between 0 (not used) and 3 (high)): companies same group (IMCOOP1), customers (IMCOOP2), suppliers (IMCOOP3), and competitors (IMCOOP4)
NITO No Industrial Technological Opportunities
he average value from the importance attached to cooperation on innovation activities with (number between 0 (not used) and 3 (high)): consulting irms (IMCOOP5), commercial laboratories and R&D companies (IMCOOP6), universities and higher education institutions (IMCOOP7), and public research institutions and technology centres (IMCOOP8)
LMP
Legal Mechanisms Protection
he average value of the following mechanisms of legal protection (number between 1 (not used) and 4 (high)): patents (LMP1), registered utility models (LMP2), trademarks (LMP3), and copyright (LMP4)
SMP
Strategic Mechanisms Protection
he average value of the following mechanisms of strategic protection (number between 1 (not used) and 4 (high)): trade secrecy (SMP1), design complexity (SMP2), and lead time over competitors (SMP3)
SIZE
(1) Companies that had a turnover exceeding the top quartile of sales for the manufacturing sector to which the company belongs.
(2) Indicates that the turnover is greater than the irst quartile and less than or equal to the median of the sales of the corresponding manufacturing sector.
(3) Shows that the turnover is higher than the median and less than or equal to the third quartile of sales of the relevant manufacturing sector.
(4) Corresponds to companies with a turnover exceeding the third quartile of sales of the manufacturing sector to which the company belongs.
GROUP he irm belongs to a group (0,1)
INNOVRANK
(0) No innovation expenditure
(1) Companies that had total innovation expenditures exceeding the top quartile of costs of innovation for the industry for the manufacturing sector to which the company belongs.
(2) Indicates that total innovation expenditures are greater than the irst quartile and less than or equal to the median of the costs of innovation of the corresponding manufacturing sector.
(3) Shows that total innovation expenditures are higher than the median and less than or equal to the third quartile of the costs of innovation of the relevant manufacturing sector.
(4) Corresponds to companies with total innovation expenditures exceeding the third quartile of the cost of innovation of the manufacturing sector to which the company belongs.
TECIN
Technological Intensity INNOVRANK/SIZE (0-4)
ECOFACT Economic Factors
he average value of the scores of importance of the following obstacles to the innovation process (number between 1 (not relevant) and 4 (high)): Excessive economic risk, high innovation costs, and limited funding sources
INTERFACT Internal Factors
he average value of the scores of importance of the following obstacles to the innovation process (number between 1 (not relevant) and 4 (high)): Organizational rigidities, the lack of qualiied personnel, the lack of technological information, and the lack of market information.
OTHERFACT Other Factors
he average value of the scores of importance of the following obstacles to the innovation process (number between 1 (not relevant) and 4 (high)): excessive rigidity of rules and regulations, and the lack of consumer sensibilities about new products and services.