FUNDAÇÃO GETULIO VARGAS
ESCOLA BRASILEIRA DE ADMINISTRAÇÃO PÚBLICA E DE EMPRESAS
DANIEL MUNIZ CAMARGO
THE EXHAUSTION OF THE BRAZILIAN GROWTH CYCLE
Rio de Janeiro
DANIEL MUNIZ CAMARGO
The exhaustion of the Brazilian growth cycle
Dissertação para obtenção do grau de mestre, apresentada à Escola Brasileira de Administração Pública e de Empresas
Orientadora: Deborah Moraes Zouain
Rio de Janeiro
2013
Ficha catalográfica elaborada pela Biblioteca Mario Henrique Simonsen/FGV
Camargo, Daniel Muniz
The exhaustion of the Brazilian growth cycle / Daniel Muniz Camargo. – 2013. 46 f.
Dissertação (mestrado) - Escola Brasileira de Administração Pública e de Empresas, Centro de Formação Acadêmica e Pesquisa.
Orientadora: Deborah Moraes Zouain. Inclui bibliografia.
1. Ciclos econômicos – Brasil. 2. Brasil – Condições econômicas. I. Zouain,
Deborah Moraes. II. Escola Brasileira de Administração Pública e de Empresas. Centro de Formação Acadêmica e Pesquisa. III. Título.
"No society can surely be flourishing and happy, of which the far greater part of the members are poor and miserable."
Abstract
Much has been said about Brazil in the past decade, emphasizing how the country has risen to become one of the richest economies in the world and a global player. Nevertheless, there are signs that this recent prosperity is coming to an end, indicating that there was an excessive optimism about the country's apparent economic success and continuous growth prospects. Brazil has relied on commodity exports and on a consumption-led growth model, that became the prime movers of the economy. A booming world economy demanding commodities and a strong and unexplored internal market help explain Brazilian growth in the past decade. However, this model has several shortcomings. Inflation is rising once again and the bottlenecks that stand in the way to economic development haven't been solved. The aim of this dissertation is to demonstrate that the current growth cycle of the Brazilian Economy is ending. Data from various local and international sources will be used to show that the country, once again, had an ephemeral growth and lacks an adequate economic structure that is able to foster long term development. A brief analysis of economic fundamentals, business climate and other issues related to growth and development will be presented, articulating the data and facts to find underlying causes and explanations of the current downturn.
Resumo
O Brasil recebeu muita atenção na última década, sua ascensão ao status de grande potência e uma das maiores economias mundiais tem sido enfatizada. No entanto, existem sinais de que essa prosperidade recente está chegando ao fim, sugerindo que houve um excesso de otimismo em relação ao aparente sucesso econômico do país e a possiblidade de crescimento contínuo. O Brasil focou na exportação de produtos primários e em um modelo de crescimento baseado no consumo, que se tornaram as locomotivas da economia. Uma pujante economia mundial demandando produtos primários e um amplo e inexplorado mercado interno ajudam a explicar o crescimento brasileiro na década passada. Não obstante, esse modelo apresenta diversas limitações. A inflação, mais uma vez, está em alta e os gargalos que impedem o desenvolvimento econômico não foram resolvidos. O objetivo desta dissertação é demonstrar que o atual ciclo de crescimento da economia brasileira está no fim. Dados de diversas fontes, nacionais e internacionais, serão usados para indicar que, novamente, o país teve um crescimento efêmero e não possui uma estrutura econômica adequada para promover o desenvolvimento de longo prazo. Uma breve análise dos fundamentos econômicos, clima de negócios e outros tópicos relacionados ao crescimento e desenvolvimento será apresentada, articulando dados e fatos para encontrar causas e explicações para a atual inversão de tendência econômica.
Tables and Figures
Figure 1 - Economic activity and Exports...20
Figure 2 - Family debt...21
Figure 3 - Housing prices...22
Figure 4 - Staple food basket in BRL and monthly inflation %...22
Figure 5 - Exchange rate and interest rate...23
Figure 6 - Productivity...24
Figure 7 - Gross National Savings (R$ millions)...25
Figure 8 - Gross National Savings Seasonally Adjusted (R$ millions)...25
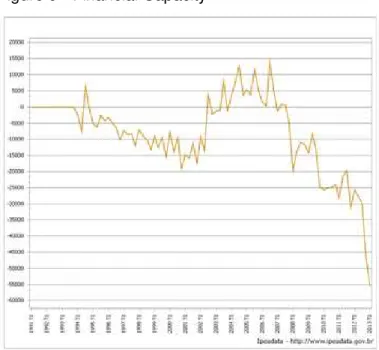
Figure 9 - Financial Capacity...26
Figure 10 - Main Brazilian Exports 2010...26
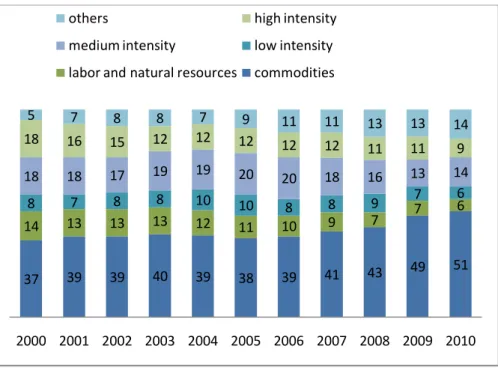
Figure 11 - Exports by type (%)...27
Figure 12 - Financial Markets...28
Figure 13 - Stages of development ...31
Figure 14 - Brazil and comparator economies, the ease of doing business...33
Figure 15 - Country comparisons Brazil...34
Figure 16 - Reforms and economic progress, virtuous cycle...41
Index
1 Introduction ... 10
2 Research Goals ... 12
3 Literature review ... 13
3.1 Economic and Business Cycles ... 13
3.2 Complementary topics ... 15
4 Chapter 1 - Exhaustion of the growth cycle ... 19
4.1 Context ... 19
4.2 The current growth cycle ... 20
4.3 Public Sector ... 25
4.4 Trade and external sector ... 27
4.5 Stock Market ... 28
5 Chapter 2 - Overview of the Brazilian economic structure ... 30
5.1 Global Competitiveness Report ... 30
5.2 Doing Business ... 33
5.3 Economic Freedom Index ... 35
6 Chapter 3 - Discussion... 39
7 Final Comments... 43
1
Introduction
Much has been said about Brazil in the past decade - both by scholars and the media - regarding how the country has risen to become one of the richest economies in the world and a global player (Roett, 2012; Rohter, 2010; Brainard & Martínez-Díaz, 2009; The Economist, 2009). Nevertheless, there are signs that this recent prosperity is coming to an end (World Bank, 2013), one might even say that there has been an excessive optimism about the country's economic success and continuous growth prospects.
Brazil has relied on commodity exports and on a consumption-led growth model that are the prime movers of the economy. Millions of Brazilians that had no access to credit and goods gained access to the market, besides that, favorable commodity prices contributed to the current state of affairs (Sharma, 2012). A booming world economy demanding commodities and a strong and unexplored internal market help explain Brazilian growth in the past decade. However, this model has several shortcomings that lead to limited investment and growth (Kaldor, 1971).
There has been insufficient public investment, especially when compared to other kinds of expenditures such as debt and personnel payments (CONTAS ABERTAS, 2013). In that sense, government spending has been directed towards social programs and a growing Leviathan that has reached the historical record of 39 ministries. Inflation is rising once again and the bottlenecks that stand in the way to economic development haven't been solved (World Bank, IMF, Reuters, 2013).
Furthermore, it's hard to identify a solid and coherent plan to foster growth and development, Brazilian economic policy is increasingly based on ad hoc measures that favor specific interest groups and don't solve the country's core problems.
The aim of this dissertation is to demonstrate that the current growth cycle of the Brazilian Economy is ending. Data from various local and international sources will be used to show that the country, once again, had an ephemeral growth and lacks an adequate economic structure that's able to foster long term development.
World Cup and the 2016 Olympic Games, inadequate investments don't seem to be able to improve neither the day to day life of the ordinary citizen nor the business climate (World Bank, 2013).
On the academic side, a brief analysis of economic fundamentals, business climate and other issues related to growth and development will be presented. This will be articulated with the data and facts to find causes and explanations to the current downturn.
It's important to emphasize that the topic of this research was chosen before major protests against corruption and low quality public services spread all over Brazil (BBC; CNN, 2013).
2
Research Goals
Brazil has always been the "country of the future", since the Portuguese settlers arrived in the 16th century observers have predicted a glorious future for the country (Perry, 2000). Every new economic cycle brought similar predictions, especially the ending one (rising Brazil, economist). According to Perry (2000) Brazil was standing at a "critical historical juncture" in the year 2000, the country's new development model was unable to provide self-sustainable development, so additional reforms and austerity were still needed.
Thirteen years later the situation hasn't changed much. Enormous developmental problems persist and Brazil remains the country of the future and its fate is highly unknown. In this sense, Sharma (2012) argues that the Brazilian economy relies heavily on commodity prices and as global demand for them is unstable and falling, the country should diversify in order to keep on growing and boost its growth. But the country lacks economic freedom, that is, relies too much on the government while entrepreneurs face many difficulties, positioning Brazil as the 100th freest economy in the world (Heritage Foundation, 2013).
This study's goal is to demonstrate that the current growth cycle of the Brazilian economy is ending, that is, identifying a turning point in the positive trend. This goal will be achieved by using data on economic activity and listing the main problems that the Brazilian economy faces. The selected time frame begins in 2000, two years before the country had the presidential election that brought the labor party (Partido dos Trabalhadores, PT) to power, and goes as far as there is available data, namely, the first half of 2013.
There's no intention to predict the future, despite many efforts in that direction, no one knows how the economy will behave (Taleb, 2007). The objective is simply showing what happened in the chosen time period and where Brazil stands right now.
3
Literature review
This literature review will be organized in two topics, the first one dedicated to the economic and business cycle discussion, the second one is broader and encompasses other relevant issues that shall be useful for the development of this study.
3.1
Economic and Business Cycles
Since the 1930s economic life is considered complex and cyclical, presenting wave-like behavior. There are three types of economic cycles: short, intermediate and long. The first one ranging from three to one and a half year, the second seven to eleven years and the third has an average of 50 years (Kondratieff & Stolper, 1935). movement of the capitalist economy.
Kondratieff's classic paper argues that, very probably, the economy has a cyclical character and analyses long waves that show characteristics similar to intermediate waves in terms of regularity. Key data for these purposes are: commodity prices, state bonds interest rate, wages, foreign trade, production and consumption of coal, pig iron and lead. These various time series identifies different turning points in the economy, but the author is able to suggest the most probable dates they actually took place.
Going further and discussing how to measure business cycles, Burns and Mitchell (1946) describe how to date cyclical movements, focusing on identifying turning points, that are points in time when groups of economic indicators change their trend from positive to negative, or vice versa. This is an unsolved issue in Kondratieff's paper. According to the authors business cycles can be defined as the successive patterns of rise and decline in economic activity.
The view proposed by Burns and Mitch has been criticized because of conceptual and practical shortcomings, critics mainly argue that turning points could only be detected after a certain amount of time after they have begun (Beveridge & Nelson, 1981). Nevertheless, the concept put forth by Burns and Mitch fits the purpose of the present study and is considered the standard business cycle definition and a seminal contribution to the study of business cycles (Baxter & King, 1999; Harding & Pagan, 2002).
Advancing the business cycle discussion and providing specificities about it, McQueen and Thorley (1993) argue that business cycles present sharp troughs and round peaks. That is, it is common that from a downward to an upward trend there is a sharp turning point, whereas the opposite movement from an upward to a downward trend is smoother. The authors state that this asymmetry has received little attention despite the fact that Keynes mentioned it in the 1930's. The paper shows empirical evidence and confirms sharp transitions from the bottom to the peak and round transitions from the peak to the bottom.
Harding and Pagan (2002) use Burns and Mitchell's business cycle definition as a 'pattern in the level of aggregate economic activity'. They also say that from the beginning of macroeconomic research patterns in data have called researchers' attention, these patterns were named cycles. The nature of cycles has been explored in two ways, first by graphical analysis, later on by quantitative measures. The relationship between the two approaches is analyzed and they conclude that the older graphic approach is the more flexible and informative method.
Locating the turning point might be done visually in some occasions, as well as not taking into consideration movements that are short lived and of insufficient magnitude, that is, false turning points (Harding & Pagan, 2002). The authors advocate the use of graphical analysis as a valid mean to identify turning points and disregard false ones. Their method is very similar to the one used by the NBER, emphasizing once more the importance of Burns and Mitchell's work.
The business cycle definition proposed by Burns and Mitchell is the alternating phases definition, that there is an alternation between phases of expansion and contraction in economic activity despite an overall growth average in developed economies (Morley & Piger, 2012). There's a second broader definition that sees the business cycle as short-run fluctuations in economic activity (not considering seasonal movements) not specifying if there is growth or recession. A third definition is that the business cycle represents temporary fluctuations of economic activity away from a long-run trend. The last definition is called the output-gap, proposed by the authors as the most useful one.
After reviewing the literature some differences between the terms economic cycle and business cycle appear. Authors like Kondratieff talk about economic cycles that can last from a couple of years to decades and also coexist, that is, several short cycles in an intermediate one and intermediate cycles in long ones. On the other hand, Morley and Piger define the business cycle as fluctuations in the economy that are neither seasonal nor long-run growth. The other authors seem to agree with the latter view.
3.2
Complementary topics
Kaldor (1971) states that when it comes to economic policy objectives governments are judged by performance criteria, more specifically by the following four items: unemployment rate, balance of payments, growth and wage increase. Successful economic policies lead to reaching the desired target in these items. Very rarely the same policy instrument can assure success in attaining more than one target. The author analyses how England stands in the early 1970s and what could have been done differently in the past to increase its current economic performance, more precisely in the post-war period.
Mistaken economic policies make it hard for a country to achieve success, nevertheless, consumption-led growth is better than stagnation and recession, that could have been the alternative of the situation the author describes. There must be an adjustment from consumption-led to export-led growth, altering the economy to increase investments that are necessary to have higher growth rates. Kaldor believes export-led growth has several advantages, especially releasing resources by restraining internal consumption while providing investment incentives to match the increase of foreign demand, besides boasting the overall economic productivity that will be positively influenced by the improving export performance.
Going further into the export-led growth discussion, Giles and Williams (2000) survey more than 150 empirical papers that analyze the relationship between exports and growth. The core issue in export-led growth (ELG) debates is whether a country will be better off by focusing trade policy on export promotion or on import substitution. The neoclassical view argues that growth can be achieved by ELG and cites several supporting examples from Asia such as the pioneers Hong Kong, Singapore, Taiwan and Korea to more recent cases as Malaysia and Thailand. China has been recently added to this group.
The abovementioned countries are compared to Latin America and Africa to show how standards of living have been rising faster in the former group. The argument is that trade openness lead to faster and more efficient growth as well as better allocation of domestic resources. Besides that, exports would increase the demand for a country's output, which lead to growth; there would be productivity gains stemming from specialization in export products; access to technology; and better management practices would be easier. The authors state that support for ELG is not unanimous and their review of empirical papers show conflicting results (Giles & Williams, 2000).
The opposite view is pro-protectionism and proposes import substitution as the best way for a country to grow. Tariffs, quotas and subsidies are used to protect the market for local firms, barring external competition. The supposedly negative effects of trade between rich and poor countries are mitigated with this strategy, as well as promoting local industry in a broader way than ELG is capable of doing.
Cheng and Feng (2000) present a study that aims at identifying commonalities between the Chinese and other countries' growth pattern. As well as determining particular characteristics from China in order to understand economic performance differences between provinces. According to the author, growth is dependent on the following factors: human capital, investment, trade, government spending, rule of law, political stability, income distribution and inflation.
The central government must take the succeeding measures towards the least developed provinces to allow them to catch up with the most developed ones: first, building human capital and improving health care; second, putting resources in economic sectors with comparative advantage and engaging in international trade; third, building inter-provincial infrastructure. Besides these, there are broader measures that aim at providing a stable macroeconomic environment that could lead to sustainable long-term growth.
The authors argue that pro-market initiatives in the coastal provinces have been beneficial, and alongside better education are able to explain higher growth rates. Some examples of these initiatives are a higher numbers of private and semi-private firms and involvement in international trade (Chen & Feng, 2000). On the other hand, high inflation, high fertility rates and the presence of state-owned firms reduce growth. The main conclusion of the paper is that private firm participation in the economy, better education and trade openness have positive direct impacts on growth rates, therefore, should be the aim of government policy.
Bittencourt (2012) investigates the role of financial development in fostering economic growth in four Latin American countries: Argentina, Bolivia, Brazil and Peru. These countries have showed unstable growth rates, political transitions and poor macroeconomic performance, going through a democratization process in the 1980s and macroeconomic reforms and stabilization in the 1990s.
4
Chapter 1 - Exhaustion of the growth cycle
4.1
Context
As stated before, the present study will use the business cycle definition put forth by Burns and Mitchell (1946), as the successive patterns of rise and decline in economic activity. These authors propose using several time series instead of a single one when dating the business cycle, the concern here is not dating, just showing the exhaustion of the cycle, nevertheless several time series will be used.
This study's main goal is showing the exhaustion of the current cycle of the Brazilian economy. This chapter will discard seasonal variations and long-run growth involving several decades, focusing in the end of the cycle, indicating that the turning point has begun. It is also useful to have in mind Morley and Piger's (2012) definition of the business cycle as fluctuations in the economy that are neither seasonal nor long-run growth.
Locating the turning point might be done visually by graphical analysis, as well as disregarding false turning points, that are short lived movements of insufficient magnitude (Harding & Pagan, 2002), especially by using several time series. Data from the past 13 years will be used, but it's important to stress that not all the time series considered begin in 2000, some are more recent and others display earlier data. This won't interfere with the goals of the chapter or the study.
It is important to stress that this study is not concerned in specifying when the current growth cycle began, the selected time frame starts in 2000, two years before the country had the presidential election that brought the labor party (Partido dos Trabalhadores, PT) to power, and goes as far as there is available data, namely, the first half of 2013. This choice is related to growing awareness about Brazil in this period and the political calendar, from the end of Fernando Henrique Cardoso's second term to the Lula years that include the ongoing Dilma Rousseff's government.
After successive failed attempts to control inflation and be able to grow again -such as price controls and introducing several new currencies - the Real Plan was launched in 1994, bringing a new era of low inflation and stability to the Brazilian economy. Nevertheless, the country was dependent on a fixed exchange rate that shifted to a floating one in 1999, this instability led to economic stagnation in 1998 and 1999 (Averbug, 2002).
After this period of brief economic stagnation the Brazilian economy recovered and was soon growing again, until reaching 7.5% growth in 2010, the highest level in the past two decades (IBGE, 2013). These numbers also indicate that the country quickly recovered from the 2008 economic crisis, in 2009 the economy had a slight 0,6 retraction. Nevertheless, the high rate in 2010 is partially explained because of the comparison to 2009, a year characterized by recession.
4.2
The current growth cycle
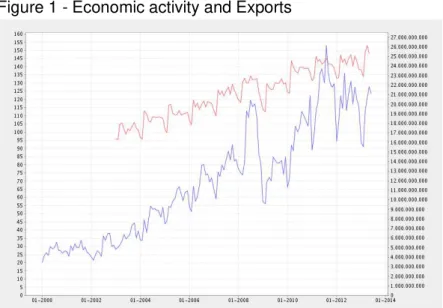
The current growth cycle can be seen as the one that started after the Real Plan, or after the 1998/1999 currency devaluation. Either way, what's relevant is to show the cycle's exhaustion, the turning point. This section's aim is supporting the hypothesis that the current growth cycle of the Brazilian economy is ending.
Figure 1 - Economic activity and Exports
Red axis - Economic Activity Index (IBC-Br): monthly index that aims at reproducing the GDP variation, based on proxies that try to capture the behavior of economic sectors.
Blue axis - Exports (Fob) - Total Source: Brazilian Central Bank
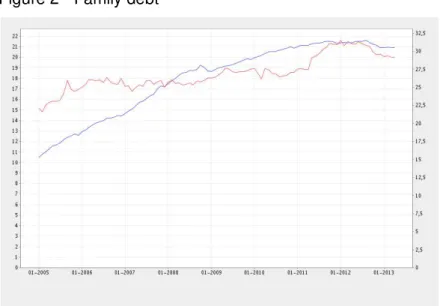
Family debt is increasing; in April 2013 total family debt represented 44.46% of income in the last 12 months. This percentage has been growing since 2005, when the Central Bank started it. April is the highest result in the time series. Credit for families represented 45.7% of total credit in March 2013, growing 13.8% in 12 months. The credit volume in the financial system equaled R$2,42 trillion in March 2013, growing 16.9% in relation to March 2012, increasing the credit/GDP ratio from 49.2% to 53,9% (Banco Central do Brasil).
Figure 2 - Family debt
Red axis: Household debt service ratio without mortgage loans - Seasonally adjusted data Blue axis: : Household debt without mortgage loans
Source: Brazilian Central Bank
The effect of excessive consumption, as the growing debt level indicates, leads to inflation, prices have been rising steadily. Some noteworthy elements of this persistent inflation are food prices, that increased almost three times since the year 2000 and housing prices, that increased almost five times since 2001 as figures 3 and 4 show.
Rising inflation, which can lead to higher interest rates, can further increase family debt (IMF, 2012). Besides that, in an economy heavily based on family consumption, higher debt levels can reduce economic activity, because families will redirect part of their spending from consumption to debt payments. It is relevant to stress that one of the main reasons for the 2008 recession was the increasing family debt levels in countries such as Spain, Ireland, USA, Norway, Holland and Denmark. In these countries, the debt/income ratio increased, in average, from 39% in 2002 to 138% in 2008 (Roxburgh et al., 2010).
Figure 3 - Housing prices
Residential Real Estate Collateral Value Index (March 2001 = 100) Source: Brazilian Central Bank
Family debt might turn into a major problem for Brazil, debt payments can take a long time through savings, interest rates might be reduced or there can be renegotiations to avoid a bail out. There is a problem, because family assets are concentrated in real estate, if there is a housing bubble, what seems to be happening, debt payments might take decades.
Besides that, rising housing prices not only increases inflation, but also stands in the way of economic activity. Rents are raised, increasing costs not only to big firms, halting new businesses, broadly affecting the economy.
Figure 4 - Staple food basket in BRL and monthly inflation %
Red axis: Staple food basket in BRL Blue axis: monthly inflation %
A more detailed view on inflation, Brazilian central bank works with inflation targeting, since 2006 the target is 4.5% per year with 2% tolerance intervals. Inflation in the past 12 months (June 2012-2013) is 6.58%, a much higher value when compared to developed economies and even several developing ones, G7 inflation was 1.9% in 2012, China 2.6%, Chile 3% and Mexico 4.1% (OECD, 2013). The target hasn't been reached systematically, in 2011 inflation was 6.6%, in the first and second quarter of 2013 6.4% and 6.6% respectively.
The central bank seems to be lenient on the inflation control, the target is ignored and the upper tolerance interval of 6.5% is tacitely accepted by the authorities. This situation increases inflationary expectations and corroborate rumors of political interference on the central bank. What the numbers and charts show is a widespread inflation over the years that hasn't been tackled appropiately.
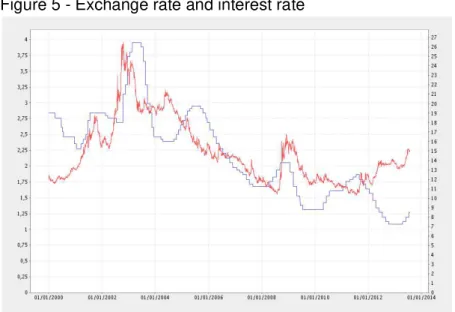
Figure 5 shows the benchmark exchange rate (SELIC) determined by the Central Bank. This rate has historically been one of the highest in the world, the chart shows it has been decreasing since 2003, but not constantly. There's a wave like pattern that resulted in low interest rates compared to the past, but the current trend is upward, raising the rate to control inflation. Higher interested rates make economic growth slow down.
Figure 5 - Exchange rate and interest rate
Exchange rate BRL/USD Interest rate - Selic target Source: Brazilian Central Bank
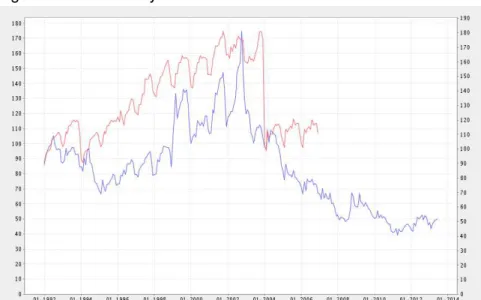
years, figure 6 shows that from 2004 onwards productivity remained in levels similar to those in the early 1990s. The result is even worse when the exchange rate is tied to productivity, from 2005 onward productivity declined to approximately half the 1994 values and hasn't risen ever since.
Figure 6 - Productivity
Red axis: Manufacturing industry (1992=100) - Productivity
Blue axis: Real exchange rate index tied to productivity - June/1994=100 Source: Brazilian Central Bank
4.3
Public Sector
Figure 7 - Gross National Savings (R$ millions)
Source: IBGE/SCN
Figure 8 - Gross National Savings Seasonally Adjusted (R$ millions)
Source: IBGE/SCN
Figure 9 - Financial Capacity
Source: IBGE/SCN
4.4
Trade and external sector
The growing importance of primary products in Brazilian exports is portrayed in figures 10 and 11. This fact is not only related to the past boom in commodity prices, it's a reflex of the loss of competitivity all other economic sectors have suffered in the past decade, as figure 6 indicates in the case of productivity (Negri & Alvarenga, 2011).
Figure 10 - Main Brazilian Exports 2010
Source: Secex / MDIC
0,00% 2,00% 4,00% 6,00% 8,00% 10,00% 12,00% 14,00% 16,00%
The issue that leads to an economic downturn is that commodity prices have reached their peak and started declining. For instance, metal prices rose to the highest historic level in 2011 than started declining, sugar prices have been declining since that same year and accumulate a 50% decrease, oil prices have reached 2005 values, several relevant products exported by Brazil follow this patterns (IMF, 2013).
Figure 11 - Exports by type (%)
Source: Secex / MDIC
4.5
Stock Market
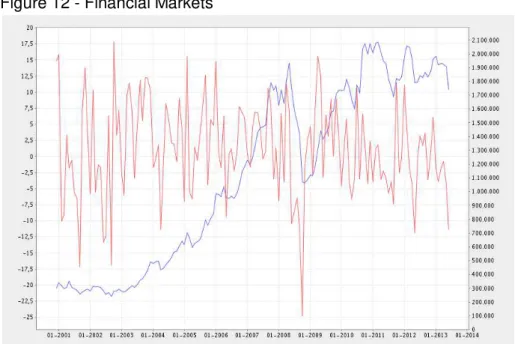
In the second week of July 2013 as this dissertation is being written the Brazilian stock market main index, Ibovespa has lost 25.41% of its value in the current year and 18.93% in the last 12 months. The trend is clear and is downhill. Figure 7 depicts not only this situation but also the loss of value of the companies listed in the São Paulo stock exchange
Brazilian real has been devaluating as figure 5 indicates. After approaching R$1,50 to the dollar, government intervention on the exchange rate grew with currency controls to slow down the dollar inflow and supposedly increase export competitivity,
37 39 39 40 39 38 39 41 43 49 51
14 13 13 13 12 11 10 9 7
7 6
8 7 8 8 10 10 8 8 9 7 6
18 18 17 19 19 20 20 18 16 13 14
18 16 15 12 12 12 12 12
11 11 9
5 7 8 8 7 9 11 11
13 13 14
2000 2001 2002 2003 2004 2005 2006 2007 2008 2009 2010
others high intensity
medium intensity low intensity
Brazilian finance minister even admitted this situation saying that: “Our system is a dirty float, like everyone’s,” (Leahy, 2012).
Figure 12 - Financial Markets
Red axis: Ibovespa - monthly percent change
Blue axis: Value of companies listed at Bovespa index (R$ millions) Source: Brazilian Central Bank
This chapter's goal was to demonstrate that the Brazilian economy is headed towards slower economic growth and possibly stagnation, several signs corroborate this hypothesis. The following chapter will see through this data, presenting a structural analysis of the Brazilian economy.
5
Chapter 2 - Overview of the Brazilian economic structure
The economic decline presented in chapter 1 doesn't arise out of random causes, after showing the turning point, that is, the beginning of the decline, some possible reasons for the current state of affairs will be shown. Different sources will be used to provide a broad view and avoid a biased analysis of basic economic factors that shall be described ahead.
5.1
Global Competitiveness Report
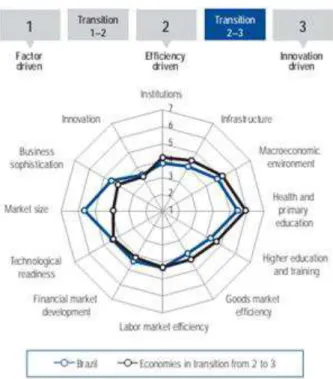
In order to better understand the data in the 2012-2013 Global Competitiveness Report by the World Economic Forum each of the 12 economic pillars used by the report to rank economies will be briefly described. Pillars 1 to 4 are basic requirements, 5 to 10 efficiency enhancers, 11 and 12 innovation and sophistication factors. This description is also useful to explain key issues that affect long-term economic development.
1) Institutions: are in a broad perspective the legal framework that determines how individuals, firms and governments interact to create wealth. Institutional quality determines competitivity, growth and prosperity. Beyond the legal framework, the degree of government intervention in the market and governmental efficiency as well as proper management of public finance are taken into consideration. Finally, private-sector transparency is the last item to compose this pillar.
2) Infrastructure: encompasses effective modes of transport, electricity supply and telecommunications networks.
3) Macroeconomic environment: government debt, fiscal deficit and inflation.
4) Health and primary education: a healthy workforce is more competitive and productive. Quantity and quality of basic education is related to worker efficiency.
5) Higher education and training: secondary and tertiary education are necessary for an economy to develop and produce more sophisticated products. Staff training upgrades worker's skills and doesn't exist in many economies.
protectionism. On the demand side, customer orientation and sophistication, in other words, how demanding customers are.
7) Labor market efficiency: efficiency and flexibility of the labor market that should provide optimal worker allocation and incentives. Also analyzes meritocracy in the workplace and equity between man and women.
8) Financial market development: an efficient financial sector allocates resources properly, has a transparent and trustworthy banking system and protects investors and other economic agents.
9) Technological readiness: level of technology available for firms in a country, how fast they adopt and absorb existing technology, especially information and communication technology in day-to-day activities (ICT).
10) Market size: considers both domestic and foreign market, international markets can in some measure substitute domestic markets.
11) Business sophistication: has two elements, the first is the quality of business networks and supporting industries, measured by the quantity and quality of local suppliers and how they interact. The second element is the quality of individual firms' operations and operations and strategies that can spill over into the economy and impact on business processes in several sectors.
12) Innovation: technological innovation is more important for economies that are approaching the frontiers of knowledge. This pillar measures if the environment leads to innovative activities supported both by the public and private sector. This pillar considers the following items: research and development spending; presence of high quality scientific research institutions; degree of collaboration between universities and firms; intellectual property protection; and access to venture capital and financing.
Despite these strengths, many improvements are necessary, the high inflation rate of nearly 7% per year is a concern, besides that trust in politicians (121st) and government efficiency (111th) are very low. There is also excessive government regulation (144th) and wasteful spending (135th). Low quality transport infrastructure (79th) remains an unsolved issue. The low quality education (116th) is not able to provide the necessary skilled labor force, creating a shortage of qualified workers.
Entrepreneurs and business men also have to go through many procedures (130th) that increase the time to start a business (139th), placing Brazil as one of the worst countries in the sample in these two areas. Besides that, taxation is seen as too high and as creating distortion in the economy (144th). In other words, it's hard to do business in Brazil, both in terms of cost and bureaucracy.
Figure 13 - Stages of development
Source: 2012-2013 Global Competitiveness Report
inefficient government bureaucracy and restrictive labor regulations. Besides these, other noteworthy factors are: inadequately educated workforce, corruption, access to financing, foreign currency regulations, insufficient capacity to innovate, and crime and theft.
5.2
Doing Business
The second data source is the 2013 Doing Business by the World Bank, it assesses the ease to open and run a firm complying with local regulations in 185 economies. There are 11 areas in the report that will also be briefly described following the logic of the previous one.
1) Starting a business: number of procedures to start up an industrial or commercial firm as well as their costs and the time to complete them; and the paid-in minimum capital before registration.
2) Dealing with construction permits: time and cost to obtain the approval to build a warehouse in the country's largest business center, connect it to basic utilities and register property.
3) Getting electricity: procedures, time and cost required for a firm to obtain an electricity connection for a warehouse.
4) Registering property: procedures necessary for a firm to purchase immovable property from a third party and transfer the property title to the buyer.
5) Getting credit: there are two sets of indicators, the first one measures rules and practices that affect credit information available through public or private credit offices. The second measures existing features that facilitate lending, such as the bankruptcy and collateral legislation.
6) Protecting investors: has three dimensions, related-party transactions1 transparency;
liability for self-dealing; and shareholder's ability to sue executives for misconduct.
7) Paying taxes: taxes that a firm must pay in a certain year, as well as the necessary administrative structure for that purpose.
8) Trading across borders: time and cost in exporting and importing a shipment of goods by sea and the paperwork necessary to complete it.
9) Enforcing contracts: time, cost and procedural complexity to resolve a commercial lawsuit before local courts.
10) Resolving insolvency: time, cost and outcome of domestic firms' insolvency proceedings and their recovery rate.
11) Employing workers: flexibility in the regulation of employment. Due to ongoing unsolved methodological issues Doing Business 2013 doesn't present rankings on this topic, nor includes it in the overall index. Although not scored, available data is presented.
As figure 23 shows, Brazil occupies the 130th position among 185 economies, being harder to conduct business in this country than in most Latin American countries such as Chile (37), Colombia (45) and Mexico (48). China (91) ranks better than Brazil as well. There are several obstacles to do business in Brazil as will be showed ahead when exploring the positioning in each of the 11 areas, especially by the average time to go through some procedures.
Figure 14 - Brazil and comparator economies, the ease of doing business
Source: 2013 Doing Business
take 34 days. When it comes to getting credit (104), access to credit must be improved, while credit information is a strength. Investor protection (82) is insufficient, shareholder rights must be improved.
Brazil has high costs for trading across borders (123), a container leaving a Brazilian port costs 3,8 times more than one from China and 2,2 times more than one from Chile. Inefficiencies in the judiciary lead to problems in enforcing contracts (116), solving a commercial dispute takes approximately 2 years while resolving insolvency (143) takes four years.
Finally, the major Brazilian problem, in terms of the position in the raking, is paying taxes (156), firms make in average 9 payments each year and spend 2600 hours (108 days) filing, preparing and paying taxes, besides that, taxes might take 69,3 % of profits. In line with the previous report, the 2013 Doing Business show how difficult it is to open and run a firm in Brazil, detailing the high costs and uncertainties associated with entrepreneurial activity in this country.
5.3
Economic Freedom Index
The Heritage Foundation Economic Freedom Index covers 185 countries. Brazil is the 100th freest economy in the world, as figure 24 shows its overall score (57.7/100) is below world (59.6) and regional average (59.4) and is far away from free economies (84.5). The index comprises 10 kinds of freedom, from property rights to entrepreneurship, in four different categories. Each will be briefly explained.
Figure 15 - Country comparisons Brazil
1) Rule of law: property rights and freedom from corruption. a) Property rights: private property recognition, rights and an effective rule of law to protect them, the enforcement of contracts plays a major role. b) Freedom from corruption, bribery, extortion, nepotism, cronyism, patronage, embezzlement, and graft.
2) Limited government: fiscal freedom and government spending. a) Fiscal freedom measures the extent to which government permits individuals and businesses to keep and manage their income and wealth for their own benefit. b) Cost of excessive government risk of crowding out private economic activity.
3) Regulatory efficiency: business, labor and monetary freedom. a) Business freedom
is about an individual’s right to open and run a firm without excessive interference from the state. b) Labor freedom is the ability of individuals to work as much as they want and wherever they want. Wage controls, restrictions on hiring and firing, and other constraints curtail this freedom. c) Monetary freedom necessitates a stable currency and prices determined by the market.
4) Open markets: trade, investment and financial freedom. a) Trade freedom is the degree of a country's openness to the flow of goods and services from around the
world and the citizen’s capacity to act as buyer or seller in the international market. b) An effective investment framework will support all kinds of firms, not only large or strategically important companies, encouraging innovation and competition. It must also be characterized by transparency and equity. c) Financial freedom means an accessible and well-functioning formal financial system, regulated exclusively to ensure transparency and honesty.
Property rights (53rd) and freedom from corruption (71st). Contracts are considered secure in general, but the judicial system is inefficient and vulnerable to political and economic influence, piracy of copyrighted material persists. Corruption is a major threat to economic freedom.
Fiscal freedom (135th) government spending (115th). The total tax burden reaches 32.5% of GDP. Public spending is more than one-third of GDP, recent fiscal stimuli have contributed to a trajectory of constant public deficits. Nevertheless, public debt has been considerably stable.
increase the cost of doing business, labor regulations remain strict. Inflation has increased as the Central Bank has cutting interest rates in the face of languid demand and an overvalued currency.
Trade freedom (127th), investment freedom (98th) and financial freedom (40th). The trade-weighted tariff rate is 7.6 percent. Non-tariff barriers and antidumping measures also contribute to the low score, that shows a closed and protectionist economy. Foreign investors are restricted to some sectors, the complexity of the tax and regulatory environment is a challenge to investors. The banking sector didn't suffer much in the aftermath of the 2008 crisis, with increasing credit to the private sector.
Complementing the index, taking into consideration its dimensions, a special report summarizes where Brazil stands (Roberts, Schreiber, & Scissors, 2012). According to the authors, the Brazilian government dominates several economic areas, discouraging the development of a stronger and more dynamic private sector. Government spending represents more than 40% of GDP. Reforms have slowed down and the tax burden is heavier than in many developing economies.
The high growth between 2006-2010 of around 4% a year is still significantly lower than the rate in other major developing economies. Quality of government services is very low, private property rights aren't secure and the judicial system is very vulnerable to political and economic manipulation. Besides that, corruption is widespread. Sustainable growth will require reforms to increase productivity and economic freedom. The authors go further and argue that the recent Brazilian prosperity induced by commodities has been driven mainly by China.
Finally, Sharma (2012) summarizes the main problems of the Brazilian economy, complementing what this section has so far presented. The author says that until very recently Brazil was seen as a very attractive and promising country in the eyes of both investors and academics, this led to a massive foreign capital inflow. Nevertheless, this positive image depends on commodity prices that are directly influenced by the Chinese economy demand for them.
workers in all areas, creating more problems and difficulties for firms that need qualified personnel.
Comparing China and Brazil, the author argues that Beijing follows the opposite model. China has opened itself to global trade and made high infrastructure investments, while Brazil is a very protectionist closed economy that invests very little. This lack of investments is responsible for inflation, as poor infrastructure and unqualified workers make companies spend more money and consequently raise their costs that will be transferred to the consumer.
Because of the above mentioned problems, every aspect of the Brazilian economy faces serious bottlenecks that stand in the way to its steady growth. Brazilian growth has been lower than other BRIC countries and will remain lower unless the features that characterize it as a high-cost, commodity-dependent economy are changed. In order to do that, Sharma suggests that the economy become more open, a reduction of the welfare state, simplification of the tax code while broadening the tax base and pension and social security modernization. Resources should be redirected to education, research and development, and infrastructure projects.
This chapter tried to present the real Brazil, not the one spoken of by its
6
Chapter 3 - Discussion
There is a connection between the first and the second chapter. The first one demonstrates that the current growth cycle has come to an end, Brazilian economy stands on a turning point toward slower growth and stagnation. This study, following Burns and Mitchell (1946) has identified a turning point, using several time series that depict economic indicators changing their trend from positive to negative.
It is important to stress that the end of the cycle does not have to be abrupt and lead to a long and sudden recession, there is evidence that cycles are characterized by a smooth and gradual transition from the peak to the trough (McQueen & Thorley, 1993). The economic decay can happen slowly and gradually as the Brazilian case seems to indicate. This corroborates the view of Beveridge and Nelson (1981) stating that turning points could only be detected a certain amount of time after they have begun.
The second chapter goes further and explores the business environment and the overall competitiveness of the Brazilian economy, presenting difficulties and unsolved issues that help explain why the growth cycle has ended. It must be mentioned that what affects the business cycle also affects long-run growth (Morley & Piger, 2012). The structural problems shown in chapter 2 are deeper than the signs that indicate the turning point in chapter 1, the former will stand on Brazil's way to long term development.
Having in mind Kaldor's (1971) description of the demand-led growth model and the export-led growth model, Brazil is closer to the former. Despite the commodity boom, internal demand has been extremely relevant for the country's economy, with the results shown in chapter 1 such as: low productivity gains, rising inflation and debt levels; these factors lead to a low growth rate. Data for the current state of affairs corroborate what Kaldor points out as the negative effects of demand-led growth.
Brazil is a closed economy that adopts selective import protection, promoting exports in some sectors while protecting most of the others. The dominant government strategy is pro-protectionism, rising costs that contribute to higher inflation rates; while reducing competition for local firms that end up having little incentives to invest and engage in innovative activities.
The reports and authors in chapter 2 agree with Cheng and Feng (2000) when stating that growth is dependent on human capital, investment, trade, rule of law, political stability, income distribution and low inflation. These same sources indicate that Brazil faces enormous difficulties in these areas, being badly positioned when compared to most countries. Brazil's position in the doing business and the competitivity rankings - as seen in chapter 2 - is not compatible to its recent economic growth and acquired superstar status. What can be seen is that the country is not only far beyond developed countries, but most Latin American and other relevant emerging economies have a much better business environment.
The measures proposed by Cheng and Feng (2000) to promote growth in least developed Chinese provinces are valid to Brazil. The first is building human capital. Human capital in Brazil is unqualified and untrained, there is a shortage of qualified workers in all areas, this limits the potential to grow and expand the economy. Besides that, strict labor regulations increase employers' cost and does not allow optimal worker distribution.
Second, allocating resources to economic sectors with comparative advantage; as a closed economy, several sectors that do not have comparative advantage are protected from competition, rising costs. More engagement in international trade would be beneficial, lowering costs and directing scarce resources to their optimal use. Fourth, building inter-provincial infrastructure; this would also contribute to lower costs. Finally, providing a stable macroeconomic environment that leads to sustainable growth. These measures would be valid to Brazil because as chapter 2 shows, the country still has a long way to improve in these specific areas.
The authors conclude that high inflation and the presence of state-owned firms reduce growth rates, while private firm participation in the economy, better education and trade openness have direct impacts on growth rates and should be the aim of government policy (Chen & Feng, 2000). What chapter 1 and 2 have shown is a rising inflation scenario, with massive state presence and intervention in the economy, lack of education, protectionism and entrepreneurial challenges. Brazilian politicians and decision makers have not tackled these issues, leading to the turning point and near stagnation current situation.
Economic and financial development depend on good macroeconomic performance, in terms of low inflation, independent central banks and fiscal responsibility (Bittencourt, 2012). It is clear that inflation in Brazil has been rising steadily, besides that, the target has been systematically ignored by the Central Bank; it is possible to question if governmental pressure has been responsible for these outcomes. Governmental spending has been rising, but not towards the investments to promote growth such as improving infrastructure and education, but mainly with personnel and social programs. A good example of excessive and misdirected spending is in the 39 minister cabinet of president Dilma Rouseff.
Bittencourt (2012) finishes his paper with a warning that should be seriously considered by Brazilian authorities: the reforms of the 1990s, that brought positive effects for Latin America must be kept and improved. The region has to avoid macroeconomic populism, protectionism and excessive regulation, negative features of the past that have been implemented lately in countries such as Argentina, Bolivia, Ecuador and Venezuela.
Notwithstanding, the reforms and stabilization policies adopted in the 1990s seem to be less important for the government that, as the data shows, has been growing its spending, being more flexible on inflation targeting and interfering directly in the economy. This goes against recommendations from some authors (Chen & Feng, 2000; Fraga, 2004) and the reports in chapter 2, that argue in favor of not only keeping the reforms but deepening them in order to achieve long term economic growth.
Figure 16 - Reforms and economic progress, virtuous cycle
Source: Havrylyshyn & Wolf, 1999
Figure 17 - Reforms and economic progress, vicious cycle
Source: Havrylyshyn & Wolf, 1999
7
Final Comments
The chosen subject is very complex, especially because of its contemporaneity, the Brazilian economy is currently standing on a turning point, growth prospects are diminishing as the study is being done. Having this is mind, it is useful to state the exploratory nature of this endeavor, more reflection is needed. As time passes, the advantage of hindsight will contribute to go further and see the degree to which the problems and limitations of the Brazilian economic structure can lead to lower growth and even stagnation.
It must be said that even if data to show the turning point was not present in chapter 1, the description of the Brazilian economy fundamentals in chapter 2 would be enough to realize that the country is unable to grow sustainably for a long time period. Brazil has suffered with economic populism (Fraga, 2004), politicians have focused on guaranteeing visible benefits to specific constituents before elections, disregarding wider long term effects that will impact microeconomic stability and even productivity.
In June 2013 Brazilians started massive protests, initially their claim was against increases in public transportation tariffs. As more people became aware and agreed with protesters, broader sections of the populations joined manifestations that asked for better public services and questioned widespread corruption and lack of respect and consideration for the tax payer citizen.
People don't go to the streets protest when they are satisfied with the current state of affairs, especially with such intensity that lead to the greatest manifestations in 20 years (Benson & Levine, 2013). The protests corroborate the hypothesis supported by this study, as long as the economy was growing Brazilians endured bravely and quietly the environment described in chapter 2, when the turning point began, the population went to street to show they were not happy with their country.
In this sense, Fraga (2004, p. 104) argues that the
"[...] causes for the rejection or continued acceptance of populism may include external factors, such as whether the world economy seems welcoming and expanding, or internal factors such as the competence or charisma (or lack thereof) of the particular group running the country at a given moment."
president lacks charisma and her cabinet members are not very popular either. Protests are a sign that Brazilians have woken up to the huge problems the country has and are rejecting measures that go against Brazilian development and welfare, such as economic populism.
8
References:
Averbug, A. (2002). The Brazilian Economy in 1994–1999: From the Real Plan to Inflation Targets. World Economy, 25(7), 925–944. doi:10.1111/1467-9701.00472
Banco Central do Brasil, Indicadores Econômicos Consolidados. available in: http://www.bcb.gov.br/?INDECO accessed on July 18th 2013
Baxter, M., & King, R. G. (1999). Measuring Business Cycles: Approximate Band-Pass Filters for Economic Time Series. The Review of Economics and Statistics, 81(4),
575–593. doi:10.2307/2646708
BBC. Brazil unrest: 'Million' join protesters in 100 cities. 21 June 2013. http://www.bbc.co.uk/news/world-latin-america-22992410 Accessed on July 26th 2013.
Beveridge, S., & Nelson, C. R. (1981). A new approach to decomposition of economic time series into permanent and transitory components with particular attention to measurement of the business cycle. Journal of Monetary Economics, 7(2), 151–
174. doi:10.1016/0304-3932(81)90040-4
Bittencourt, M. (2012). Financial development and economic growth in Latin America: Is Schumpeter right? Journal of Policy Modeling, 34(3), 341–355.
Brainard, L., & Martínez-Díaz, L. (2009). Brazil as an Economic Superpower?
Understanding Brazil’s Changing Role in the Global Economy. (L. Brainard & L.
Martínez-Díaz, Eds.) (p. 291). Washington, D.C.: Brookings Institution Press.
Brocchetto, M.; Chance, M. & Darlington, S. Brazilians protests surge again after bus fare victory. http://edition.cnn.com/2013/06/20/world/americas/brazil-protests July 26th 2013
Burns, A. F., Mitchell, W. C. (1946). Measuring business cycles. National Bureau of Economic Research.
Chen, B., & Feng, Y. (2000). Determinants of economic growth in China: Private
enterprise, education, and openness. China Economic Review (1043951X), 11(1),
1. Retrieved from
http://search.ebscohost.com/login.aspx?direct=true&db=buh&AN=3926622&lang= pt-br&site=bsi-live
Cruz, V. & D'Amorim, S. Bancos públicos já prevêem PIB abaixo de 2% este ano. 13/07/2013. http://www1.folha.uol.com.br/mercado/2013/07/1310634-bancos-publicos-ja-preveem-pib-abaixo-de-2-neste-ano.shtml Accessed on July 24th 2013.
Dorward, A. (2012). The short- and medium- term impacts of rises in staple food prices.
Fraga, A. (2004). Latin America since the 1990s: Rising from the Sickbed? The Journal of Economic Perspectives, 18(2), 89–106 CR – Copyright © 2004 American
Econom. doi:10.2307/3216892
Giles, J. A., & Williams, C. L. (2000). Export-led growth: a survey of the empirical literature and some non-causality results. Part 1. Journal of International Trade & Economic Development, 9(3), 261–337. Retrieved from
10.1080/09638190050086177
Harding, D., & Pagan, A. (2002). Dissecting the cycle: a methodological investigation.
Journal of Monetary Economics, 49(2), 365–381.
doi:http://dx.doi.org/10.1016/S0304-3932(01)00108-8
Havrylyshyn, O., & Wolf, T. (1999). Determinants of Growth in Transition Countries.
Finance and Development, 36(Number 2). Retrieved from
http://www.imf.org/external/pubs/ft/fandd/1999/06/havrylys.htm
Heritage Foundation. 2013 Index of Economic Freedom. Available in:
http://www.heritage.org/index/country/brazil. Accessed on: July 26th 2013.
Kaldor, N. (1971). Conflicts in National Economic Objectives. The Economic Journal, 81(321), 1–16 CR – Copyright © 1971 Royal Economic So.
doi:10.2307/2229754
Kondratieff, N. D., & Stolper, W. F. (1935). The Long Waves in Economic Life. The Review of Economics and Statistics, 17(6), 105–115 CR – Copyright © 1935
The MIT Press. doi:10.2307/1928486
Leahy, J. Brazil admits tight hold over exchange rate. October 24, 2012. Available
in:http://www.ft.com/cms/s/0/3185f656-1dfa-11e2-8e1d-0144feabdc0.html#axzz2YTEqNpPG. Accessed on July 21st 2013.
McQueen, G., & Thorley, S. (1993). Asymmetric business cycle turning points. Journal of Monetary Economics, 31(3), 341–362.
doi:http://dx.doi.org/10.1016/0304-3932(93)90052-H
Morley, J., & Piger, J. (2012). The Asymmetric Business Cycle. Cycle, 94(February),
208–221. doi:10.1162/REST_a_00169
Nassif, M. I. (2011). Exportações - O avanço das commodities. Revista Desafios do Desenvolvimento. Ano 8 . Edição 66 - 27/07/2011. Available in: http://www.ipea.gov.br/desafios/index.php?option=com_content&view=article&i d=2513catid=28&Itemid=23. Accessed on July 11th 2013.
Negri, F.; Alvarenga, G.V. A primarização da pauta de exportações no Brasil: ainda um dilema, Boletim Radar, IPEA, n. 13, p. 7-14, abril, 2011.
OECD. Stat Extracts. http://stats.oecd.org/Index.aspx?DatasetCode=MEI_PRICES Accessed on July 24th 2013.
Perry, W. (2000). Has the future arrived for Brazil? Orbis, 44(3), 399–415.
Roberts, J. M., Schreiber, M., & Scissors, D. (2012). Brazil: Restoring Economic Growth Through Economic Freedom (p. 16). Retrieved from
http://www.heritage.org/research/reports/2012/09/brazil-restoring-economic-growth-through-economic-freedom
Roett, R. (2012). The New Brazil (revised pa., p. 178). Washington, D.C.: Brookings
Institution Press.
Rohter, L. (2010). Brazil on the Rise: The Story of a Country Transformed (1st ed., p.
304). New York: Palgrave Macmillan.
Roxburgh, C., Lund, S., Wimmer, T., Amar, E., Atkins, C., Kwek, J.-H., … Manyika, J. (2010). Debt and deleveraging : The global credit bubble and its economic
consequences. McKinsey Global Institute, (January), 94. Retrieved from
http://www.mckinsey.com/insights/global_capital_markets/debt_and_deleveraging _the_global_credit_bubble_update
Sharma, R. (2012). Bearish on Brazil: The Commodity Slowdown and the End of the Magic Moment. Foreing Affaris, 91(3), 80–87. Retrieved from
http://www.foreignaffairs.com/articles/137599/ruchir-sharma/bearish-on-brazil
Taleb, N. N. (2007). The Black Swan: The Impact of the Highly Improbable (Random House, 2007). The Review of Austrian Economics (Vol. 21, pp. 361–364).
Random House. doi:10.1007/s11138-008-0051-7
The Economist. (2009). Brazil takes off (cover story). The Economist, 393(8657), 15.
The World Bank. Doing Business 2013, Economy Profile: Brazil. Available in:
http://www.doingbusiness.org/~/media/giawb/doing%20business/documents/profil es/country/BRA.pdf Accessed on: July 26th 2013.
World Economic Forum. The Global Competitiveness Report 2012–2013. Available in: http://www.weforum.org/reports/global-competitiveness-report-2012-2013