Management Allowed Depletion in Lower Indus Basin
KHALIFA QASIM LAGHARI* , BAKHSHAL KHAN LASHARI**, AND HAJI MAHMOOD MEMON***
RECEIVED ON 05.07.2010 ACCEPTED ON 04.10.2010
ABSTRACT
This paper deals with contemporary irrigation water management of major crops in Lower Indus Basin of Pakistan. Field experiments were conducted to estimate the optimum WUE (Water Use Efficiency) for various MAD (Management Allowed Depletion) levels including 55, 65 and 75% for cotton crop, and 45, 55 and 65% for wheat crop. The daily actual crop Etca (Evapotranspiration) was observed through gypsum blocks and a drainage Lysimeter. The observed seasonal cotton crops ET
ca in the experiments
were 486, 413, and 397 mm for 55, 65, and 75% MAD levels, respectively. Similarly, wheat crops ET
ca observed were 363, 359, and 332mm for 45, 55, and 65% MAD levels,
respectively. The WUE determined in terms of seed-cotton yield per unit of seasonal water use were 6.0, 6.5, and 5.8kg (ha mm)-1 The corresponding values of WUE for
wheat were 14.1, 15.0 and 13.4kg (ha mm)-1. Hence; the highest WUE was achieved
with MAD at 65% for cotton and at 55% for wheat.
Key Words: Irrigation Water Management, Water Use Efficiency, Indus Basin.
* Associate Professor, Department of Civil Engineering, Mehran University of Engineering & Technology, Jamshoro. ** Professor, Institute of Irrigation & Drainage Engineering, Mehran University of Engineering & Technology, Jamshoro. *** Professor Emeritus, Institute of Irrigation & Drainage Engineering, Mehran University of Engineering & Technology,
Jamshoro.
1.
INTRODUCTION
I
ncreasing crop production to meet food and fiber requirements of the world's population is putting pressure on global water resources. Total volume of water on the Earth is 1.4 billion km3; however, about 11millions km3 of this is freshwater, and generally accessible
[1]. Though there is no shortage of water on this planet but just there is a lack of accessibility to freshwater at some places [2]. With earth's available potential of freshwater, land, and human resources, it is quite possible to produce enough food for the future [3]. The vast freshwater resources available worldwide are still far away
from fully exploited. However, there are large areas where low water supply and high demand may lead to regional shortages of water for future food production. Irrigation is a major user of freshwater amongst various consumers of water. In arid and semi-arid areas, water is a major constraint for crop production, therefore, improving irrigation water management is crucial to meet food and fiber demands.
one-third of the available water. WUE can be improved through application of water saving techniques. The modernizations and optimization measures could be adopted to scientifically use of the available water. Particular attention is needed to adopt irrigation management practices, which give better economic return than the improvement of costly irrigation infrastructure. Adoption of scientific advancement in irrigation water management is the need of time to conserve irrigation water [4-5]. Irrigation scheduling should be designed considering that both the farmer and manager can easily apply in fields. The applicable irrigation scheduling strategies must be based on site's weather, crop, and soil conditions. Irrigation scheduling programmes must be vital enough to withstand physical uncertainties. Most collective irrigation systems are difficult but not impossible to adopt. Field experiments were conducted to estimate optimum WUE for various MAD levels of wheat and cotton crop. In each of these experiments, firstly, MAD levels were selected to confer optimal yield per unit of land and per unit water use, i.e. WUE, and secondly, to perceive how much water saving is achieved.
1.1
Importance of Water Use Efficiency
The WUE is a potential selection criterion for improving yield at appropriate MAD level to evaluate water application depth, and optimum level required by the crop. WUE is not simply a water saving irrigation but it is a comprehensive exercise using any possible water saving measures in field production, including full use of rainfall as well as efficient management of an irrigation network through a suitable planting method [6]. Irrigations should be timed to avoid water stress during periods of peak water use in booting, heading and flowering stages to achieve reasonably good yields and maximum irrigation WUE. Better irrigation WUE can be achieved through adopting the advanced irrigation water management practices.
2.
MATERIALS AND METHOD
Irrigation water is an important input for agriculture production which is properly measured as at least a two-dimensional variable; the total quantity and the seasonal distribution. Water supply for optimal production must be adjusted to the specific requirements of each growth period. This could be done by estimating root depth at different growth stages and applying water accordingly, which helps optimum utilization of available soil-moisture. Root activity is highest during developing stage and utilizes more available soil water. Eventually provides optimal yield and WUE.
2.1
Experimental Site
The experimental site is located (Landhi, Karachi) at a latitude of 24o 51'N, longitude of 67o 02'E, and an altitude
of 21m above sea level. The local climate varies and is generally considered as semi-arid to humid with an average annual rainfall of 210mm concentrated in monsoon season. At the site the wind direction changes in the Rabi season; it is moderate from north-west and north during the morning with a shift to high winds from south-west in the afternoon. In Kharif (summer) season high winds prevail from south-west.
2.2
Physical and Chemical Properties of the
Soil
The soil at the site is sandy loam. The physical and chemical properties of the soil were analyzed prior to the experiments in soil testing laboratory of DRC (Drainage and Reclamation Centre), Tandojam. Pressure plate extraction apparatus was used to determine θFC (Field Capacity) and θWP (Wilting Point) of the soil. The moisture content of the soil at field capacity was measured 23% with wilting point turned to be 10% [7].
2.3
Field Layout and the Crops Sowing
Patterns
The experimental area of 80m2 was divided into 3 plots
Lysimeter. Cotton usually stands for 150-180 and hot season crop of Kharif. The cotton (HF-100) was directly sown in the drainage Lysimeter and adjacent field area. In the experiments the cotton seeds at a rate of 32kg ha-1
were sown in field. The seeds were sown at a row spacing of 25cm with plant to plant spacing of 10cm [8]. The crop experiments for 55, 65, 75% MAD levels were conducted from May-October, 2004-2006.
The wheat variety watan was seeded in the Lysimeter and adjacent area at rate of 100 kg ha-1. The seed was sown at
a line spacing of 20cm in a leveled and pulverized soil bed. Seeds were sown at a 5m spacing and 5cm depth [9]. The basin irrigation method was adopted at the site during wheat experiments. In this region, wheat generally takes 100-130 days to mature and suits the prevailing climate in Rabi (November-March). The experiments were conducted from 1st December to 30th March (2004-2006).
2.3
Weather Data
Weather data were observed at the PMS (Pakistan Meteorological Station), Karachi, which is about 7km away from the field, and representative of the site environment. The rainfall (R), sunshine duration (n), temperatures (Tmax, Tmin and Tdew) and wind velocity (u2), were required on a daily basis. The Rainfall is also measured at the experimental site, almost similar amount were found.
2.4
Soil-Moisture Measurements
The undisturbed soil cores were excavated by a core sampler of known cylinder volume of 50 cm3, the centre of
each plots. The soil samples were collected at 0-15, 15-30, 30-45, 45-60, 60-90 and 90-120cm depth. The excavated cores were oven dried and weighed.
The gypsum blocks containing electrode, were installed after land preparation and before seeding. They were installed in auger holes drilled at 5, 15, 30, 45, 60, 90 and 120cm depth. The readings were taken by the gypsum
blocks' meter. The block readings were converted to a soil moisture content curve by calibration with gravimetric soil moisture percentage, multiplying with corresponding bulk densities to change to volumetric soil moisture percentages. Since, daily crop ET through drainage Lysimeters can not be measured; therefore, DP (Deep Percolated) water during consecutive irrigations (interval) was collected from a sump located at the bottom. Difference in quantity of the applied irrigation (I) and the DP water showed cumulative ET during the interval. The cumulative Lysimeter measured crop ET matched the collective ETca, obtained by measuring layer-wise soil-moisture content from the adjacent area (using Equation-1). The actual crop ETca of the wheat was observed through the Lysimeter, and layer-wise soil-moisture content measurements. The crop coefficient (Kca) was obtained by the ratio of ETca and ETo.
2.5
Crop Evapotranspiration
The daily measured soil-moisture content data have been used to determine actual crop ET by Equation (1), the actual crop water consumption is the algebraic sum of available water and the change in soil-moisture storage during the given time step.
ri Z mi θ 1 mi θ i DP w f i I i R cai ET ⎟ ⎠ ⎞ ⎜ ⎝ ⎛ − − + − + = (1)
Where ETcai is actual crop evapotranspiration at the end of dayi (mm), Ri is effective rainfall depth since dayi-1, which infiltrates in the soil (mm). Ii is net irrigation depth since dayi-1 (mm), fw is fraction of soil surface wetted by irrigation or rainfall, DPi is deep percolation θmi-1 is average volumetric soil-moisture content in the root zone at the end of dayi-1 (cm3 cm-3 i.e. fraction), θm
i is average
volumetric soil-moisture content in the root zone at the end of dayi (cm3 cm-3) (function) and Z
ri is depth of the
2.6
Reference Evapotranspiration
The modified Penman-Monteith equation has been calculating reference ETo.
⎥ ⎥ ⎦ ⎤ ⎢ ⎢ ⎣ ⎡ ⎥ ⎥ ⎦ ⎤ ⎢ ⎢ ⎣ ⎡ ⎥ ⎥ ⎦ ⎤ ⎢ ⎢ ⎣ ⎡ + + − + + − = 2 u 0.34 1 γ ∆ a e s e 2 u 273 T 900 γ G n R 0.408∆ o ET (2)
Where ETo is reference evapotranspiration (mm day-1), R n
is net radiation at the crop surface (MJ m-2 day-1), G is soil
heat flux density (MJ m-2 day-1), T is air temperature at 2m
height (°C), u2 is wind speed at 2m height (m s-1), e s is
saturation vapour pressure (kPa), ea is actual vapour pressure (kPa), es-ea is saturation vapour pressure deficit (kPa), ∆ is slope of vapour pressure curve (kPa °C-1), and
γ is psychrometric constant (kPa °C-1).
2.7
Crop Coefficient
Daily crop coefficient is the ratio of actual and reference evapotranspirations, and is given as:
oi ET cai ET cai K = (3)
The daily weather data have been used to estimate reference ETo. The collected field data was used to estimate precise amount and time of irrigation followed by water consumed by crop ETo. To design optimal irrigation schedules for cotton and wheat crops the
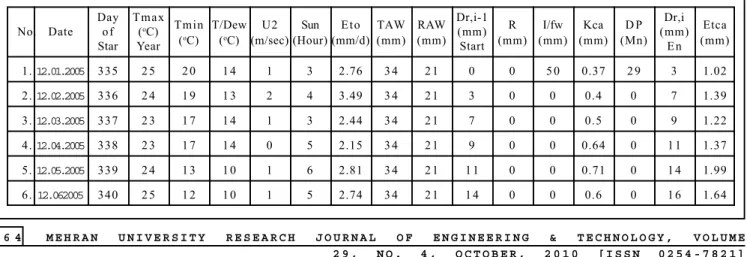
situation of seasonal soil-water depletion level was periodically checked to observe whether the irrigation schedule was suitable for better replenishment of the crops. The daily soil moisture depletion at the start and end of the day was also calculated by daily water balance methods. The root depth and pre-determined MAD was used to calculate TAW (Total Available Water) and RAW (Readily Available Water) to the crop. The crops' seasonal water consumptions were estimated and validated by comparing WUEs in regional and international studies. Real time spreadsheets were maintained as a checkbook balance. The sample of collected and processed data is shown in Table 1and Figs. 1-2.
3.
RESULTS AND DISCUSSION
3.1
Crop ET at 55% MAD Level
There were 11 soil-wetting events, comprised of 7 irrigations and 4 rainfalls for cotton crop experimented at 55% MAD level. The maximum ETca of 5 mm (day)-1
occurred twice during crop season crop in field (Fig. 3). This was the first blossom time of the cotton. Seasonal water consumption observed was 486mm, whereas total applied irrigation and rainfall water was 563mm. The high spikes and the sudden falls appeared in ETca dotted-line, because evaporation adds more in ET just after wetting event by irrigation or rainfall (Fig. 3). The second highest ET ranged between 4 and 5mm (day)-1 were observed
during 55-118th day and that was the second cotton flowering and open balls timing.
TABLE 1. DAILY DATA COLLECTION AND PROCESSING FOR WHEAT EXPERIMENT AT THE STUDY SIDE
Day T m a x
Tmin T/Dew U2 Sun E t o TAW RAW Dr,i-1 R I/fw Kca D P Dr,i Etca
No. Date o f (oC)
(oC) (oC) (m/sec) (Hour) (mm/d) (mm) (mm) (mm) (mm) (mm) (mm) (Mn) (mm) (mm)
Star Year Start E n
1.12.01.2005 335 2 5 2 0 1 4 1 3 2.76 3 4 2 1 0 0 5 0 0.37 2 9 3 1.02
2.12.02.2005 336 2 4 1 9 1 3 2 4 3.49 3 4 2 1 3 0 0 0.4 0 7 1.39
3.12.03.2005 337 2 3 1 7 1 4 1 3 2.44 3 4 2 1 7 0 0 0.5 0 9 1.22
4.12.04.2005 338 2 3 1 7 1 4 0 5 2.15 3 4 2 1 9 0 0 0.64 0 1 1 1.37
5.12.05.2005 339 2 4 1 3 1 0 1 6 2.81 3 4 2 1 1 1 0 0 0.71 0 1 4 1.99
3.2
Crop ET at 65% MAD Level
With 65% MAD level, the maximum ET of 5.8mm (day) -1was observed on 65th day of after sowing (Fig. 4). The
seasonal ET observed was 413mm, whereas the total irrigation and rainfall water used was 451mm.
3.3
Crop ET at 75% MAD Level
The maximum ET was 5.0mm (day)-1 and it was recorded
on 60th day after sowing (Fig. 5). The total seasonal crop water consumption was 397mm. Total irrigation water applied during entire season was 296mm while the effective rainfall recorded was occurred 146mm.
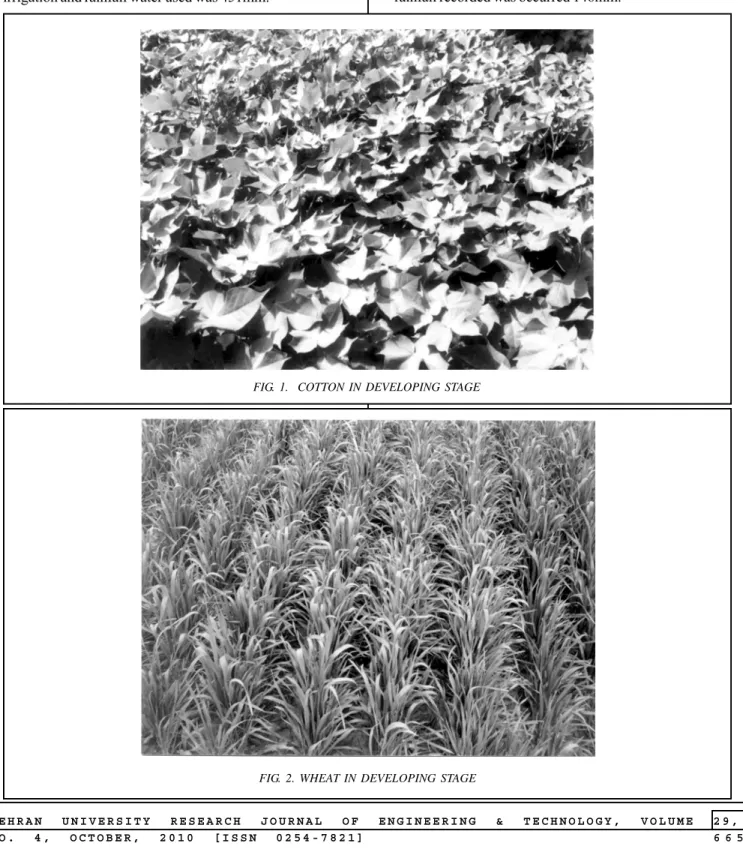
FIG. 1. COTTON IN DEVELOPING STAGE
3.4
Soils-Moisture Depletion and Irrigation
Scheduling
IS (Irrigation Scheduling) was based on the pre-determined depletion percentage of TAW on current root depth position, calculated on daily basis. The TAW was the
difference between the existing root zone water storage at field capacity and the permanent wilting point [8]. The RAW was calculated on daily basis by multiplying the selected MAD at a given time to TAW. At the initial stage, RAW was estimated to be 0.32m root depth and during
FIG. 3. DAILY OBSEVED ET OF COTTON AT 55% MAD LEVEL
FIG. 4. DAILY OBSEVED ET OF COTTON AT 65% MAD LEVEL
the developing stage it extended gradually and was taken to be maximum 1.0m. The MAD levels of 55, 65 and 75%
were set to compute RAW in the separate experiments and are shown in Table 2.
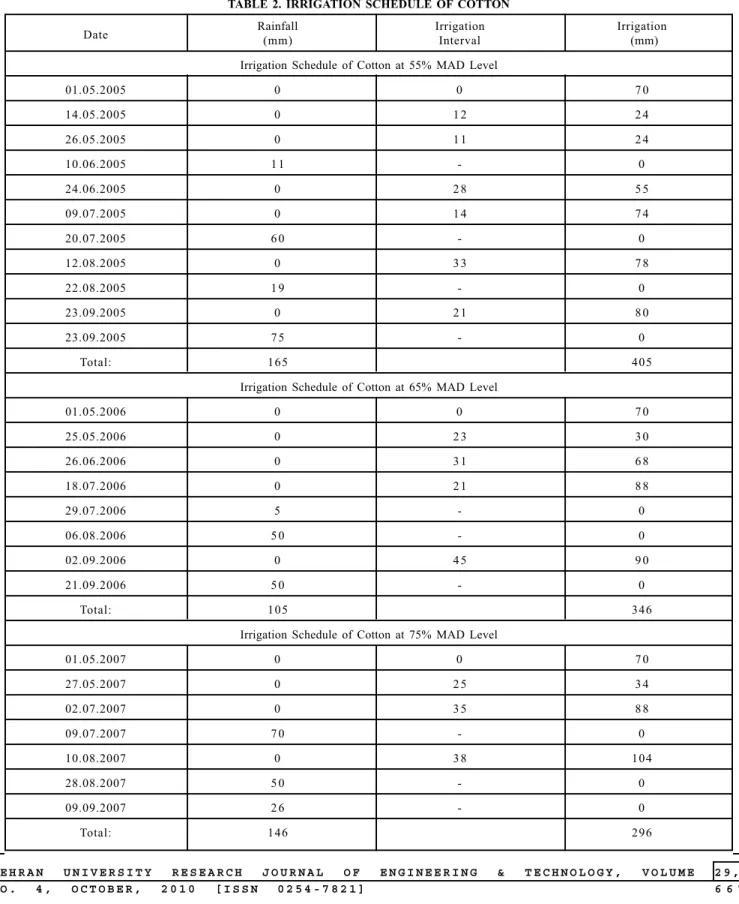
TABLE 2. IRRIGATION SCHEDULE OF COTTON
Date Rainfall(mm) IrrigationInterval Irrigation (mm)
Irrigation Schedule of Cotton at 55% MAD Level
01.05.2005 0 0 7 0
14.05.2005 0 1 2 2 4
26.05.2005 0 1 1 2 4
10.06.2005 1 1 - 0
24.06.2005 0 2 8 5 5
09.07.2005 0 1 4 7 4
20.07.2005 6 0 - 0
12.08.2005 0 3 3 7 8
22.08.2005 1 9 - 0
23.09.2005 0 2 1 8 0
23.09.2005 7 5 - 0
Total: 165 405
Irrigation Schedule of Cotton at 65% MAD Level
01.05.2006 0 0 7 0
25.05.2006 0 2 3 3 0
26.06.2006 0 3 1 6 8
18.07.2006 0 2 1 8 8
29.07.2006 5 - 0
06.08.2006 5 0 - 0
02.09.2006 0 4 5 9 0
21.09.2006 5 0 - 0
Total: 105 346
Irrigation Schedule of Cotton at 75% MAD Level
01.05.2007 0 0 7 0
27.05.2007 0 2 5 3 4
02.07.2007 0 3 5 8 8
09.07.2007 7 0 - 0
10.08.2007 0 3 8 104
28.08.2007 5 0 - 0
09.09.2007 2 6 - 0
3.5
Cotton Crop Water Use Efficiency
The crop WUE were estimated in terms of cotton-seed yield per unit of seasonal crop ET for the experiments with 55, 65, and 75% MAD levels. In this study, cotton-seed yields produced were 3024, 2776.5 and 2573 kg ha-1
with 35% lint, at 55, 65, and 75% MAD levels treatments respectively. The corresponding seasonal crop water consumptions (ETs) were 504, 422, and 404mm. The resulting WUEs obtained were 6.0, 6.5, and 5.8kg (ha mm)-1 respectively. It is apparent that highest WUE was
achieved in cotton at MAD 65% level.
Almost similar results were reported by PARC (Pakistan Agriculture Research Council) for cotton studies with 50% MAD level conducted at Tandojam, Bhalwal, Bhakkar and Mianchannu. The WUE (kg (ha mm)-1) of
2.58, 1.8, 4.56, 2.58 were obtained in these experiments respectively [8]. The low MAD level encourages water consumption through evaporation and transpiration but high MAD level decreases crop yield and consequently the WUE. Compared to inundation irrigation, the irrigation scheduling based on MAD level saved 15-32%
more water. The optimal level of MAD for cotton grown in sandy loam soil was indicated as 65%.
3.6
Wheat Crop Evapotranspiration and
Irrigation Scheduling
The seasonal ETca of wheat observed at 45, 55, and 65% MAD levels were 363, 359 and 332mm respectively. The daily estimated actual ETs in the experiments are functions of time are shown in Figs. 6-8. The Max ETca at 45% MAD was observed as 6.2mm day-1 on 102nd
day after sowing (Fig. 6). Similarly, the max ETca at 55% MAD was observed 6.1mm day-1 on 73rd after sowing
(Fig. 7). For 65% MAD, the maximum ETca turns to 8.1mm day-1 recorded on 104th day after sowing (Fig. 8).
The total 402, 370 and 362mm water (Irrigation and Rainfall) was used during full growing season of the wheat (Table 3).
4.
WATER USE EFFICIENCY OF
WHEAT CROP
The crop WUEs were estimated in terms of grain yield per unit of seasonal water used by crop ET for the experiments
at 45, 55 and 65% MAD levels; the corresponding values achieved were 14.1, 15.0 and 13.4 kg (ha mm)-1 respectively.
The grain yield of 5538.6 kg ha-1 and the straw yield of
12070.0 kg ha-1were obtained at 55% MAD. Comparing
inundation irrigation and that according to wheat crop water requirements, 25-35% of irrigation water saving was
achieved. Wheat grain WUE (kg (ha mm)-1) under
water-scarcity conditions was average recorded as 9.9 for south-eastern Australia, 9.80 for the China Loess Plateau, 8.90 for the northern Great Plains of North America, 7.60 for the Mediterranean Basin and 5.30 for the southern-central Great Plains have been reported by researchers [9-17].
FIG. 7. DAILY OBSEVED ET OF WHEAT AT 55% MAD LEVEL 55%
5.
CONCLUSIONS
The highest WUE of 15.00 kg (ha mm)-1 was achieved at
55% MAD level for wheat crop. This WUE seems good for crop as compared with that reported in regional and
international studies. A maximum WUE of 6.59 kg (ha mm) -1 was obtained at MAD 65% under the crop. Irrigation of
cotton with 65% MAD treatment offered significant benefits in terms of water saving over 55% MAD treatment, it resulted the highest WUE for seed-cotton production
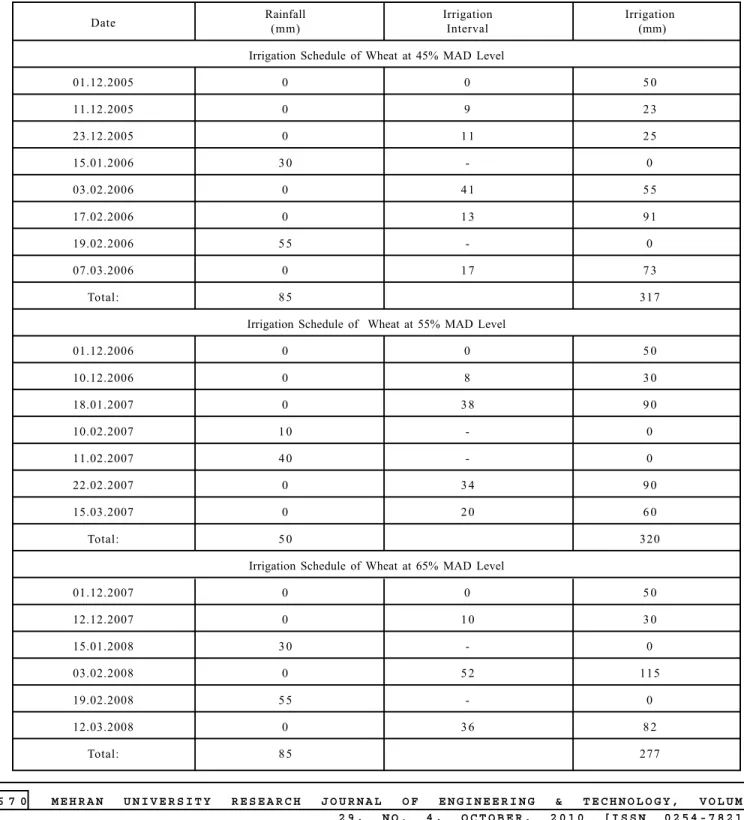
TABLE 3. IRRIGATION SCHEDULE OF WHEAT
Date Rainfall(mm) IrrigationInterval Irrigation (mm)
Irrigation Schedule of Wheat at 45% MAD Level
01.12.2005 0 0 5 0
11.12.2005 0 9 2 3
23.12.2005 0 1 1 2 5
15.01.2006 3 0 - 0
03.02.2006 0 4 1 5 5
17.02.2006 0 1 3 9 1
19.02.2006 5 5 - 0
07.03.2006 0 1 7 7 3
Total: 8 5 317
Irrigation Schedule of Wheat at 55% MAD Level
01.12.2006 0 0 5 0
10.12.2006 0 8 3 0
18.01.2007 0 3 8 9 0
10.02.2007 1 0 - 0
11.02.2007 4 0 - 0
22.02.2007 0 3 4 9 0
15.03.2007 0 2 0 6 0
Total: 5 0 320
Irrigation Schedule of Wheat at 65% MAD Level
01.12.2007 0 0 5 0
12.12.2007 0 1 0 3 0
15.01.2008 3 0 - 0
03.02.2008 0 5 2 115
19.02.2008 5 5 - 0
12.03.2008 0 3 6 8 2
over the 55 and 75% MAD levels, and reduced drainage, runoff, and short water stress on crop. Frequent watering enhanced the cotton crop growth in the initial stage but decreased in later stages, and hence affected the yield. Compared to usual inundation irrigation, each irrigation scheduling resulted in a saving between 25 and 35% of irrigation water in wheat, whereas the corresponding irrigation water savings in cotton were between 15 and 32%, respectively.
6.
RECOMMENDATIONS
The techniques are needed for determining crop water needs and appropriate irrigation scheduling for accurate quantification of ET. In order to obtain maximum crop WUE in water scarcity conditions, a total of 370mm water is recommended at 55% MAD level of TAW for the non-critical stages of wheat. The optimal yield and maximum cotton crop WUE could be achieved if recommended seasonal water amount of 450-550mm scheduled at 65% MAD level to be grown in Lower Indus Basin.
ACKNOWLEDEMENTS
The authors highly appreciate Mehran University of Engineering and Technology, Jamshoro, Pakistan, and WWF (World Wide Funds)-Pak, for their financial support during this study and construction of the field Lysimeter.
REFERENCES
[1] Maidment, D.R. (Editor), "Handbook of Hydrology",
McGraw Hill, New York, 1992.
[2] Wallace, J.S., and Batchelor, C.H., "Managing Water Resources for Crop Production", The Royal Society
Journal-B, Volume 352, pp. 937-947, UK, 2008.
[3] IWMI (International Water Management Institute),
"Water Management Urgent Need for More Food with Less Water", Spearheaded by International Water
Management Institute, Science Daily, Press Release,
USA, March 27, 2007.
[4] Westdyk, D., and Kröger, D.G., "Modeling
Evapotranspiration Effects on Air Flowing in a Small
Glass Roofed Tunne", Journal of Irrigation and Drainage
Engineering, Volume 136, No. 5, pp. 326-332, May,
2010.
[5] Burt, C.M., and Styles, S.W., "Modern Water Control
and Management Practices in Irrigation: Impact on
Performance", FAO Corporate Document Repository,
Rome, Italy, 2010.
[6] Bhattarai, S.P., "The Physiology of Water Use Efficiency
of Crops Subjected to Subsurface Drip Irrigation,
Oxygation and Salinity in a Heavy Clay Soil", Ph.D.
Thesis, School of Biology Environment Sciemce, Faculty
of Arts, Health & Science, Central Queensland University
Rockhampton, QLD 4702, Australia, 2005.
[7] Laghari, K.Q., "Perceptive Research on Irrigation
Scheduling and Water Management", Ph.D. Thesis,
Institute of Irrigation and Drainage Engineering, Mehran
University of Engineering & Technology, Sindh,
Pakistan, 2009.
[8] Laghari, K.Q., Lashari, B.K., Memon, H.M.,
"Computer-Based Irrigation Scheduling of Cotton Crop", Mehran
University Research Journal of Engineering &
Technology, [ISSN: 0254-7821], Volume 27, No. 3,
pp. 293-306, Sindh, Pakistan, July, 2008.
[9] Brown, P.D., Cochrane, T.A., and Krom, T.D., "Optimal
On-Farm Irrigation Scheduling with A Seasonal Water
Limit Using Simulated Annealing", Journal of Agricultural
Water Management, Volume 97, No. 6, pp. 892-900,
Netherlands, 2010.
[10] Baumhardt, R.L., Staggenborg, S.A., Gowdaa, P.H.,
Colaizzia, P.D., and Howell, T.A., "Modeling Irrigation
Management Strategies to Maximize Cotton Lint Yield
and Water Use Efficiency", Agronomy Journal (Online),
Volume 101, pp. 460-468, April, 2009.
[11] Dagdelen, N., Basal, H., Yilmaz, E., Gürbüz, T., and Akçay,
S., "Different Drip Irrigation Regimes Affect Cotton
Yield, Water Use Efficiency and Fiber Quality in Western
Turkey", Journal of Agricultural Water Management,
Volume 96, No. 1, pp. 111-120, Astrodome, Netherlands,
[12] David A.F., and Hugh, J.E., "Water-Use Efficiency is
Negatively Correlated with Leaf Epidermal Conductance
in Cotton (Gossypium spp.)", Journal of Crop Science
(Online), Volume 49, pp. 1409-1415, June, 2009.
[13] Richards, Q.D., Bange, M.P., and Johnston, S.B.,
"HydroLOGIC: An Irrigation Management System for
Australian Cotton", Journal of Agricultural Systems,
Volume 98, No. 1, pp. 40-49, Australia, 2008.
[14] Thind, H.S., Buttar, G.S., and Aujla, M.S., "Yield and
Water Use Efficiency of Wheat and Cotton under
Alternate Furrow and Check-Basin Irrigation with Canal
and Tube Well Water in Punjab, India", Journal of
Irrigation Science (Online), pp. 1432-1319, 2010.
[15] Allen, R.G., Pereira, L.S., Raes, D., and Smith, M., "Crop Evapotranspiration: Guideline for Computing Crop Water Requirements", Irrigation and Drainage Paper, United Nations Food and Agricultural Organization, FAO-56, ISBN: 92-5-104219-5, Rome, Italy, 1998. (http:// www.fao.org/docrep/X0490E/x0490e00.htm)
[16] Laghari, K.Q., Lashari, B.K., Memon, H.M., "Perceptive Research on Wheat Evapotranspiration in Pakistan", Journal of Irrigation and Drainage, Volume 57, pp. 571-584, UK, 2008. (Online Publication Available at: http:/ /www3.interscience.wiley.com/journal/119818480).