AMTD
5, 1101–1151, 2012Observing ice clouds in the submillimeter
spectral range
S. A. Buehler et al.
Title Page Abstract Introduction Conclusions References Tables Figures
◭ ◮
◭ ◮
Back Close Full Screen / Esc
Printer-friendly Version Interactive Discussion
Discussion
P
a
per
|
Dis
cussion
P
a
per
|
Discussion
P
a
per
|
Discussio
n
P
a
per
|
Atmos. Meas. Tech. Discuss., 5, 1101–1151, 2012 www.atmos-meas-tech-discuss.net/5/1101/2012/ doi:10.5194/amtd-5-1101-2012
© Author(s) 2012. CC Attribution 3.0 License.
Atmospheric Measurement Techniques Discussions
This discussion paper is/has been under review for the journal Atmospheric Measurement Techniques (AMT). Please refer to the corresponding final paper in AMT if available.
Observing ice clouds in the submillimeter
spectral range: the CloudIce Mission
proposal for ESA’s earth explorer 8
S. A. Buehler1, E. Defer2, F. Evans3, S. Eliasson1, J. Mendrok1, P. Eriksson4, C. Lee5, C. Jim ´enez2, C. Prigent2, S. Crewell6, Y. Kasai7, R. Bennartz8, and A. J. Gasiewski9
1
Division of Space Technology, Department of Computer Science, Electrical and Space Engineering, Lule ˚a University of Technology, Kiruna, Sweden
2
CNRS, Laboratoire d’Etudes du Rayonnement et de la Mati `ere en Astrophysique, Observatoire de Paris, Paris, France
3
Department of Atmospheric and Oceanic Sciences, University of Colorado, Boulder, USA
4
Department of Earth and Space Sciences, Chalmers University of Technology, Gothenburg, Sweden
5
Met Office, Exeter, UK
6
Institute for Geophysics and Meteorology, University of Cologne, Cologne, Germany
7
National Institute of Information and Communications Technology (NICT), Tokyo, Japan
8
Atmospheric and Oceanic Sciences, University of Wisconsin – Madison, USA
9
AMTD
5, 1101–1151, 2012Observing ice clouds in the submillimeter
spectral range
S. A. Buehler et al.
Title Page Abstract Introduction Conclusions References Tables Figures
◭ ◮
◭ ◮
Back Close Full Screen / Esc
Printer-friendly Version Interactive Discussion
Discussion
P
a
per
|
Dis
cussion
P
a
per
|
Discussion
P
a
per
|
Discussio
n
P
a
per
Received: 14 October 2011 – Accepted: 8 January 2012 – Published: 6 February 2012 Correspondence to: S. A. Buehler ([email protected])
AMTD
5, 1101–1151, 2012Observing ice clouds in the submillimeter
spectral range
S. A. Buehler et al.
Title Page Abstract Introduction Conclusions References Tables Figures
◭ ◮
◭ ◮
Back Close Full Screen / Esc
Printer-friendly Version Interactive Discussion
Discussion
P
a
per
|
Dis
cussion
P
a
per
|
Discussion
P
a
per
|
Discussio
n
P
a
per
|
Abstract
Passive submillimeter-wave sensors are a way to obtain urgently needed global data on ice clouds, particularly on the so far poorly characterized “essential climate vari-able” ice water path (IWP) and on ice particle size. CloudIce was a mission proposal to the European Space Agency ESA in response to the call for Earth Explorer 8 (EE8), 5
which ran in 2009/2010. It proposed a passive submillimeter-wave sensor with chan-nels ranging from 183 GHz to 664 GHz. The article describes the CloudIce mission proposal, with particular emphasis on describing the algorithms for the data-analysis of submillimeter-wave cloud ice data (retrieval algorithms) and demonstrating their ma-turity. It is shown that we have a robust understanding of the radiative properties of 10
cloud ice in the millimeter/submillimeter spectral range, and that we have a proven toolbox of retrieval algorithms to work with these data. Although the mission was not selected for EE8, the concept will be useful as a reference for other future mission proposals.
1 Introduction
15
Missing data on cloud ice water path (IWP) is a major gap in the current global climate observing system. To address this issue, the CloudIce mission proposal was presented to the European Space Agency ESA in the year 2010, in response to the call for Earth Explorer 8 (EE8). It proposed to measure properties of ice clouds, such as IWP, with a passive submillimeter-wave sensor with channels ranging from 183 GHz to 664 GHz. 20
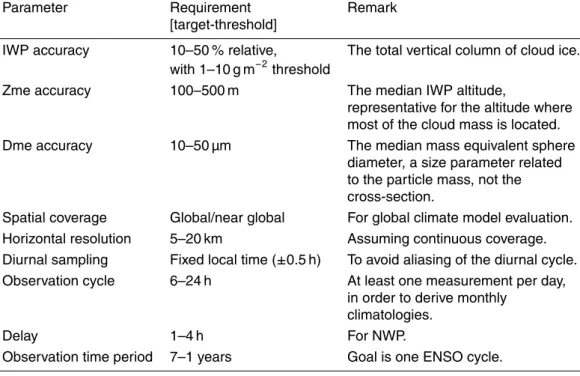
Some core parameters of the proposed mission and instrument are summarized in Table 1. The intention with this table is to give the reader that is already familiar with the subject a quick overview. The mission and instrument requirements are properly discussed later (in Sects. 2 and 3).
The proposal narrowly missed being selected for Phase A. Several related activ-25
AMTD
5, 1101–1151, 2012Observing ice clouds in the submillimeter
spectral range
S. A. Buehler et al.
Title Page Abstract Introduction Conclusions References Tables Figures
◭ ◮
◭ ◮
Back Close Full Screen / Esc
Printer-friendly Version Interactive Discussion
Discussion
P
a
per
|
Dis
cussion
P
a
per
|
Discussion
P
a
per
|
Discussio
n
P
a
per
instrument (ISMAR) at the Met Office (UK). Another example is the ICI candidate mission for MetOp-SG, which, as CloudIce, adopted many features from the general submillimeter-wave cloud ice mission concept documented in Buehler et al. (2007). Related missions are also under discussion in Japan and in the US.
For these ongoing activities, we perceive a need to document the scientific content 5
of the proposal in a form that is more openly accessible (and citable) than the proposal itself. This article attempts to satisfy that need. Its content is mainly from the EE8 proposal, but we have removed idiosyncrasies that were due to formal requirements from ESA. Furthermore, the content was restructured, and those parts that can already be found in the open literature were removed or drastically shortened.
10
The article is structured as follows: Sect. 2 introduces scientific objectives and re-quirements, followed by Sect. 3, which discusses observation technique and technical requirements. Section 4, the longest section, discusses the different CloudIce data products and their retrieval algorithms, including available demonstrations. Finally, Sect. 5 presents summary and conclusions.
15
2 Scientific objectives and requirements
2.1 Importance of cloud ice measurements
Clouds play a crucial role for the climate on planet Earth. They are also a major source of uncertainty in climate predictions, as affirmed by the most recent fourth assessment report by the Intergovernmental Panel on Climate Change IPCC (Solomon et al., 2007). 20
Particularly large uncertainties are associated with those clouds that consist partly or entirely of ice particles (e.g. Stephens et al., 1990; Wendisch et al., 2005; Penner, 2004). The microphysical formation mechanisms of cloud ice particles are less well un-derstood than those of liquid droplets. Also, ice particle shapes and physical properties vary widely, complicating their interaction with radiation.
AMTD
5, 1101–1151, 2012Observing ice clouds in the submillimeter
spectral range
S. A. Buehler et al.
Title Page Abstract Introduction Conclusions References Tables Figures
◭ ◮
◭ ◮
Back Close Full Screen / Esc
Printer-friendly Version Interactive Discussion
Discussion
P
a
per
|
Dis
cussion
P
a
per
|
Discussion
P
a
per
|
Discussio
n
P
a
per
|
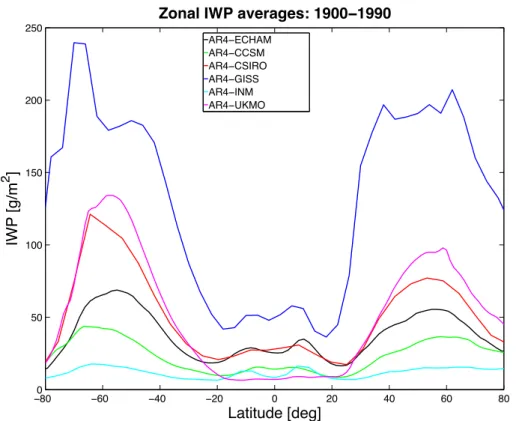
At the same time, there is a lack of reliable global measurements of cloud ice for climate model evaluation. As a consequence, different climate models exhibit large dis-crepancies in their cloud ice water content fields (Waliser et al., 2009, 2011; Eliasson et al., 2011). For example, as shown by Fig. 1, the annual zonal mean ice water col-umn at 60◦N ranges from approximately 15 to approximately 400 g m−2for the climate 5
models that participated in the fourth assessment of the IPCC. (Note that the curve for AR4-GISS was multiplied by 0.5 to fit all curves in a single plot, so the maximum value is almost twice as large as the range of the y-axis in the figure.)
The existing space-based measurement capabilities, mostly by infrared and visible instruments, provide important information on the radiation effect of ice clouds. How-10
ever, with the exception of radar measurements, which are discussed below, it is inher-ently difficult to relate these measurements to the bulk mass of ice, which is a basic climate model parameter, the parameter that can be linked to other stages of the water cycle by the requirement of total water mass continuity. We therefore argue that there is a particular need for cloud ice mass measurements.
15
The need for ice mass measurements is demonstrated for example by a recent study by Mitchell et al. (2008), who emphasize the importance of ice particle fall speed in global circulation model (GCM) simulations and conclude that, since fall speeds de-pend on particle mass and cross-sectional area, these properties must be better char-acterized for cirrus clouds.
20
This has also been recognized by the World Meteorological Organization (WMO), which classifies the total column of cloud ice (also called ice water path, IWP) as one of the essential climate variables (ECV) in the framework of the Global Climate Observing System (GCOS) (WMO, 2006).
Infrared measurements can provide IWP data and particle size information for rela-25
AMTD
5, 1101–1151, 2012Observing ice clouds in the submillimeter
spectral range
S. A. Buehler et al.
Title Page Abstract Introduction Conclusions References Tables Figures
◭ ◮
◭ ◮
Back Close Full Screen / Esc
Printer-friendly Version Interactive Discussion
Discussion
P
a
per
|
Dis
cussion
P
a
per
|
Discussion
P
a
per
|
Discussio
n
P
a
per
2.2 Advantages of submillimeter sensors
Active radar systems and passive millimeter/submillimeter instruments provide data that are directly related to the bulk mass of ice in an ice cloud. The two techniques are highly complementary. Radars, such as the CPR instruments of CloudSat and EarthCARE, provide high vertical resolution at the cost of poor horizontal coverage. 5
Their main measurement uncertainties for ice mass are connected to unavoidable as-sumptions on the particle size distribution, asas-sumptions on the radar signal attenuation in thicker clouds, and assumptions on the partitioning between liquid droplets and ice particles.
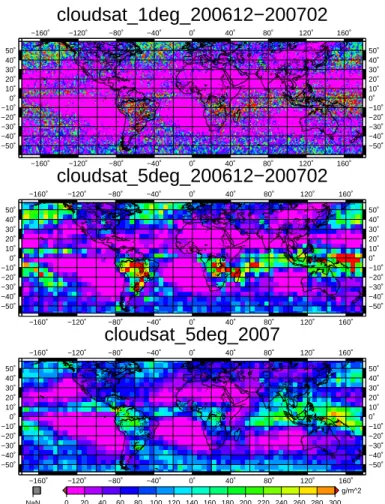
Figure 2 illustrates the horizontal coverage for radar data. It shows CloudSat IWP 10
climatologies for different time periods and grid resolutions. Quite long time periods and quite coarse grid resolutions are necessary to bring down the sampling error (the “noise” in the images) to an acceptable level. The reason for this is that the radar samples only directly below the satellite and does not do any horizontal scanning. Another way to express this is to note that CloudSat measurements cover an area of 15
roughly 12 km2s−1, whereas CloudIce measurements would cover an area of roughly 10 000 km2s−1.
Passive millimeter/submillimeter sensors can provide continuous near-global cover-age on a daily basis, at the cost of a poor vertical resolution. If suitable frequencies are chosen, these measurements sample different parts of the ice particle size spectrum. 20
The reason for this is that high frequencies interact more strongly with small parti-cles, whereas low frequencies interact more strongly with large particles (see Fig. 3 of Buehler et al., 2007). A combination of channels at different frequencies therefore allows an estimation of the particle size, and thus also a more accurate estimation of the total ice mass.
25
AMTD
5, 1101–1151, 2012Observing ice clouds in the submillimeter
spectral range
S. A. Buehler et al.
Title Page Abstract Introduction Conclusions References Tables Figures
◭ ◮
◭ ◮
Back Close Full Screen / Esc
Printer-friendly Version Interactive Discussion
Discussion
P
a
per
|
Dis
cussion
P
a
per
|
Discussion
P
a
per
|
Discussio
n
P
a
per
|
with near global spatial coverage every 24 h, and on a spatial scale consistent with future global climate models, to both evaluate and improve the models. It would also demonstrate the benefit of submillimeter observations for precipitation retrieval, an im-portant step towards a possible future deployment of submillimeter radiometers in a geostationary precipitation mission.
5
2.3 Scientific requirements
Scientific requirements for submillimeter-wave satellite observations of cloud ice were examined in the context of four recent ESA studies (Charlton et al., 2002; Golding and Atkinson, 2002; Sreerekha et al., 2006; Jarret et al., 2007). The last of these studies attempted a synthesis of all available earlier results. It is summarized in an article by 10
Buehler et al. (2007). Here we just briefly summarize this last assessment, and refer to the article for details.
The process of deriving scientific mission requirements involved several steps. As a first step, a table of pure scientific requirements for cloud ice observations was com-piled. Sources for this table were the CEOS/WMO requirement database (Hinsman, 15
2003), the earlier ESA studies, and an independent new requirement analysis struc-tured by parameter and application. Since cloud ice is currently not well covered by the global observing system, the range between threshold and target in the pure scientific requirement table is large for most parameters. The pure scientific requirement table is therefore not suitable for mission sizing.
20
In a second step, the concept of breakthrough ranges was used to narrow down the requirements from the pure science table. The breakthrough range is the sub-range between threshold and target in the pure scientific requirements where there is a particularly steep increase of benefit with increasing cost. It is therefore very suitable for mission sizing. The result of this analysis is summarized in Table 2.
25
AMTD
5, 1101–1151, 2012Observing ice clouds in the submillimeter
spectral range
S. A. Buehler et al.
Title Page Abstract Introduction Conclusions References Tables Figures
◭ ◮
◭ ◮
Back Close Full Screen / Esc
Printer-friendly Version Interactive Discussion
Discussion
P
a
per
|
Dis
cussion
P
a
per
|
Discussion
P
a
per
|
Discussio
n
P
a
per
The accuracy requirements for IWP, Zme, and Dme are influenced by the need for model evaluation, but also by comparison to existing sensors. The requirement for near global coverage comes from the need to evaluate and improve global circulation models. The horizontal resolution requirement comes from the typical resolution of mesoscale circulation models, an appropriate scale to represent clouds globally by the 5
time of the mission launch.
Concerning the local time of the measurements, two different scientific mission sce-narios are conceivable: (a) a mission focusing on obtaining global climatologies with good horizontal and temporal resolution, or (b) a mission focussing on diurnal cycles. The two scenarios exclude each other technically (not scientifically), because (a) calls 10
for a sun-synchronous orbit, whereas (b) calls for a non sun-synchronous orbit, where the local time drifts from overpass to overpass. The disadvantage of such an orbit is that larger averaging intervalls in time and space would be needed to derive climatolo-gies. For CloudIce, it was decided to concentrate on scenario (a).
The observation cycle requirement (once to several times per day) comes from the 15
need to derive monthly or seasonal climatologies with reasonable temporal sampling (the monthly mean value should be an average of individual measurements on many different days). The delay requirement comes from operational weather forecasting. Lastly, the observation time (mission lifetime) requirement comes from the need to observe several different annual cycles (preferably one entire ENSO cycle) in order to 20
capture at least some of the natural variability of the atmosphere.
Besides the scientific requirements for the CloudIce mission itself, there is a more general scientific requirement for an airborne companion instrument. In the mission preparation phase this would be used for algorithm development and test/validation. During the flight of CloudIce it would be used for validation. The airborne instrument 25
AMTD
5, 1101–1151, 2012Observing ice clouds in the submillimeter
spectral range
S. A. Buehler et al.
Title Page Abstract Introduction Conclusions References Tables Figures
◭ ◮
◭ ◮
Back Close Full Screen / Esc
Printer-friendly Version Interactive Discussion
Discussion
P
a
per
|
Dis
cussion
P
a
per
|
Discussion
P
a
per
|
Discussio
n
P
a
per
|
3 Observation technique and technical requirements
3.1 Observation technique
The use of passive submillimeter-wave measurements to retrieve cloud ice water con-tent and ice particle size was first suggested by Evans and Stephens (1995), and re-fined in subsequent publications (e.g. Evans et al., 1998). Specifically for CloudIce, the 5
technique and its scientific basis is described in detail in Buehler et al. (2007), therefore this information is not repeated here.
An new aspect for CloudIce, not mentioned in Buehler et al. (2007), is that measure-ments at sub-millimeter frequencies are not only sensitive to hydrometeors, but are also expected to be sensitive to volcanic “ash” particles to some extent. (Interest in this 10
was triggered by the eruption of volcano Eyjafjallaj ¨okull on Island in spring 2010, which injected a large amount of ash particles into the atmosphere.)
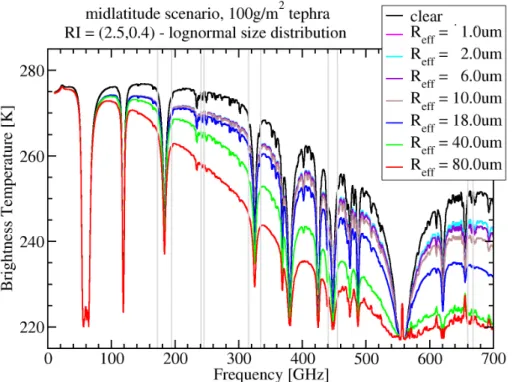
A quick sensitivity study was done to assess this. Figure 3 shows some results of this study. The main sources of uncertainty in these simulations are what shape, size distri-bution, and refractive index to assume for the volcanic particles. We assumed spherical 15
particles, with log-normal size distributions, and a refractive index of 2.5+0.4i. These are educated guesses, based on available literature, for example Manabe et al. (1992) and Bredow et al. (1995).
The study shows that, as expected, the submillimeter measurements would not be sensitive enough to detect the small ash concentrations far away from the source that 20
still pose an air traffic risk (below 1 g m−2). The strength of submillimeter measurements lies in the fact that they can penetrate the fresh ash plume close to the source (which will have comparatively large particles and a high mass content). This should allow an estimate of the amount of ash that is emitted. This idea has already been applied for SSM/I data by Delene et al. (1996) and is expected to work with higher accuracy for 25
AMTD
5, 1101–1151, 2012Observing ice clouds in the submillimeter
spectral range
S. A. Buehler et al.
Title Page Abstract Introduction Conclusions References Tables Figures
◭ ◮
◭ ◮
Back Close Full Screen / Esc
Printer-friendly Version Interactive Discussion
Discussion
P
a
per
|
Dis
cussion
P
a
per
|
Discussion
P
a
per
|
Discussio
n
P
a
per
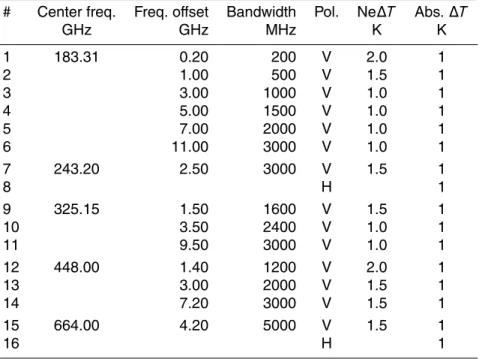
3.2 Channel positions and radiometric requirements
The channel configuration and noise characteristics of CloudIce are summarized in Ta-ble 3. An overview plot of where these channels are located, relative to the atmospheric spectrum, can be found in Buehler et al. (2007). Receivers are spread out over a wide frequency range in order to sample frequencies with different cloud particle single scat-5
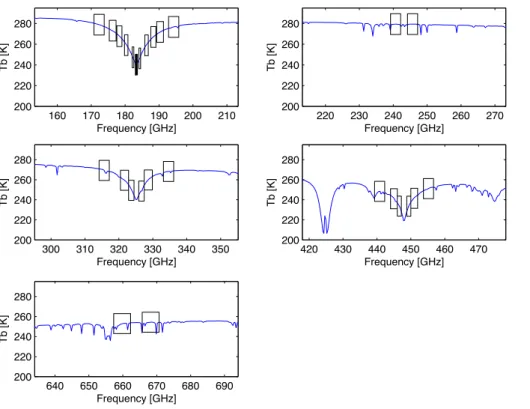
tering properties. Most receivers have multiple channels centered on a common water vapor absorption line. This is shown in Fig. 4. Note that, where possible, the channels are placed such that they avoid ozone spectral lines. This is in order to minimize the unwanted influence of the ozone concentration on the measured radiances. For the 183 GHz line it was already shown in John and Buehler (2004) that this influence is not 10
completely negligible.
Because of the varying distance from the line center, the different channels are as-sociated with different atmospheric opacities and sample different altitudes in the at-mosphere. A good way to visualize this is by calculating the clear-sky temperature Jacobians, as shown in Fig. 5. The peaks of the Jacobians indicate the sounding 15
altitude for the different channels.
Note that the sounding altitude depends on the atmospheric conditions. Figure 5 shows Jacobians for two opposite extremes, tropical conditions and subarctic-winter conditions. Whereas all channels are sounding channels (with almost no surface in-fluence) for tropical conditions, some channels see the surface for subarctic-winter 20
conditions. This is the case for the three outermost 183 GHz channels, for the channel at 243 GHz, and for the outermost 325 GHz channel.
These channel characteristics are largely as proposed in Buehler et al. (2007), with the following modifications: Firstly, the 183 GHz water vapor line, which was sampled with three channels in Buehler et al. (2007), is now sampled with six channels in order 25
AMTD
5, 1101–1151, 2012Observing ice clouds in the submillimeter
spectral range
S. A. Buehler et al.
Title Page Abstract Introduction Conclusions References Tables Figures
◭ ◮
◭ ◮
Back Close Full Screen / Esc
Printer-friendly Version Interactive Discussion
Discussion
P
a
per
|
Dis
cussion
P
a
per
|
Discussion
P
a
per
|
Discussio
n
P
a
per
|
Secondly, the receivers at 243 and 664 GHz are proposed to be polarized in order to gather information on cloud particle asphericity and orientation (Prigent et al., 2001, 2005; Miao et al., 2003; Eriksson et al., 2011b).
The single-polarization channels should all measure in V polarization. There are two reasons for this. Firstly, and most importantly, simulations show that there is less un-5
certainty due to ice particle shape in the V signal, compared to the H signal. Secondly, since the incidence angle of CloudIce is close to the Brewster angle for water, the V po-larization results in a “warm” radiative background even under those conditions where some channels start to see the surface. This increases the contrast between the warm background and the cold scattering signature.
10
The requirements for radiometric precision and absolute accuracy (in Table 3) reflect our expectation of what is technologically feasible. Roughly similar figures have been used as input to the retrieval simulations for channel selection, which are discussed in Buehler et al. (2007) and Jim ´enez et al. (2007). Radiometric noise is not very critical for CloudIce, since the cloud signal is strong. (This is in contrast to missions focused 15
on measuring humidity, such as AMSU, where the signal variation due to humidity fluctuations is ten times weaker.)
3.3 Other requirements
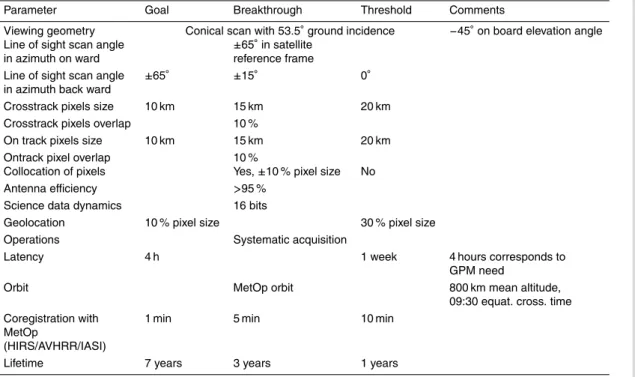
Other important requirements for CloudIce are summarized in Table 4. Below, we briefly comment on the most important requirements.
20
The viewing geometry of CloudIce is such that the instrument performs a conical scan (the viewing directions rotates around nadir with a fixed earth incidence angle). This requirement has two main reasons. Firstly, polarization is not consistent or very meaningful for a cross-track scan. Secondly, due to the three-dimensional structure of clouds, view angle biases for cloudy radiances are more difficult to correct than 25
AMTD
5, 1101–1151, 2012Observing ice clouds in the submillimeter
spectral range
S. A. Buehler et al.
Title Page Abstract Introduction Conclusions References Tables Figures
◭ ◮
◭ ◮
Back Close Full Screen / Esc
Printer-friendly Version Interactive Discussion
Discussion
P
a
per
|
Dis
cussion
P
a
per
|
Discussion
P
a
per
|
Discussio
n
P
a
per
The exact incidence angle is not very critical, 53.5◦ was chosen as a good com-promise between maximum sounding altitude range and maximum horizontal swath range. See Jarret et al. (2007) for a more detailed discussion.
Another viewing geometry parameter is the azimuth scan angle, which describes the part of the conical scan during which actual data collection happens. The azimuth 5
scan angle requirement of±65◦ ensures a broad swath in the forward direction. Side views are scientifically less useful and are therefore used for the radiometric calibration. Optionally one wants to have also an aft view, even if this is limited to a central part of the scan (±15◦). This would allow innovative experimental retrievals, exploiting either the stereo effect due to the nearly opposite azimuth angle, or exploiting the short time 10
difference (a few minutes) to study the temporal evolution of convective systems. Arguably the most important viewing geometry parameter is the spatial resolution. We are assuming spatially continuous sampling, so the spatial resolution is given by the footprint size (also called pixel size). A pixel size of of 10–15 km is consistent with the resolution of mesoscale circulation models and thus a good scale to study clouds. 15
However, even higher resolution would also give a clear science benefit, since clouds are a multi-scale phenomenon. The spatial resolution of the measurement drives the antenna size, and hence the overall mission mass and cost. The resolution proposed for CloudIce is therefore a compromise between the pure scientific requirements and the increasing cost with increased resolution. See Buehler et al. (2007) for a more 20
detailed discussion.
The next parameter to discuss here is the satellite orbit. The scientific requirement of near global coverage within 24 h, together with the requirement of constant local time (to avoid aliasing due to the diurnal cycle), imply a sun-synchronous orbit near 800 km orbit altitude. However, there is another crucial issue here, namely the requirement for 25
AMTD
5, 1101–1151, 2012Observing ice clouds in the submillimeter
spectral range
S. A. Buehler et al.
Title Page Abstract Introduction Conclusions References Tables Figures
◭ ◮
◭ ◮
Back Close Full Screen / Esc
Printer-friendly Version Interactive Discussion
Discussion
P
a
per
|
Dis
cussion
P
a
per
|
Discussion
P
a
per
|
Discussio
n
P
a
per
|
This requirement was in the proposal addressed by flying in formation with MetOp, which fixes all orbit parameters (altitude and local time of ascending node). The time difference requirement of 1–10 min to MetOp comes from the need to observe the same atmospheric state, together with the typical time scale of cloud evolution. Instead of MetOp, other operational meteorological satellites with a standard suite of infrared 5
instruments are also suitable as tandem partners.
Consistent with MetOp, it would be desirable for CloudIce to deliver data in near realtime (<4 h latency) to satisfy the needs of numerical weather forecasting. However, for the EE8 proposal this was not a strict requirement, since the mission was primarily intended as a science mission.
10
We conclude this section with a remark on the mission lifetime, namely, that the tech-nical requirement here follows directly from the scientific lifetime requirement (compare Table 2).
4 Data analysis
4.1 Geophysical variables and data products
15
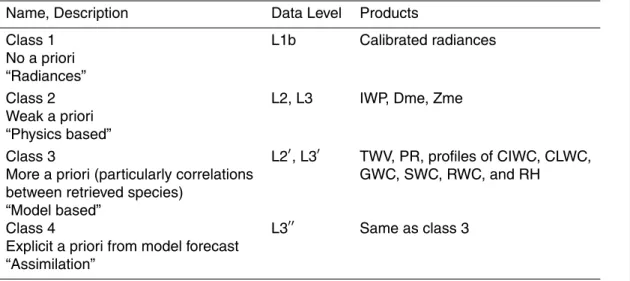
Figure 6 gives an overview of data levels and dependencies, Table 5 gives brief data product definitions. Submillimeter radiances contain information on the cloud ice water content, the ice particle size, their vertical distribution, and, with polarized measure-ments, their aspect ratio and orientation. As with any remote measurement, the infor-mation is indirect, and the retrieval underconstrained to different degrees, depending 20
on product. To account for this, we define a hierarchy of retrieval products, ordered by the amount of a priori information that is needed for the retrieval. Table 6 gives an overview of the different classes of data products. Note, that the concept of retrieval product classes is different from the concept of data levels: L3 data are normally de-rived from L2 data, but class 3 products are not dede-rived from class 2 products. Table 6 25
AMTD
5, 1101–1151, 2012Observing ice clouds in the submillimeter
spectral range
S. A. Buehler et al.
Title Page Abstract Introduction Conclusions References Tables Figures
◭ ◮
◭ ◮
Back Close Full Screen / Esc
Printer-friendly Version Interactive Discussion
Discussion
P
a
per
|
Dis
cussion
P
a
per
|
Discussion
P
a
per
|
Discussio
n
P
a
per
Class 1products are simply calibrated radiances (data level L1b), in units of Planck
brightness temperatures. They require no a priori information. These data are valuable for the interpretation of the radiometric signal relative to the sampled atmosphere (in the presence of cloud and precipitation), for assimilation into circulation models, and for cloud/radiative transfer model evaluation. Recent examples for the direct use of radi-5
ances for scientific studies are Nesbitt and Zipser (2003) and Prigent et al. (2005). The CloudIce science team would provide a forward operator (a radiative transfer model), which is essential for the use of these data.
Calibrated radiances would also be useful as input to advanced multi-sensor retrieval algorithms that combine collocated data from different instruments and missions. A 10
good example for such an approach is the combined radar, lidar, and infrared radiome-ter data product DARDAR by Delano ¨e and Hogan (2008). The most obvious comple-mentary data to CloudIce would be infrared radiances, both due to their availability, and because retrieval simulations (e.g. Jim ´enez et al., 2007) show that they improve the IWP retrieval from submillimeter radiances.
15
Class 2 products are the relatively simple parameters IWP, Dme, and Zme (see
Table 5 for definitions and units). The data level of these products is L2 (for instrument fields of view) and L3 (gridded). These products are still “close” to the measurement in the sense that they require only weak a priori information, in the form of assumptions on the statistics of cloud vertical structure and microphysics. Products would be obtained 20
by a retrieval scheme, based on standard mapping and regression techniques, such as neural networks or Bayesian Monte Carlo integration. Class 2 products are the core parameters of the CloudIce mission.
It should be noted that for clear-sky scenes the mission would also provide high quality upper tropospheric humidity (UTH) data, with the same retrieval approach as 25
described for example in Buehler et al. (2008) and Buehler and John (2005). But for the EE8 proposal it was decided to not use that capability for mission sizing.
Class 3 provides a richer set of hydrological parameters, namely profiles of five
AMTD
5, 1101–1151, 2012Observing ice clouds in the submillimeter
spectral range
S. A. Buehler et al.
Title Page Abstract Introduction Conclusions References Tables Figures
◭ ◮
◭ ◮
Back Close Full Screen / Esc
Printer-friendly Version Interactive Discussion
Discussion
P
a
per
|
Dis
cussion
P
a
per
|
Discussion
P
a
per
|
Discussio
n
P
a
per
|
(CLWC), graupel (GWC), snow (SWC), rain (RWC), and relative humidity (RH). Addi-tionally, class 3 provides total column water vapor (TWV) and the precipitation rate at the surface (PR). See Table 5 for definitions and units of the different parameters. As for class 2, these products are derived from the L1b data, so we call the data levels for class 3 L2′, and for gridded data L3′.
5
Whereas class 2 data are relatively “close” to the measurement, class 3 data are “close” to atmospheric models. A mesoscale circulation model is used to generate the training data, and the retrieved parameters are those that represent humidity, clouds, and precipitation in the model. The training data thus contain implicit information on the correlation of the different hydrometeor species according to the model. This allows the 10
retrieval of parameters that are measured indirectly, such as the precipitation rate. This works well, since the physical mechanism for generating many types of precipitation is through the ice phase, and hence the precipitation rate is strongly correlated with the amount of cloud ice. The retrieval algorithm itself is similar to class 2 (a neural network).
15
In contrast to class 2, class 3 data depend on the cloud model that is used for training the algorithm. They are thus not the best suited data class to evaluate other models (there class 1 is best). But class 3 provides a complete picture of the hydrological state and would be very useful for case studies.
Class 4products result from assimilating L1b radiances into an atmospheric
circula-20
tion model. We assign data level L3′′ to them. There is no data level L2′′, since L3′′ is generated directly from L1b. For class 4, a mesoscale circulation model is used not only for training data generation, as for class 3, but explicitly in the assimilation process. The a priori information for the derived products is the model forecast. The variables considered are the same as for class 3. Class 4 would give the best estimate of the 25
AMTD
5, 1101–1151, 2012Observing ice clouds in the submillimeter
spectral range
S. A. Buehler et al.
Title Page Abstract Introduction Conclusions References Tables Figures
◭ ◮
◭ ◮
Back Close Full Screen / Esc
Printer-friendly Version Interactive Discussion
Discussion
P
a
per
|
Dis
cussion
P
a
per
|
Discussion
P
a
per
|
Discussio
n
P
a
per
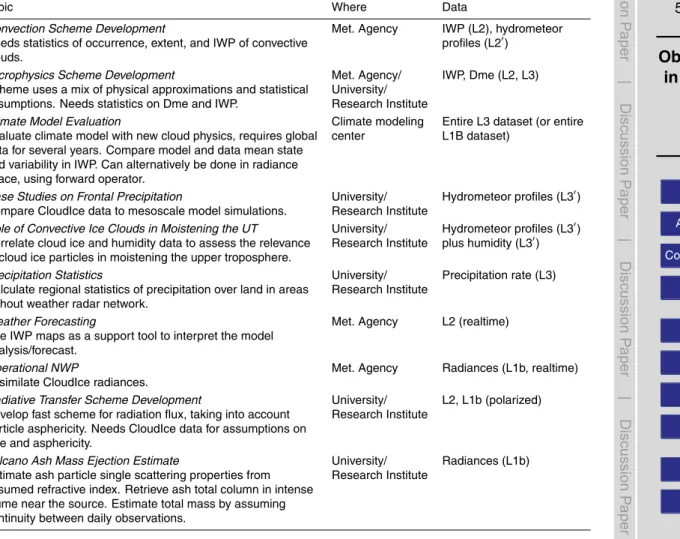
Table 7 lists some examples how CloudIce data might be used in practice. These are intended as illustrative examples, not as an exhaustive list.
4.2 Retrieval algorithms
In this section we briefly describe the retrieval approach for the different product classes and note their algorithm development status.
5
4.2.1 Class 1 “radiances”
Approach: Instrument counts have to be properly calibrated to radiances in units of
Planck brightness temperature, using the cold-space and internal hot load calibration measurements that are performed in each scan cycle (L0 to L1b processing). The procedure would be similar to the one for existing operational instruments of the AMSU-10
B/MHS family, as described for example in Lambrigtsen (2003). Data quality control would also be an important activity for this class. Beyond that, class 1 does not require a retrieval algorithm, but it requires that data users be provided with a forward operator in the form of a fast radiative transfer (RT) computer program. The program should allow modelers an easy adaptation to the cloud microphysical assumptions of their 15
specific model. This also requires an accurate reference RT program, for development and validation of the fast program.
Status: The L0 to L1b data processing and quality control are straightforward,
us-ing established procedures. Concernus-ing the forward operator, the public domain RT code ARTS (Eriksson et al., 2011a; Buehler et al., 2005) is available as reference RT 20
code for CloudIce. It was developed to handle all aspects of submillimeter cloud ice observations. The development was partially funded by ESA in a study reported by Sreerekha et al. (2006). ARTS simulates the full Stokes vector, so it is applicable for polarized measurements. Also, it includes two different algorithms to simulate scatter-ing by cloud particles (Emde et al., 2004; Davis et al., 2005).
AMTD
5, 1101–1151, 2012Observing ice clouds in the submillimeter
spectral range
S. A. Buehler et al.
Title Page Abstract Introduction Conclusions References Tables Figures
◭ ◮
◭ ◮
Back Close Full Screen / Esc
Printer-friendly Version Interactive Discussion
Discussion
P
a
per
|
Dis
cussion
P
a
per
|
Discussion
P
a
per
|
Discussio
n
P
a
per
|
The latter algorithm allows full three-dimensional (3-D) simulations. In Davis et al. (2007) it was shown that true 3-D effects from the RT itself are small for this viewing geometry, but that “beam-filling” effects due to scene inhomogeneity are significant. The 3-D model setup has the advantage that those effects can be treated more easily than in a 1-D model.
5
Scattering RT simulations require single scattering data. Different options are avail-able here, used so far by the CloudIce community was either the T-matrix method (Mishchenko and Travis, 1998), or the single scattering database by Hong et al. (2009), which was computed with the discrete dipole approximation.
Further to the scattering algorithm development, recent other developments (Buehler 10
et al., 2011, 2010) allow that ARTS is also used for RT simulations in the infrared, which is important for joint retrievals from submillimeter and collocated IR data.
There is not yet a fast RT model for CloudIce. The best option would be to im-plement this as part of the RTTOV (Saunders et al., 1999) model, which provides fast forward operators for all operational meteorological missions. Since the current version 15
of RTTOV already includes scattering, the implementation of the CloudIce channels is expected to be fairly straightforward, since the reference model is readily available. It was already shown in Buehler et al. (2006) that for the clear-sky case ARTS and RTTOV are in good agreement.
4.2.2 Class 2 “physics based”
20
Approach: The retrieval approach for class 2 products consists of two distinct steps.
Firstly, creating an atmospheric profile database with realistic statistics of temperature, water vapor, cloud profiles, and cloud microphysics (size, shape, and orientation distri-butions), based on in-situ and remote measurements. Secondly, using this database to approximate the a posteriori distribution of the atmospheric state, given the obser-25
AMTD
5, 1101–1151, 2012Observing ice clouds in the submillimeter
spectral range
S. A. Buehler et al.
Title Page Abstract Introduction Conclusions References Tables Figures
◭ ◮
◭ ◮
Back Close Full Screen / Esc
Printer-friendly Version Interactive Discussion
Discussion
P
a
per
|
Dis
cussion
P
a
per
|
Discussion
P
a
per
|
Discussio
n
P
a
per
integration and neural networks. The former is conceptually simpler and automatically provides an estimate of the retrieval error. The latter is computationally more efficient, but the derivation of retrieval errors is less straightforward. These two methods are described well in Rydberg et al. (2009).
Status: Extensive retrieval simulations with different submillimeter channel
combina-5
tions and different training databases have been carried out in the ESA study reported by Jarret et al. (2007). These results have also been published in Jim ´enez et al. (2007), which deals with the retrieval simulations themselves, and in Buehler et al. (2007), which deals with the overall instrument and mission concept.
4.2.3 Class 3 “model based”
10
Approach: The approach for class 3 data is similar to class 2, but the source of the
training data is a mesoscale circulation model, instead of measured data. The re-trieved parameters are the different microphysics species and state parameters of the model. The approach is therefore model dependent, but the validity of the model can be checked by comparing its outputs to concurrent ground-based and space-based 15
observations.
Status: Retrieval simulations for class 3 products have been carried out and are
described in Sect. 4.3.
4.2.4 Class 4 “assimilated”
Approach: The approach for class 4 data is direct assimilation of the CloudIce L1b
20
radiances into a mesoscale circulation model. Status: Already today, weather centers such as ECMWF operationally assimilate cloud and precipitation-affected radiances from microwave imagers (Bauer et al., 2006a,b). There has been rapid development in this area in recent years, and it is reasonable to assume that in the foreseeable future also high frequency imager data can be treated in the same way.
AMTD
5, 1101–1151, 2012Observing ice clouds in the submillimeter
spectral range
S. A. Buehler et al.
Title Page Abstract Introduction Conclusions References Tables Figures
◭ ◮
◭ ◮
Back Close Full Screen / Esc
Printer-friendly Version Interactive Discussion
Discussion
P
a
per
|
Dis
cussion
P
a
per
|
Discussion
P
a
per
|
Discussio
n
P
a
per
|
4.3 Retrieval demonstrations
4.3.1 Class 2 products retrieval simulation study
Detailed retrieval simulations of the class 2 products IWP, Dme, and Zme were carried out in a recent ESA study (Jarret et al., 2007). Different channel combinations were investigated, in order to determine an optimum instrument configuration. The retrieval 5
algorithm was as outlined in Sect. 4.2. The setup is described in detail in Jim ´enez et al. (2007).
As explained in Sect. 4.2, the retrieval algorithm needs training data, consisting of simulated radiances for a diverse atmospheric state dataset. Two different diverse datasets have been developed. D1, developed by Evans et al. (2005), uses randomly 10
generated profiles and microphysics. Statistics for the vertical structure are taken from radiosondes and statistics for the microphysics are taken from aircraft campaigns. D2, developed by Rydberg et al. (2007), uses cloud radar data for the vertical structure, and combines them with randomly generated microphysics. As for D1, microphysics statistics are taken from aircraft campaigns.
15
The retrieval simulations in Jim ´enez et al. (2007) used both datasets, D1 and D2, but in both cases versions that were generated specifically for that study, so dataset versions are not identical to the versions used in the two papers that are cited in the previous paragraph. But the method of generating the data is in both cases as de-scribed in the articles.
20
Having different databases available is crucial to test the dependence of the retrieved products on the a priori assumptions. Results in Jim ´enez et al. (2007), where inver-sions using D1 and D2 were compared, showed consistency between both derived IWPs.
Figure 11 in Buehler et al. (2007) shows the expected retrieval performance for IWP, 25
AMTD
5, 1101–1151, 2012Observing ice clouds in the submillimeter
spectral range
S. A. Buehler et al.
Title Page Abstract Introduction Conclusions References Tables Figures
◭ ◮
◭ ◮
Back Close Full Screen / Esc
Printer-friendly Version Interactive Discussion
Discussion
P
a
per
|
Dis
cussion
P
a
per
|
Discussion
P
a
per
|
Discussio
n
P
a
per
4.3.2 Class 3 products retrieval simulation study
Radiative transfer simulations have been performed with the help of an RT model based on realistic atmospheric/microphysics profiles derived from the MESO-NH cloud-resolving model in an ESA study (Zanif ´e et al., 2007). The RT simulations are in good agreement with coincident AMSU and SSM/I observations (Chaboureau et al., 5
2008; Meirold-Mautner, 2007). The neural network retrieval scheme is built from a syn-thetic database composed of realistic atmospheric/microphysics profiles derived from the cloud-resolving model and concurrent simulated brightness temperatures for sea and land separately (Defer et al., 2008) and for different atmospheres (Charlton et al., 2010).
10
The database was used to explore the information contents that can be derived from submillimeter observations (Zanif ´e et al., 2007; Mech, 2007) and to confirm the pertinence of submillimeter radiometry in quantifying precipitation (Zanif ´e et al., 2007; Defer et al., 2008). The same method was recently applied in an ESA study to assess the performance of an airborne demonstrator at mid-latitude and tropical atmospheres 15
(Charlton et al., 2010).
Figure 7 demonstrates the capability of CloudIce to retrieve hydrometeor vertical profiles. The hydrometeor species retrieved are the five species of MESO-NH: cloud ice, graupel, snow, rain, and cloud liquid. (In Tables 5 and 6 these products are labeled CIWC, GWC, SWC, RWC, and CLWC, respectively.) The microphysical properties of 20
the different species are summarized in Table 3 of Chaboureau et al. (2008).
Preliminary retrieval schemes, over sea and land separately, were applied to derive hydrometeor profiles from simulated noisy brightness temperatures. The retrieved hy-drometeor profiles are then compared to the original profiles. As shown in the figure, cloud regions with significant ice content are well-captured and similar vertical cloud 25
structures can be found in the retrieved transect relative to the original one.
AMTD
5, 1101–1151, 2012Observing ice clouds in the submillimeter
spectral range
S. A. Buehler et al.
Title Page Abstract Introduction Conclusions References Tables Figures
◭ ◮
◭ ◮
Back Close Full Screen / Esc
Printer-friendly Version Interactive Discussion
Discussion
P
a
per
|
Dis
cussion
P
a
per
|
Discussion
P
a
per
|
Discussio
n
P
a
per
|
is predominantly sensitive to cloud ice particles, and precipitation detection and quantification mainly relies on the correlation of precipitation with the ice particles above. The retrieval error for the precipitation rate was evaluated, using the micro-physics/brightness temperature database. Table 8 shows that the CloudIce radiometer could provide precipitation rate above 10 mm h−1 with an error range of 30 to 60 %. 5
Comparing this to the recent EUMETSAT Position Paper (Rizzi et al., 2006) reveals that the performance is near the breakthrough level for global and regional NWP appli-cations, but poorer than the threshold level for hydrology applications.
4.3.3 Aircraft data
Aircraft instruments play a key role for retrieval algorithm validation and fine-tuning. 10
Furthermore, they allow exciting scientific studies in their own right. For both applica-tions it is crucial that these instruments are deployed within coordinated campaigns, so that complementary data from other sensors are available. The CloudIce scientific community will soon be able to use three such instruments, as summarized in Table 9. We will here focus on the results from only one of these instruments, CoSSIR.
15
The Compact Scanning Submillimeter-wave Imaging Radiometer (CoSSIR, Col-umn 2 in Table 9) was built at the NASA Goddard Spaceflight Center. During the Tropical Composition, Cloud, and Climate Coupling (TC4) field campaign (Toon et al., 2010) in July and August 2007 CoSSIR flew on the NASA ER-2. For that deployment CoSSIR had 11 channels with receivers at 183, 220, 380, 640, and 874 GHz, and dual 20
polarization at 640 GHz, all with 4◦ beam widths. CoSSIR performed forward and aft conical scans at 53◦plus two quick scans through nadir in each 10 second scan cycle. Figure 8a shows the forward conical scan brightness temperatures from part of one flight during TC4. The higher frequencies (640 and 874 GHz) are seen to be more sensitive than the lower frequencies (183 and 220 GHz) to the smaller ice particles in 25
AMTD
5, 1101–1151, 2012Observing ice clouds in the submillimeter
spectral range
S. A. Buehler et al.
Title Page Abstract Introduction Conclusions References Tables Figures
◭ ◮
◭ ◮
Back Close Full Screen / Esc
Printer-friendly Version Interactive Discussion
Discussion
P
a
per
|
Dis
cussion
P
a
per
|
Discussion
P
a
per
|
Discussio
n
P
a
per
information with only the highest altitude ice cloud features appearing in the channels with the highest altitude weighting functions. Small differences between the 640H and 640V channels are apparent.
Submillimeter-wave brightness temperature polarization differences are indicative of higher aspect ratio ice particles (such as columns or plates) being horizontally aligned 5
(e.g. Evans et al., 1998). Figure 8b shows a retrieved polarization index, which is de-fined as the difference between V and H polarization, normalized by the cloud signal. In anvil regions, this index has values from 0.15 to 0.25, indicating oriented ice crys-tals. The convective core, on the other hand, has low polarization index, presumably indicating quasi-spherical tumbling ice particles, such as graupel.
10
Retrievals of IWP and Dme were performed with a Bayesian Monte Carlo integration algorithm described in Evans et al. (2005). A priori information is represented by a dataset of profiles of atmospheric and ice cloud properties generated from statistics relating temperature, IWC, and Dme (from in situ microphysical probes), and statistics of temperature and relative humidity (from TC4 radiosondes). The dataset contains 15
106 cases. One difference of these retrievals from Evans et al. (2005) is that the Bayesian integration is done with ln(IWP) and ln(Dme). Figure 8c and d shows the retrieved IWP and Dme with the uncertainty range. There was no way to directly vali-date IWP during TC4, but an indirect validation was made by comparison to the nadir viewing 94 GHz Cloud Radar System. CoSSIR nadir viewing brightness temperatures 20
are used to retrieve vertically integrated 94 GHz backscattering, which is compared to the integral of the measured radar reflectivity profile. Figure 9 shows good agree-ment, usually comparable to the retrieved error bars, in integrated radar backscatter over a large range. This good agreement lends confidence to the submillimeter-wave retrievals of IWP and Dme.
25
AMTD
5, 1101–1151, 2012Observing ice clouds in the submillimeter
spectral range
S. A. Buehler et al.
Title Page Abstract Introduction Conclusions References Tables Figures
◭ ◮
◭ ◮
Back Close Full Screen / Esc
Printer-friendly Version Interactive Discussion
Discussion
P
a
per
|
Dis
cussion
P
a
per
|
Discussion
P
a
per
|
Discussio
n
P
a
per
|
dual polarization at 640 GHz, and a channel at 874 GHz. Test flights of the new CoS-SIR configuration over clear skies in August 2009 were successful, with good noise performance for the new 325 and 448 GHz receivers.
A new aircraft instrument, ISMAR (International SubMillimetre Airborne Radiome-ter), is being developed which includes the key frequencies identified in Charlton et al. 5
(2010) for both cirrus and precipitation measurements. It has been designed to be modular such that channels up to 874 GHz can be added in stages, some of which are funded by Met Office (UK) and ESA. The instrument has been certified to oper-ate on the BAe 146-301 FAAM aircraft, which has a range of auxiliary instrumentation from microwave radiometers (MARSS and Deimos) to infrared and visible spectrome-10
ters, as well as in-situ cloud physics measurements. The full range of microwave and submillimetre channels planned are shown in Table 9.
ISMAR will be used as a satellite demonstrator, for scientific application and ulti-mately cal/val once a submillimeter satellite is launched. Scientifically ISMAR will be used in aircraft field campaigns to improve and test radiative transfer algorithms, per-15
form submillimeter radiation and cloud microphysics closure, measure surface emis-sivity, as well as provide proof of the satellite concepts.
ISMAR has two on-board blackbody targets at different temperatures such that cal-ibrations can be made in flight. Its viewing geometry is+55◦ to−10◦ nadir and +10◦ to−40◦ zenith along-track. It has also been designed to be autonomous, with all the 20
electronics located at the instrument, such that it can be installed relatively easily on to other aircraft platforms, for example HALO.
4.3.4 Operational millimeter-wave data
There is no operational down-looking submillimeter satellite instrument, but the AMSU-B/MHS instrument family provides at least measurements around the 183.31 GHz wa-25
AMTD
5, 1101–1151, 2012Observing ice clouds in the submillimeter
spectral range
S. A. Buehler et al.
Title Page Abstract Introduction Conclusions References Tables Figures
◭ ◮
◭ ◮
Back Close Full Screen / Esc
Printer-friendly Version Interactive Discussion
Discussion
P
a
per
|
Dis
cussion
P
a
per
|
Discussion
P
a
per
|
Discussio
n
P
a
per
Holl et al. (2010) describe this in a recent article. They demonstrate that radiative transfer model, CloudSat radar measurement, and MHS brightness temperature signal are all consistent, within the expected uncertainty. Furthermore, they implement a sim-ple IWP retrieval from the MHS data, assuming that the CloudSat IWP measurement represents the truth. The MHS retrieval performance is found to be consistent with the 5
CloudIce simulations as described in Jim ´enez et al. (2007), when they are restricted to use only the MHS channels. Another case study with operational microwave data, comparing the to model-based RT simulations, is discussed in Sreerekha et al. (2008). It should be mentioned that the currently available IWP products from AMSU-B/MHS agree only quite poorly with CloudSat radar data, a fact that has been observed in-10
dependently by Wu et al. (2009) and Eliasson et al. (2011). (The former use the IWP retrieval method by Zhao and Weng, 2002, the latter the operation NOAA/NESDIS IWP product, Ferraro et al., 2005, which also builds on Zhao and Weng, 2002.) For thinner clouds the poor agreement is expected, due to the lacking sensitivity of AMSU-B/MHS for these clouds. But for thick clouds (IWP above approximately 100 g m−2), where the
15
agreement is also poor, the reason is unclear.
4.3.5 Submillimeter-wave limb sounder data
No down-looking submillimeter satellite instrument has yet been launched, as men-tioned, but several submillimeter limb sounders, notably Odin-SMR and Aura MLS. Both instruments scan down below the point where the transmission through the tro-20
posphere approaches zero. This situation is encountered for tangent altitudes below approximately 10 km. For this tangent altitude range the basic properties of the obser-vations are the same as for CloudIce, although the incidence angles are considerably higher. A consequence of the high incidence angle is that only relatively high clouds can be seen by these instruments.
25
AMTD
5, 1101–1151, 2012Observing ice clouds in the submillimeter
spectral range
S. A. Buehler et al.
Title Page Abstract Introduction Conclusions References Tables Figures
◭ ◮
◭ ◮
Back Close Full Screen / Esc
Printer-friendly Version Interactive Discussion
Discussion
P
a
per
|
Dis
cussion
P
a
per
|
Discussion
P
a
per
|
Discussio
n
P
a
per
|
is based on Evans et al. (2005). In Rydberg et al. (2009), special attention was given to generating the retrieval training database, where CloudSat observations were used to ensure that both vertical and (local) horizontal cloud structures are correctly repre-sented (see Fig. 3 in Rydberg et al., 2009).
For Aura MLS, Wu et al. (2008) presents IWC and (partial) IWP retrievals. In a 5
second article, Wu et al. (2009) compare the MLS cloud ice data to CloudSat and other collocated data, including in-situ observations. The comparison focuses on normalized IWC probability density functions (pdfs). MLS and CloudSat IWC pdfs are found to agree well under conditions where both instruments are inside their sensitivity range, with relative difference below 50 % (with differences increasing with increasing IWC). 10
In summary, the limb sounder ice cloud data have been analyzed in detail (compared to climate model data and other measurements) and appear to have a high quality. Their usefulness is demonstrated for example in Eriksson et al. (2010), where the diur-nal cycle of IWC in the tropical upper troposphere is adiur-nalyzed by combining CloudSat and SMR retrievals, and where it is shown that climate models still fail to represent this 15
cycle correctly.
5 Summary and conclusions
A mission similar to CloudIce would deliver urgently needed global data on ice clouds, particularly on the so far poorly characterized “essential climate variable” ice water path (IWP) and on ice particle size. It would deliver data with near global spatial coverage 20
every 24 h, and on a spatial scale consistent with future global climate models, to both evaluate and improve the models. It would also demonstrate the benefit of submillime-ter observations for precipitation retrieval, an important step towards a possible future deployment of submillimeter radiometers in a geostationary precipitation mission.
Particular emphasis in this article was put on describing the algorithms for the data-25
AMTD
5, 1101–1151, 2012Observing ice clouds in the submillimeter
spectral range
S. A. Buehler et al.
Title Page Abstract Introduction Conclusions References Tables Figures
◭ ◮
◭ ◮
Back Close Full Screen / Esc
Printer-friendly Version Interactive Discussion
Discussion
P
a
per
|
Dis
cussion
P
a
per
|
Discussion
P
a
per
|
Discussio
n
P
a
per
Overall, the retrieval algorithms for CloudIce rest on a firm scientific basis, with the exception of the speculative class 4 products. On the other hand, coding the algorithms for operational processing, as well as doing thorough validation of the products, would still be considerable work. For this work aircraft data is very useful. Together with the two already available US instruments, the new international submillimeter-wave 5
airborne radiometer (ISMAR) will create excellent opportunities for scientific studies with campaign data, and for further algorithm validation and fine-tuning. ISMAR is currently under development by the Met Office (Uk) with ESA co-funding.
Several approaches for CloudIce retrieval demonstration have already been followed. Pure simulation studies have demonstrated the retrieval algorithm for class 2 and 10
class 3 data products. Studies with aircraft data have shown that the class 2 product retrieval algorithm works also with real millimeter/submillimeter data, and that the re-sult is consistent with airborne radar measurements. Studies of operational millimeter-wave data near 183.31 GHz, combined with collocated CloudSat data, have demon-strated that IWP retrieval works with these data. (Of course the performance without 15
the higher frequency channels is much poorer than CloudIce, but it is consistent with expectations.) Retrievals from submillimeter data from the Odin and MLS missions (the latter not discussed here) further demonstrate our capability to handle also submillime-ter data correctly.
When all these approaches are taken together, they demonstrate that we have 20
a robust understanding of the radiative properties of cloud ice in the millime-ter/submillimeter spectral range, and that we have a proven toolbox of retrieval algo-rithms to work with these data.
Acknowledgements. We acknowledge the help of the CloudIce science community that has contributed in innumerable ways to the ideas presented in this article. Stefan Buehler’s work 25
AMTD
5, 1101–1151, 2012Observing ice clouds in the submillimeter
spectral range
S. A. Buehler et al.
Title Page Abstract Introduction Conclusions References Tables Figures
◭ ◮
◭ ◮
Back Close Full Screen / Esc
Printer-friendly Version Interactive Discussion
Discussion
P
a
per
|
Dis
cussion
P
a
per
|
Discussion
P
a
per
|
Discussio
n
P
a
per
|
References
Anderson, G. P., Clough, S. A., Kneizys, F. X., Chetwynd, J. H., and Shettle, E. P.: AFGL atmospheric constituent profiles (0–120 km), Tech. rep., AFGL, TR-86-0110, 1986. 1146, 1147
Bauer, P., Lopez, P., Benedetti, A., Salmond, D., and Moreau, E.: Implementation of 1D+ 4D-5
Var Assimilation of Precipitation Affected Microwave Radiances at ECMWF, Part I: 1D-Var, Tech. rep., European Centre for Medium-Range Weather Forecasts ECMWF, Technical Memorandum, 2006a. 1118
Bauer, P., Lopez, P., Salmond, D., Benedetti, A., Saarinen, S., and Bonazzola, M.: Im-plementation of 1D+4D-Var Assimilation of Precipitation Affected Microwave Radiances at 10
ECMWF, Part II: 4D-Var, Tech. rep., European Centre for Medium-Range Weather Forecasts ECMWF,Technical Memorandum, 2006b. 1118
Bredow, J. W., Porco, R., Dawson, M. S., Betty, C. L., Self, S., and Thordarson, T.: A Multi-frequency Laboratory Investigation of Attenuation and Scattering from Volcanic Ash Clouds, IEEE Geosci. Remote Sens., 33, 1071–1082, doi:10.1109/36.406693, 1995. 1109
15
Buehler, S. A. and John, V. O.: A Simple Method to Relate Microwave Radiances to Upper Tropospheric Humidity, J. Geophys. Res., 110, D02110, doi:10.1029/2004JD005111, 2005. 1114
Buehler, S. A., Eriksson, P., Kuhn, T., von Engeln, A., and Verdes, C.: ARTS, the atmospheric radiative transfer simulator, J. Quant. Spectrosc. Ra., 91, 65–93, 20
doi:10.1016/j.jqsrt.2004.05.051, 2005. 1116
Buehler, S. A., Courcoux, N., and John, V. O.: Radiative transfer calculations for a passive microwave satellite sensor: Comparing a fast model and a line-by-line model, J. Geophys. Res., 111, D20304, doi:10.1029/2005JD006552, 2006. 1117
Buehler, S. A., Jim ´enez, C., Evans, K. F., Eriksson, P., Rydberg, B., Heymsfield, A. J., Stuben-25
rauch, C., Lohmann, U., Emde, C., John, V. O., Sreerekha, T. R., and Davis, C. P.: A concept for a satellite mission to measure cloud ice water path and ice particle size, Q. J. Roy. Me-teorol. Soc., 133, 109–128, doi:10.1002/qj.143, 2007. 1104, 1106, 1107, 1109, 1110, 1111, 1112, 1118, 1119, 1135
Buehler, S. A., Kuvatov, M., John, V. O., Milz, M., Soden, B. J., Jackson, D. L., and Notholt, 30
AMTD
5, 1101–1151, 2012Observing ice clouds in the submillimeter
spectral range
S. A. Buehler et al.
Title Page Abstract Introduction Conclusions References Tables Figures
◭ ◮
◭ ◮
Back Close Full Screen / Esc
Printer-friendly Version Interactive Discussion
Discussion
P
a
per
|
Dis
cussion
P
a
per
|
Discussion
P
a
per
|
Discussio
n
P
a
per
Buehler, S. A., John, V. O., Kottayil, A., Milz, M., and Eriksson, P.: Efficient Radiative Transfer Simulations for a Broadband Infrared Radiometer – Combining a Weighted Mean of Repre-sentative Frequencies Approach with Frequency Selection by Simulated Annealing, J. Quant. Spectrosc. Ra., 111, 602–615, doi:10.1016/j.jqsrt.2009.10.018, 2010. 1117
Buehler, S. A., Eriksson, P., and Lemke, O.: Absorption lookup tables in the radiative transfer 5
model ARTS, J. Quant. Spectrosc. Ra., 112, 1559–1567, doi:10.1016/j.jqsrt.2011.03.008, 2011. 1117
Chaboureau, J., S ¨ohne, N., Pinty, J., Meirold-Mautner, I., Defer, E., Prigent, C., Pardo, J. R., Mech, M., and Crewell, S.: A midlatitude precipitating cloud database validated with satellite observations, J. Appl. Meteorol. Clim., 47, 1337–1353, 2008. 1120, 1149
10
Charlton, J., Jarrett, M. L., Humphries, M. E., Child, R. K., Atkinson, N. L., Hewison, T. J., Slingo, A., Spilling, D. A. V., Higgins, J. M., Bray, M. A., Foster, P. R., and Matheson, D. N.: Study on Future Microwave and Millimetre-wave Radiometer Requirements and Concepts, Final Report, Tech. rep., ESTEC Contract No. 14841/01/NL/MM, 2002. 1107
Charlton, J., Moyna, B., Lee, C., and Defer, E.: Study of a Sub-millimetre Wave Airborne 15
Demonstrator for Observations of Precipitation and Ice Clouds, Final Report, Tech. rep., ESTEC Contract No. 20927/07/NL/JA, 2010. 1120, 1123, 1142
Davis, C., Emde, C., and Harwood, R.: A 3D Polarized Reversed Monte Carlo Radiative Trans-fer Model for mm and sub-mm Passive Remote Sensing in Cloudy Atmospheres, IEEE T. Geosci. Remote, 43, 1096–1101, doi:10.1109/TGRS.2004.837505, 2005. 1116
20
Davis, C. P., Evans, K. F., Buehler, S. A., Wu, D. L., and Pumphrey, H. C.: 3-D polarised simulations of space-borne passive mm/sub-mm midlatitude cirrus observations: a case study, Atmos. Chem. Phys., 7, 4149–4158, doi:10.5194/acp-7-4149-2007, 2007. 1117 Defer, E., Prigent, C., Aires, F., Pardo, J. R., Walden, C. J., Zanife, O. Z., Chaboureau,
J. P., and Pinty, J. P.: Development of precipitation retrievals at millimeter and sub-25
millimeter wavelengths for geostationary satellites, J. Geophys. Res., 113, D08111, doi:10.1029/2007JD008673, 2008. 1120
Delano ¨e, J. and Hogan, R. J.: A variational scheme for retrieving ice cloud properties from combined radar, lidar, and infrared radiometer, J. Geophys. Res., 113, D07204, doi:10.1029/2007JD009000, 2008. 1114
30