www.atmos-chem-phys.net/10/8649/2010/ doi:10.5194/acp-10-8649-2010
© Author(s) 2010. CC Attribution 3.0 License.
Chemistry
and Physics
The potential influence of Asian and African mineral dust on ice,
mixed-phase and liquid water clouds
A. Wiacek1, T. Peter2, and U. Lohmann2
1Department of Physics and Atmospheric Science, Dalhousie University, Halifax, Nova Scotia, Canada 2Institute for Atmospheric and Climate Science, ETH Z¨urich, Switzerland
Received: 8 December 2009 – Published in Atmos. Chem. Phys. Discuss.: 8 December 2009 Revised: 30 June 2010 – Accepted: 27 August 2010 – Published: 16 September 2010
Abstract. This modelling study explores the availability of
mineral dust particles as ice nuclei for interactions with ice, mixed-phase and liquid water clouds, also tracking the parti-cles’ history of cloud-processing. We performed 61 320 one-week forward trajectory calculations originating near the sur-face of major dust emitting regions in Africa and Asia using high-resolution meteorological analysis fields for the year 2007. Dust-bearing trajectories were assumed to be those co-inciding with known dust emission seasons, without explic-itly modelling dust emission and deposition processes. We found that dust emissions from Asian deserts lead to a higher potential for interactions with high ice clouds, despite being the climatologically much smaller dust emission source. This is due to Asian regions experiencing significantly more as-cent than African regions, with strongest asas-cent in the Asian Taklimakan desert at ∼25%, ∼40% and 10% of trajecto-ries ascending to 300 hPa in spring, summer and fall, re-spectively. The specific humidity at each trajectory’s start-ing point was transported in a Lagrangian manner and rela-tive humidities with respect to water and ice were calculated in 6-h steps downstream, allowing us to estimate the forma-tion of liquid, mixed-phase and ice clouds. Downstream of the investigated dust sources, practically none of the simu-lated air parcels reached conditions of homogeneous ice nu-cleation (T.−40◦C) along trajectories that have not expe-rienced water saturation first. By far the largest fraction of cloud forming trajectories entered conditions of mixed-phase clouds, where mineral dust will potentially exert the biggest influence. The majority of trajectories also passed through atmospheric regions supersaturated with respect to ice but
Correspondence to:A. Wiacek ([email protected])
subsaturated with respect to water, where so-called “warm ice clouds” (T&−40◦C) theoretically may form prior to su-percooled water or mixed-phase clouds. The importance of “warm ice clouds” and the general influence of dust in the mixed-phase cloud region are highly uncertain due to both a considerable scatter in recent laboratory data from ice nu-cleation experiments, which we briefly review in this work, and due to uncertainties in sub-grid scale vertical transport processes unresolved by the present trajectory analysis. For “classical” cirrus-forming temperatures (T.−40◦C), our re-sults show that only mineral dust ice nuclei that underwent mixed-phase cloud-processing, most likely acquiring coat-ings of organic or inorganic material, are likely to be rele-vant. While the potential paucity of deposition ice nuclei shown in this work dimishes the possibility of deposition nu-cleation, the absence of liquid water droplets atT.−40◦C makes the less explored contact freezing mechanism (involv-ing droplet collisions with bare ice nuclei) highly inefficient. These factors together indicate the necessity of further sys-tematic studies of immersion mode ice nucleation on mineral dust suspended in atmospherically relevant coatings.
1 Introduction
direct radiative effect, which feeds back on surface temper-atures and winds, as well as on climate (Tegen, 2003). Like other aerosols, mineral dust is also capable of exerting an in-direct effect on the climate system. This is thought to occur primarily via the ice phase of clouds and precipitation, and it represents a big uncertainty in the indirect effect of aerosols (Denman et al., 2007). Challenges in modelling dust emis-sion, transport and deposition processes (Textor et al., 2006; Cakmur et al., 2006) combined with unresolved questions concerning the role of dust in ice nucleation (e.g., Zimmer-mann et al., 2008 and references therein) lead to correspond-ing uncertainties in quantitative, global model estimates of the impact of mineral dust on the ice phase of clouds and pre-cipitation (e.g., Hoose et al., 2008; Storelvmo et al., 2008).
It has been known for a long time from both observa-tions and laboratory studies that mineral dust particles are efficient ice nuclei (e.g., Mason and Maybank, 1958; Isono et al., 1959). Recent field measurements both confirm this (e.g. DeMott et al., 2003a, b) and also give in situ evi-dence of mineral dust in ice crystal residuals (e.g. Cziczo et al., 2004a; Twohy and Poellot, 2005). Additionally, polar-ization LIDAR measurements provide further evidence for both African (Sassen et al., 2003; Ansmann et al., 2005, 2008, 2009) and Asian (Sassen, 2002, 2005; Sakai et al., 2004) desert dust causing the glaciation of supercooled wa-ter clouds at a wide range of temperatures. In general, tro-pospheric ice may occur at high altitudes and low temper-atures (T.−40◦C) in cirrus clouds or at intermediate alti-tudes and temperatures (−40◦C.T <0◦C) in mixed-phase clouds, which contain an external mixture of ice crystals and supercooled water droplets. In the cold regime, homo-geneous nucleation of ice crystals is possible (Koop et al., 2000), while in the warmer regime, homogeneous ice nucle-ation is impossible and ice can only form via heterogeneous nucleation processes, i.e., immersion and deposition freez-ing, possibly also the less explored contact or condensation freezing (see, e.g., Pruppacher and Klett (1997) or Field et al. (2006) for a brief review). Laboratory studies have shown that deposition freezing is a very efficient heterogeneous ice nucleation mechanism in the cold cirrus regime (M¨ohler et al., 2006). On the other hand, some combination of con-tact and immersion freezing is thought to control heteroge-neous ice formation in the warmer temperature regime (e.g., Hobbs and Rangno, 1985; Mason and Maybank, 1958; Hof-fer, 1961), although deposition freezing is also observed at warmer temperatures for larger particles and/or higher sur-face defects (e.g., Roberts and Hallett, 1968; Zimmermann et al., 2008).
One goal of our modelling study is to assess the avail-ability of “bare” (i.e. without coating by atmospheric con-stituents) mineral dust particles capable of serving as depo-sition ice nuclei (IN) in cirrus-forming regions of the atmo-sphere. For this purpose we accept only particles not hav-ing experienced water saturation, or, in other words, parti-cles not having experienced liquid and/or mixed-phase cloud
processing, because the ice nucleation efficiency of mineral dust is thought to decrease when it acquires chemical coat-ings (containing, e.g., nitric or sulphuric acids, or organics) through processing in liquid clouds. Additionally, relaxing the no-water-saturation condition, we explored the potential for interactions of mineral dust with mixed-phase clouds as coated immersion IN, thought to operate at colder tempera-tures than uncoated contact or deposition IN. Finally we ex-amined the potential for interaction of mineral dust as cloud condensation nuclei (CCN) in warm water clouds (T >0◦C).
In Sect. 2, we briefly describe and contrast the dust emission and transport characteristics of the Asian and African dust emitting regions that are the focus of our study. In Sect. 3, we outline our approach to trajectory modelling (including some limitations) and our subsequent data analysis. Sec-tion 4 presents the main results of our trajectory analysis, again highlighting differences between Asian and African dust emission regions. Finally, a summary and conclusions are given in Sect. 5.
2 African and Asian dust emission regions
2.1 Seasonality of dust emission
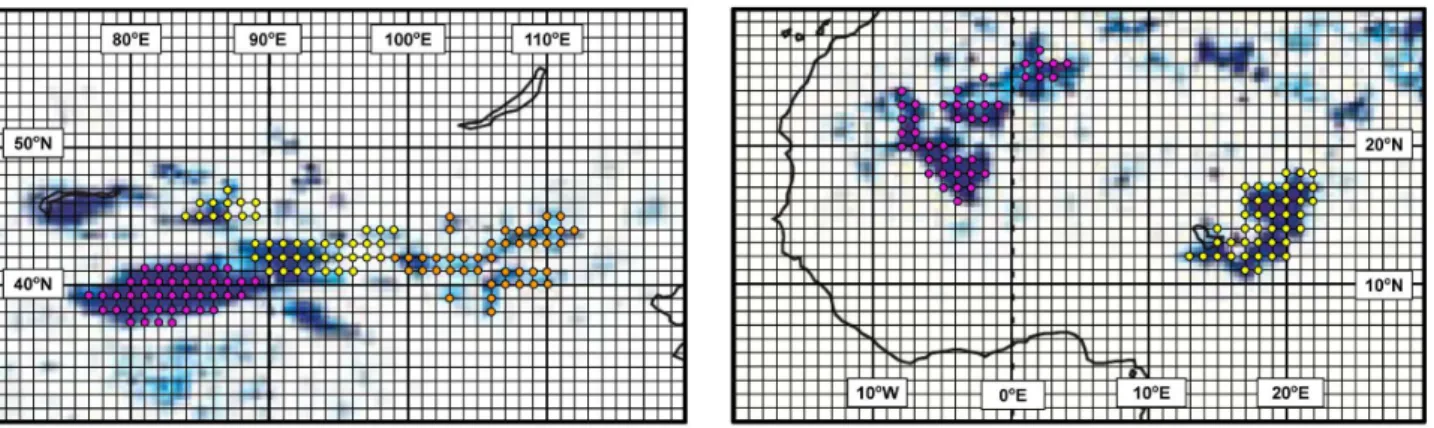
Fig. 1. Circles show the locations of Asian (left) and African (right) trajectory starting points (42 per region) used in this study, superim-posed on a map (adapted from Tegen, 2003) of preferential dust source areas (in blue) derived from potential past lake areas. Pink points represent the Asian Taklimakan desert and West African dust sources, yellow points represent the western Gobi desert in Asia and the Bod´el´e Depression in Africa, while orange points represent the eastern Gobi desert.
Asian deserts comprise a heterogeneous arid region (see e.g., Fig. 1 in either Sun et al., 2008 or Kurosaki and Mikami, 2007), which includes the well known Gobi desert, as well as the Taklimakan desert. On average, Asian deserts are found at higher elevations than African deserts, and the Taklimakan is entirely contained within the vast Tarim Basin, surrounded by>3-km-high topography on all sides, except for a rela-tively small opening on the eastern boundary (see, e.g., Fig. 1 in Wiacek and Peter, 2009). In our study, the Gobi desert is sub-divided into two regions, each spanned by 42 points (Fig. 1). The peak of the Asian dust season for the Gobi desert occurs from March to May (e.g., Sun et al., 2001; Shao and Wang, 2003; Shao and Dong, 2006), while the Taklimakan, like Africa’s Bod´el´e depression, is active nearly year-round, albeit with modest dust emission levels, peak-ing in sprpeak-ing and exhibitpeak-ing a wintertime minimum. We ex-amined night time total attenuated backscatter measurements made by the CALIPSO satellite (Winker et al., 2007) over the Tarim Basin from March to May 2007 (available on 42% of days) and found that the basin is dusty nearly 100% of this time, with dust routinely reaching altitudes of 3–5 km above sea level. This is in good agreement with the ground-based observations of Wang et al. (2008), who also find that during spring the Tarim Basin has a much higher frequency of occurrence of floating dust events than the nearby Gobi desert. (The latter region, however, has a higher frequency of higher intensity events, which Wang et al., classify as “blow-ing dust” and “dust storms”.) Finally, the CALIPSO-based work of Liu et al. (2008) also confirms our analysis and addi-tionally shows that the Tarim Basin is dusty up to similar alti-tudes and in all months of the year except the winter months from December to February. The remote sensing measure-ments agree with balloon-borne measuremeasure-ments described by Iwasaka et al. (2003), wherein dust was clearly the major component of the coarse mode, as detected by electron mi-croscope analyses of particles collected by an impactor, up to
5 km over the eastern margin of the Tarim basin in August, 2002. Background summertime dust traced back to the Tak-limakan desert was also detected by aircraft instrumentation and ground-based LIDAR over Japan (Matsuki et al., 2003).
2.2 Characteristics of transport and ascent
On account of its low source latitude (15–30◦N)
Saha-ran dust is primarily tSaha-ransported westwards across the At-lantic, while Asian dust, which is sourced between 30– 50◦N, is transported eastwards across the Pacific (e.g.,
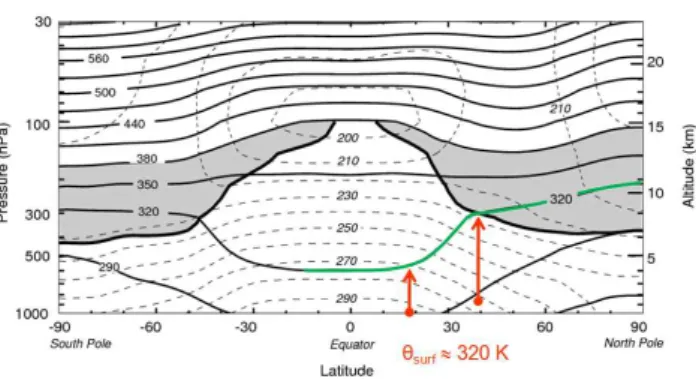
Fig. 2. Zonal and annual mean potential temperature (thin solid lines), absolute temperature (thin dashed lines), and tropopause (thick solid line). Shaded areas denote the lowermost stratosphere, whose potential temperature surfaces span the tropopause. Bases of red arrows mark the approximate latitude and altitude of African and Asian dust emission sources, which both reach surface potential temperatures of∼320 K. Figure adapted from Holton et al. (1995).
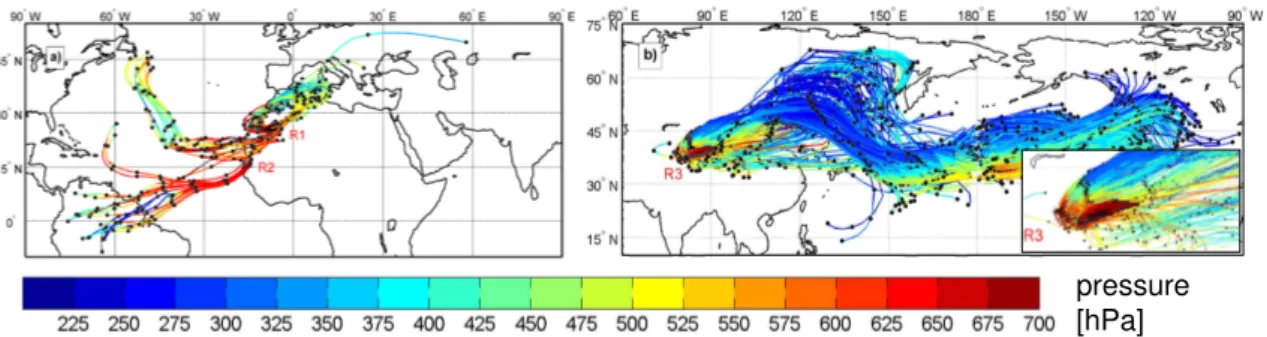
across parts of the Tian Shan mountain range, which forms the northern basin margin (see Fig. 1 of Wiacek and Peter, 2008). In general, dust from the Gobi desert is thought to be confined to<3 km altitude 90% of the time, while dust from the Taklimakan desert is entrained relatively easily to >5 km (Sun et al., 2001). We simulated a similar number of trajectories for two specific dust events in the Tarim Basin (May, 2007) and over West Africa (July, 2007) and found that while only 4.4% of African trajectories ascended to 450 hPa (∼6–7 km), 96% of Asian trajectories ascended to the same pressure (see Wiacek et al. (2008) for details of these particu-lar cases). Figure 3 shows this together with the predominant transport patterns; it is apparent that if African dust ascends to the upper troposphere, i.e.,<300 hPa, (Fig. 3a), this occurs near deep convective systems over or near the Atlantic, while dust from the Taklimakan desert (in the Tarim basin) seems at least partly influenced by the local topography, especially near the south and west basin margins (Fig. 3b, inset). The exact uplift mechanisms are complex and form the subject of ongoing research (e.g., Uno et al., 2005; Seino et al., 2005). Although Fig. 3 focuses on reaching the upper troposphere, we note that had trajectories been started near the top of the Saharan atmospheric boundary layer, routinely found at ∼5 km altitude, more transport at∼500 hPa would have been evident immediately in the African trajectories. However, both the melting level and the tropopause altitude above this low-latitude desert are correspondingly higher than in Asia and, moreover, satellite observations (e.g., Liu et al., 2007) show that the top of the dust layer at∼5 km remains coherent in seasonal averages, capped by a persistent inversion, with no evidence of a slow “leakage” of dust to the upper tropo-sphere.
3 Methodology
3.1 Trajectory calculations
In order to build a climatological understanding of potential interactions of Asian and African dust with clouds, we calcu-lated four one-week (168-h) trajectories departing from each point in the given dust source regions (Fig. 1) at 00:00, 06:00, 12:00, and 18:00 on each day of 2007. All trajectories started from a uniform pressure of 770 hPa (except those in Fig. 3, performed separately), chosen to correspond to∼1–1.5 km height above the most elevated desert topography (in Asia). Trajectory variables of pressure (p), temperature (T ), spe-cific humidity (Q), latitude and longitude were saved every 6 h (i.e., at 29 locations along each trajectory). We covered the dust source region of the Taklimakan desert, as defined by Tegen (2003) and coinciding with the Tarim Basin, with trajectory starting points distributed at 1◦horizontal
resolu-tion, yielding 42 points in total. Conveniently each of the five desert regions of interest (counting eastern and western Gobi regions separately) can be spanned roughly by 42 start-ing points, providstart-ing a constant number of trajectory points in each analysed region: 365×4×42×29=1 778 280. In or-der to best capture the complex wind patterns near the often rugged Asian desert topography, we used the highest resolu-tion European Centre for Medium-Range Weather Forecasts (ECMWF) analysed wind, temperature and moisture fields available operationally (T799 in spectral space, 91 model levels, i.e. roughly 200 m vertical resolution in the lower tro-posphere). The ECMWF model uses a hybrid coordinate system that follows the terrain near the surface and relaxes to horizontal surfaces in higher model layers; there are∼50 model levels in the troposphere alone (Untch et al., 2006). The importance of model resolution, especially for the Tarim Basin, is highlighted by Tanaka and Chiba (2006), who de-scribe how increasing the horizontal resolution from T42 (∼2.8◦) to T63 (∼1.9◦) to T106 (∼1.1◦) changes the pre-dicted dust column loading in their study from a non-event into a strong dust emission episode. The T799 (triangular truncation) spectral resolution analysis fields employed in our study correspond to∼25 km horizontal resolution.
All trajectories were calculated using the LAGRangian tra-jectory ANalysis TOol (LAGRANTO) developed by Wernli and Davies (1997). This relies on the three components of the wind field, neglecting mixing, a limitation discussed be-low. In our modification, the ECMWF-derived specific hu-midity at each trajectory’s starting point was subjected to the ambient temperature and pressure at the 28 trajectory points found downstream, thus providing “Lagrangian relative hu-midities” with respect to liquid water (RHw)and ice (RHi)
pressure [hPa]
Fig. 3.Trajectories started from 700 hPa in African dust plume regions R1 and R2(a)and in Asian dust plume region R3(b)that ascended to altitudes above the 450-hPa level. Black dots indicate trajectory locations at 24-h intervals while color along a trajectory indicates its pressure (hPa).
we were able to simulate conditions of ice supersaturation along our trajectories, which are not presently represented in ECMWF analyses fields (supersaturation is allowed to de-velop in forecast fields, but always from non-supersaturated initial analysis values, see Tompkins et al., 2007).
3.2 Limitations
Our calculated trajectories are simple transport trajectories without microphysical simulation of either dust emission or wet or dry deposition processes. Regarding the latter, where our objective is to identify the availability of deposition IN in cirrus-forming regions, we look for conditions of subsat-uration with respect to water, making wet deposition irrele-vant. Where we examine trajectory points that have expe-rienced water saturation, we discuss possible effects of wet deposition by in-cloud scavenging. Regarding dry deposi-tion, we calculated the terminal velocity of mineral dust par-ticles likely to make it to the upper troposphere, i.e., particle radius of 1 µm or less with a density of 2.65 g/cm3 and an aspect ratio of 1:3, to be less than 40 m/day for suspension altitudes<10 km. On the one-week time scale of our trajec-tory calculations, this amounts to only 280 m of descent by sedimentation. While we are also neglecting turbulent depo-sition near the surface, total dry depodepo-sition (turbulent and by sedimentation) does not play a prominent role along our one-week trajectories for micrometer-sized particles. Nonethe-less, it would not be correct to assume that the trajectories will be dust-bearing at all times. Based on the dust season-ality discussion presented in Sect. 2, Taklimakan transport trajectories are most representative of dust-laden air masses in spring and, to some extent, also in summer and fall, while Gobi transport trajectories are most dust-representative dur-ing March, April and May. In contrast, West African trajec-tories can be assumed to carry dust from May to August, and Bod´el´e trajectories in winter, as well as in spring and fall, with a reduction in the summer months.
A more serious drawback of our approach is that we ne-glect mixing processes, which may influence our calculated “transported” or “Lagrangian” relative humidities. However,
wind-blown dust from the Taklimakan often rises in parcels of very hot and dry air (e.g., 30◦C at 4% RH) such that
mix-ing with air from surroundmix-ing less arid regions will generally result in a moistening effect. Generally, air above deserts is extremely dry because it has undergone strong subsidence or orographic lift and precipitation in upstream mountains. As such, desert soils lose humidity to the atmosphere, and this may lead to a very limited moistening of the air. Only when dust-laden air parcels start leaving the desert regions does mixing with much more humid air parcels lead to a sub-stantial moistening. For example, the dust-laden air can be entrained into (deep) convection, which may transport the dust vertically all the way to the tropopause. However, this will inevitably lead to air in these mixed parcels undergoing washout and becoming incapable of reaching cirrus levels unprocessed. Therefore, neglect of mixing in our analysis is indeed a conservative approximation, and the estimated frac-tion of dusty, unprocessed air reaching cirrus levels may, if anything, be somewhat overestimated.
source regions. Recognizing the care necessary in sampling multiple altitudes in the boundary layer, we choose to limit the scope of our study at this stage to more reliably dusty and diurnally unaffected lower regions of the boundary layer.
Deep moist convection, e.g., in large-scale weather sys-tems that involve anvil cirrus formation, is also not well re-solved by our trajectories, even though aircraft observations between 5 and 15 km have documented such transport of dust to the upper troposphere (Cziczo et al., 2004a). This convec-tion is accompanied by large supersaturaconvec-tions with respect to water, likely to either nucleate ice on the best dust IN and thus cause their rapid sedimentation, or likely to coat mediocre dust IN with water and soluble species, and thus convert them from deposition to immersion IN or deactivate them altogether. Finally, the efficiency of dust IN released from evaporating ice crystals at convective outflow levels may vary greatly. While laboratory evidence suggests that the efficiency of mineral dust IN subjected to repeated cy-cles of ice nucleation increases (Mason and Maybank, 1958; Roberts and Hallett, 1968; Knopf and Koop, 2006), the pres-ence of substances other than water, e.g., sulphuric acid, is found to have neutral to negative effects on the ice nucle-ation efficiency of dust IN (Archuleta et al., 2005; Knopf and Koop, 2006; Eastwood et al., 2009). Additionally, coat-ings of ammonium sulphate (an inorganic salt) are found to inhibit ice nucleation at higher temperatures while increas-ing IN efficiency at temperatures below the ammonium sul-phate efflorescence point (Eastwood et al., 2009). Moreover, the introduction of organic substances in cloud processing may further complicate the situation, as field measurements have shown that organic-rich particles preferentially remain unfrozen in homogeneous nucleation processes (Cziczo et al., 2004b), and, more recently, M¨ohler et al. (2008) have shown with laboratory experiments that secondary organic coatings markedly suppress the ice nucleation efficiency of mineral dust IN at cirrus temperatures. As our goal is to assess the availability of bare mineral dust deposition IN in cirrus-forming regions, the inability to fully resolve (deep) convection is neglected in the following, i.e. we do not fol-low up on the possibility that dust particles, after passing the “tropical convective dust pump” may be re-released as po-tentially still potent, or even pre-activated ice nuclei. Since deep convection is relatively more important than synoptic scale ascent in the tropics (as opposed to mid-latitudes), this may be a source of bias.
Finally, in the non-convective transport occurring along our trajectories over seven days we neglect aerosol aging and the formation of chemical coatings, if any. This is well jus-tified for dusts emitted from Africa, which are transported across pristine Atlantic Ocean regions, and have been found to contain little sulphate, nitrate or organic coatings after a week of transport to the Florida region (Cziczo et al., 2004a). Chemical coatings may also be neglected for dust trajectories originating from the Taklimakan desert, which tend to travel at altitudes considerably above the polluted Asian planetary
boundary layer (see Sect. 2.2). It is only for dust originat-ing from the Gobi desert, which is often transported towards the Pacific coast at relatively low altitudes, that neglecting chemical aging processes could become important.
3.3 Data analysis
For each dust emission region, a set of ∼1.8 million cal-culated trajectory points was sorted according to their La-grangian relative humidity and temperature into (i) wa-ter clouds (below formally cloud type WATER, T >0◦C),
(ii) mixed-phase clouds (below formally cloud type MPC, −40◦C.T <0◦C), and (iii) cirrus clouds (below formally cloud type CIRRUS,T.−40◦C); see Fig. 4 for Roman nu-merals representing the cloud types discussed here. (We note that −40◦C is formally too cold to be considered a mixed-phase cloud, however, a sensitivity test performed at −36◦C shows that our conclusions are not strongly af-fected by the choice of this transition temperature.) Ad-ditionally, ice-supersaturated and simultaneously water-subsaturated regions were tracked and classified as cloud types (iv) COLD HET (T.−40◦C) and (v) WARM HET (−40◦C.T <0◦C), on account of the potential of potent IN to cause heterogeneous ice nucleation in these regions, be-fore the trajectories reach conditions suitable for CIRRUS clouds (by virtue of homogeneous freezing) or MPC clouds (by virtue of water saturation), respectively. COLD HET clouds comprise purely heterogeneously nucleated, optically thin and cold ice clouds. They are distinct from our cloud type CIRRUS, which we reserve for clouds that are homoge-neously nucleated at T.−40◦C, i.e., “classical”, optically thick cirrus clouds. WARM HET clouds comprise heteroge-neously nucleated, likely optically thin, pure ice clouds that form entirely in the absence of liquid water, like “classical” cirrus, but whose nucleation temperatures are much warmer than “classical” cirrus. Although we postulate WARM HET clouds, there are limitations (discussed below) to the activity of heterogeneous IN below water saturation at the warmest sub-zero temperatures and lowest ice supersaturations of re-gion (v). Finally, rere-gion (vi) of Fig. 4 comprises those points that were classified as clear air.
The bottom panel of Fig. 4 shows, for each dust emission region, the number of trajectories that reach water satura-tion for a given temperature. The initial moisture content of trajectories leaving the Asian deserts is such that the major-ity of those air parcels that are suitable for cloud formation reach water saturation for mixed-phase cloud temperatures (−40◦C.T <0◦C). This is similar for the African trajecto-ries, however, there is much more variability throughout the year. In the more southerly Bod´el´e region in particular, a dis-tinct (summer) wet season is responsible for the secondary peak of “wet” trajectories centred around 280 K.
TAK GOB WES BOD
2100 220 230 240 250 260 270 280 290 20
40 60 80 100 120 140 160 180 200
7
6 3
2 4
5
RH
ice
[%] 1
average
dry wet
(i)
(ii)
(iii)
(iv) (v)
(vi)
210 220 230 240 250 260 270 280 290 Temperature [K]
Num
be
r [
K
-1] 2000
1000
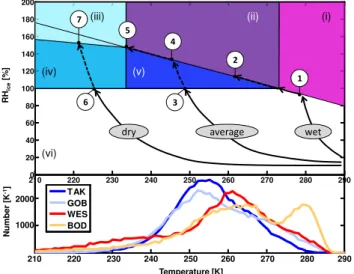
Fig. 4. Schematic of cloud types (Roman numerals: (i) water, (ii) mixed-phase, (iii) cirrus, (iv) COLD HET, (v) WARM HET, (vi) clear sky) and cloud formation processes (Arabic numerals: (1) WATER, (2) MPC’, (3) WARM HET, (4) MPC, (5) CIRRUS’, (6) COLD HET, (7) CIRRUS) possible along the air parcel trajecto-ries, depending on a schematically indicated initial moisture content (“wet”, “average”, “dry”). Straight line containing (1) and (5) ap-proximates RHw=100% (for simplicity extrapolated toT >273 K). Straight line separating colored regions (iii) and (iv) follows the pa-rameterization of Koop et al. (2000) for 200 nm solution droplets. Bottom panel shows the distribution of water saturation tempera-tures of individual trajectories, given their actual initial moisture content. See text for details.
Arabic numerals denote specific cloud formation processes that can occur upon lifting and cooling for “wet”, “average” and “dry” trajectories, referring to a theoretical initial mois-ture content at trajectory timet=0.As a “wet” trajectory lifts and cools, it reaches water saturation and forms WATER clouds (1), where from here on we use capital letters to distin-guish a cloud type specific to our study from the generic use of the word, possibly followed by mixed-phase cloud forma-tion (2) in the event of further lifting and cooling. The most common (“average”) trajectory passes region (v) as it rises and cools, where ice can nucleate WARM HET clouds het-erogeneously in the presence of potent IN (3), before reach-ing water saturation and mixed-phase cloud formation (4), possibly followed by homogeneous nucleation of CIRRUS clouds (5) upon further lifting and cooling. The “dry” trajec-tory passes region (iv), where heterogeneous nucleation of COLD HET clouds is possible (6), before reaching the ho-mogeneous ice nucleation limit and CIRRUS formation (7). We define three additional cloud types to fully account for a trajectory point’s history as follows. While process (4) leads to mixed-phase cloud type MPC, process (2) leads to what we call mixed-phase cloud type MPC’, on account of the prior formation of a WATER cloud atT >0◦C in the
tra-jectory. Analogously, while process (7) leads to CIRRUS
clouds, process (5) leads to what we call CIRRUS’, on ac-count of prior formation of an MPC in the trajectory. Finally, (not shown in Fig. 4), we classify some trajectories as CIR-RUS”, on account of prior formation of a WATER cloud in the trajectory, also atT >0◦C.
4 Results and discussion
4.1 Dust/Cloud interactions by cloud type and dust
region
4.1.1 General effects
Table 1.Percentage of the∼1.8 million trajectory points originat-ing from each dust emission region that were classified as crashed (contact with orography), clear sky (type vi in Fig. 4), cloudy (sum of types i–v), or “oscillatory” (multiple entry into any of types i–vi, see text for details).
Taklimakan Gobi West Africa Bod´el´e
Crashed 13.0 8.9 0.4 0.3
Clear sky 57.3 57.6 84.5 86. 5
Oscillatory Clear Sky 7.7 11.0 5.7 2.7
Cloudy 13.4 15.2 6.9 7.6
Oscillatory Cloudy 8.5 7.4 2.6 3.0
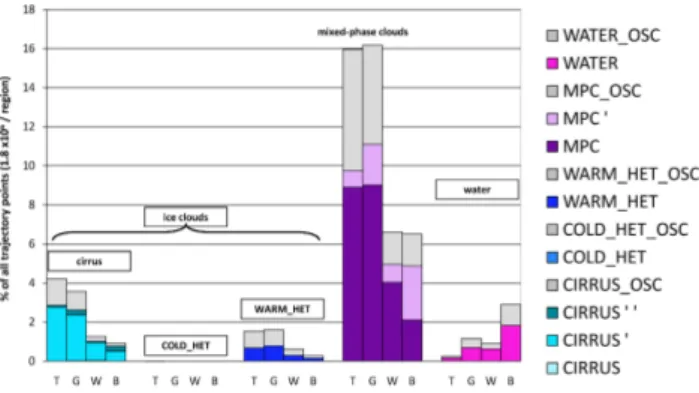
The sum of cloud types (i–v) introduced in Sect. 3.3 (Fig. 4) together with cloud types MPC’, CIRRUS’, and CIR-RUS” comprises 13.4% of points originating from the Tak-limakan, 15.2% from the Gobi, 6.9% from West African deserts and 7.6% from the Bod´el´e Depression. Given that Asian trajectories have a lower initial moisture content (not shown) and are subject to water saturation at predominantly lower temperatures (bottom panel of Fig. 4), the higher in-cidence of cloudiness in Asian trajectories is explained by higher ascent from this region as compared to Africa (see details in Sect. 4.3). The detailed breakdown into various cloud types is shown in Fig. 5 and in Table 2, including “os-cillatory” cloudiness, denoted by the suffix “OSC”. The oc-currence of cloud types CIRRUS and COLD HET (homo-geneously and hetero(homo-geneously formed pure ice clouds at “classical” cirrus temperatures ofT.−40◦C, respectively) is negligible in all regions (<0.025% of trajectory points in any region). The potential for mineral dust interactions with the remainder of cold cloud types (CIRRUS’, CIRRUS”, MPC and WARM HET, excluding only MPC’) is greater from Asian than from African dust sources by roughly a fac-tor of 2. MPC’ points are those that experience water satura-tion forT >0◦C, which is more likely to occur in the warmer
African deserts. Results are numerically similar in the two Asian regions and again in the two African regions. By far, the potential influence of mineral dust is greatest via MPC clouds, followed by CIRRUS’ (cirrus clouds possibly form-ing subsequent to MPC glaciation, after further liftform-ing and cooling of air parcels), and lastly via WARM HET clouds (heterogeneously formed, likely to be optically thin, rela-tively warm, pure ice clouds). We note again that the most prominent component of the cirrus cloud family in all geo-graphic regions is in fact CIRRUS’, i.e., those cirrus clouds that formed after the air parcel experienced water saturation at some−40◦C<T <0◦C and continued rising to “classical” cirrus-forming regions. CIRRUS”, i.e. those cirrus clouds that possibly formed after the air parcel experienced water saturation forT >0◦C, make only a small contribution to the
cirrus family, along with “oscillatory cirrus”. Finally, on an
Fig. 5.The breakdown of only those trajectory points classified as cloudy in each geographic region (i.e. sum of last two lines in Ta-ble 1): Taklimakan (T), Gobi (G), West Africa (W) and Bod´el´e (B). Note that cloud types CIRRUS, COLD HET and COLD HET OSC are not visible on this scale. See Table 2 for tabular format.
annual basis, the potential for mineral dust to affect warm WATER clouds is lowest in all geographic regions except the Bod´el´e. The Taklimakan desert leads to the least WA-TER cloud points, the Gobi and West African deserts are cloudier and comparable to one another, while the Bod´el´e gives three times more WATER cloud points than the latter two (Table 2).
4.1.2 Seasonal effects in WATER clouds
scavenging (involving both cloud droplets and ice crystals, 34%) and sedimentation (36%), with below-cloud scaveng-ing and turbulent dry deposition accountscaveng-ing for 24% and 6%, respectively. For that same study, the role of in-cloud and below-cloud scavenging of theinsolubledust mass in the ac-cumulation size mode (radius 50–500 nm, most relevant to our study as discussed in Sect. 3.2) grows to 56% and 36%, respectively (B. Croft, personal communication, 2010); how-ever, since a large fraction of cloud droplets and precipitation evaporates before reaching the surface, the fate of mineral dust processed in liquid water clouds remains very uncertain.
4.1.3 Seasonal effects and temperature details of MPC
clouds
Figure 6 shows that the potentially most affected cloud type, MPC, also peaks during the summer, and is about twice as likely to result from Asian trajectories as from African tra-jectories (Fig. 5). The role of mineral dust in the colder MPC cltion. Figure 7 (panels A, B, C and D) ouds is ex-pected to be much more pronounced than in WATER clouds, i.e., by causing faster glaciashows that the distribution of wa-ter saturation temperatures corresponding to the initial mois-ture content of our MPC trajectory points is mostly warmer than−20◦C in all geographic regions. At these relatively warm temperatures, it is possible for dust to participate in contact nucleation (e.g., Pitter and Pruppacher, 1973; Hobbs and Rangno, 1985; Diehl et al., 2006). Several laboratory studies show dust to be active as a condensation/immersion mode IN forT <−10◦C (Mason and Maybank, 1958; Bai-ley and Hallett, 2002; Zimmermann et al., 2008). For the minority of MPC points in Fig. 7 (panels A–D) with water saturation roughly between−40◦C<T <−20◦C, conden-sation/immersion along with deposition should be more ef-ficient than at warmer temperatures (Hoffer, 1961; Field et al., 2006; Kanji and Abbatt, 2006; Eastwood et al., 2009; Welti et al., 2009). These results are consistent with Fig. 4 (bottom panel), which shows that the moisture content of the vast majority of whole trajectories in all geographic regions is such as to lead to water condensation for−40◦C<T <0◦C and hence to maximize the impact of dust on mixed-phased clouds. Nonetheless, the exact fraction of MPC, MPC’ and MPC OSC clouds in our study should be treated with some caution due to our neglect of both mixing and condensa-tion along the trajectories. Also worth noting is that trajec-tory points reaching the mixed-phase cloud phase space (ii) of Fig. 4 must pass through the ice-saturated WARM HET cloud region (v), where the most efficient dust IN may have already been activated in deposition mode, thus eliminating these particles from participation in MPC cloud formation, as discussed next.
4.1.4 Seasonal effects and T – RHidetails of
WARM HET clouds
Figure 6 shows conditions favourable for WARM HET clouds in the Asian Taklimakan region to occur with highest frequency during spring (MAM), but also during the sum-mer (JJA) and fall (SON), coinciding exactly with the peak of dustiness in the Tarim basin (Sect. 2.1). In the Asian Gobi desert, conditions favourable for WARM HET clouds occur in MAM, but there is a JJA minimum, followed by an in-crease not only in SON, but also DJF, when dustiness is sup-pressed in the region due to snow cover. The summer min-imum in WARM HET cloud occurrence (most pronounced in the Gobi region) is likely a trade off with the increased occurrence of warmer temperature WATER clouds and sec-ondary MPC’ clouds. Outside of JJA, conditions favourable for WARM HET clouds appear throughout the year likely because there is always enough moisture to guarantee ice saturation after trajectory lifting and cooling, whereas wa-ter saturation conditions necessary for WATER and MPC’ clouds are harder to fulfil. In the African deserts, conditions favourable for WARM HET clouds are about half as likely to occur throughout the year (Table 2 and Fig. 6). In the West African region, WARM HET clouds are potentially at a minimum in JJA, which is the peak of the dust emission season. In the Bod´el´e, there is potentially a better coinci-dence with the dust source activity occurring in MAM and SON, but not with the peak in DJF. The possibility of these warm temperature pure ice clouds appearing before (below) mixed-phase clouds is not clear. Figure 7 (panels I, J, K and L) shows that in Asian regions WARM HET clouds poten-tially occur with the highest frequency for RHi<110% and
T >−20◦C, where deposition freezing is “generally” not
ob-served in laboratory studies (Field et al., 2006); however, a large number of events also occurs for higher RHiand lower
T combinations, where deposition freezing is more efficient (Knopf and Koop, 2006), especially for larger particles (Zim-mermann et al., 2008) and longer exposure times (Kanji and Abbatt, 2006). In fact, the integral over RHifrom panels I–
L of Fig. 7 (shown in panels E, F, G, H) displays a peak at −18◦C for the Asian dust regions, highlighting the fact that the colder temperature WARM HET points are as numerous as the warmer temperature points, but spread out over a larger range of RHiin panels I–L. Finally, the predicted frequency
MAM J J A SOND J F 0
0.5 1
TAKLIMAKAN
MAM J J A SOND J F 0
1 2 3
MAM J J A SOND J F 0
0.1 0.2
MAM J J A SOND J F 0
0.5 1
MAM J J A SOND J F 0
0.5 1
GOBI
MAM J J A SOND J F 0
1 2 3
MAM J J A SOND J F 0
0.1 0.2
MAM J J A SOND J F 0
0.5 1
MAM J J A SOND J F 0
0.5 1
WEST
MAM J J A SOND J F 0
1 2 3
MAM J J A SOND J F 0
0.1 0.2
MAM J J A SOND J F 0
0.5 1
Fraction of All Trajectory Points (~1.8 x10
6 / region) [%]
MAM J J A SOND J F 0
0.5 1
BODELE
MAM J J A SOND J F 0
1 2 3
MAM J J A SOND J F 0
0.1 0.2
MAM J J A SOND J F 0
0.5 1
water
mixed-phase
WARM_HET
cirrus
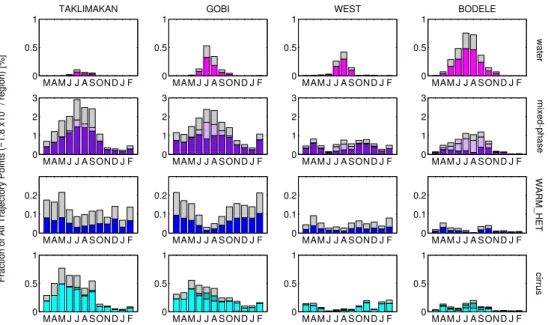
Fig. 6.Monthly breakdown of cloudy trajectory points in each geographic region (by column) and by cloud type (by row, as labelled, with details of cloud sub-types identified by color as in Fig. 5). COLD HET clouds are not shown.
4.1.5 Seasonal effects and temperature details of other
ice clouds
In contrast to WARM HET, the COLD HET cloud type is not shown in Fig. 6 because less than 42 points fall into it in any region (<8 in the Taklimakan). Similarly, the CIR-RUS cloud type comprises<437 trajectory points in any re-gion (<28 in the Taklimakan). Much more numerous (in fact the second most numerous of all non-oscillatory cloud types, except WATER in the seasonally moist Bod´el´e region) is the related CIRRUS’ type (Table 2 and Fig. 6), with CIR-RUS” and CIRRUS OSC comprising the small remainder of all our cirrus types. As was the case with other cloud types in Fig. 6, the occurrence of CIRRUS’ clouds peaks away from DJF, which is a time of low dust emission, ex-cept in the Bod´el´e; furthermore, CIRRUS’ occur more fre-quently from Asian deserts than from African deserts. CIR-RUS’ points correspond to air parcels that reached the cirrus temperature regime only after first experiencing water satu-ration in mixed-phase clouds. Figure 7 (panels E, F, G and H) shows that the water saturation temperature for the MPC clouds that precede any subsequent CIRRUS’ clouds (ob-tained after further lifting and cooling) peaks around−20◦C for the Asian deserts. However, given the distribution of sat-uration temperatures, it is reasonable to argue that a substan-tial fraction of dust IN stay inactive during MPC formation atT >−20◦C. They might either remain interstitial (becom-ing available as deposition IN dur(becom-ing a subsequent CIRRUS’ formation event), or perhaps even transform into some pre-activated form after liquid phase processing (e.g., becoming immersion nuclei, see discussion in Sect. 3.2). Laboratory studies show mixed results for pre-activation effects on
min-eral dust (M¨ohler et al., 2006; Knopf and Koop, 2006), al-though variable particle size may be an important confound-ing factor between studies. The West African region dis-plays a similar distribution of water saturation temperatures for MPC clouds preceding CIRRUS’, however, the number of CIRRUS’ points themselves is smaller by a factor of 2– 3. Lastly, in the Bod´el´e region the MPC cloud saturation temperatures are warmest of all, implying that most of the dust IN could survive nucleation scavenging in these mixed-phase clouds by remaining interstitial; however, the number of CIRRUS’ points originating from this geographic region is again small. In all geographic regions, IN would not only be lost to nucleation scavenging, but also via below-cloud scav-enging, further reducing the availability of processed/pre-activated IN for subsequent CIRRUS’ formation. Finally, we note that as with other models of its kind, ECMWF mete-orological analyses do not resolve, but rather parameterize small-scale convective mass transfer. Although there is ev-idence of very fast trajectory ascent in convective systems over the Atlantic in Fig. 3a, clearly our trajectory analysis cannot fully resolve dust transported convectively to the up-per troposphere, as was shown to be the case for African dust near Florida by Cziczo et al. (2004a). Dust transported in this manner would enhance the CIRRUS’ and CIRRUS” type but not change our overall conclusions about the lack of unpro-cessed IN for CIRRUS formation, and the prevalence of dust interactions with mixed-phase clouds.
4.1.6 Discussion
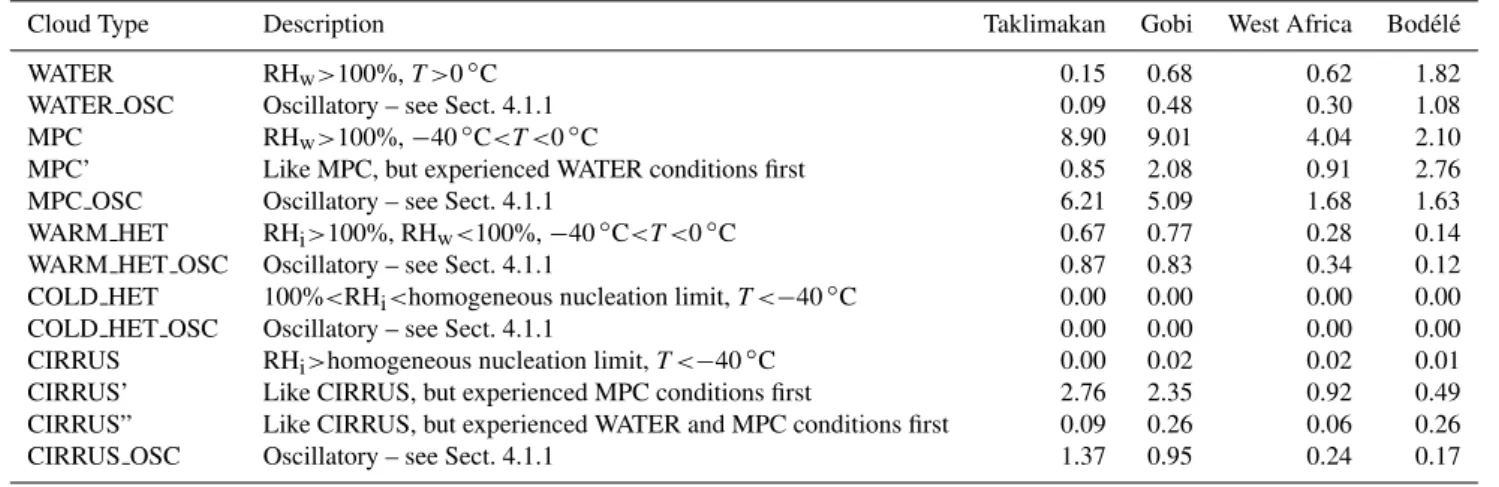
Table 2.Breakdown of cloudy trajectory points in each region (last two lines in Table 1) as a percent fraction of all trajectory points in each region (∼1.8×10⁶). (This is Fig. 5, in table form.)
Cloud Type Description Taklimakan Gobi West Africa Bod´el´e
WATER RHw>100%,T >0◦C 0.15 0.68 0.62 1.82
WATER OSC Oscillatory – see Sect. 4.1.1 0.09 0.48 0.30 1.08
MPC RHw>100%,−40◦C<T <0◦C 8.90 9.01 4.04 2.10
MPC’ Like MPC, but experienced WATER conditions first 0.85 2.08 0.91 2.76
MPC OSC Oscillatory – see Sect. 4.1.1 6.21 5.09 1.68 1.63
WARM HET RHi>100%, RHw<100%,−40◦C<T <0◦C 0.67 0.77 0.28 0.14
WARM HET OSC Oscillatory – see Sect. 4.1.1 0.87 0.83 0.34 0.12
COLD HET 100%<RHi<homogeneous nucleation limit,T <−40◦C 0.00 0.00 0.00 0.00
COLD HET OSC Oscillatory – see Sect. 4.1.1 0.00 0.00 0.00 0.00
CIRRUS RHi>homogeneous nucleation limit,T <−40◦C 0.00 0.02 0.02 0.01
CIRRUS’ Like CIRRUS, but experienced MPC conditions first 2.76 2.35 0.92 0.49
CIRRUS” Like CIRRUS, but experienced WATER and MPC conditions first 0.09 0.26 0.06 0.26
CIRRUS OSC Oscillatory – see Sect. 4.1.1 1.37 0.95 0.24 0.17
Fig. 7.Distribution of temperature at water saturation for trajectory points classified as MPC(A, B, C, D)and CIRRUS’(E, F, G, H)clouds. Frequency of occurrence of WARM HET cloud points(I, J, K, L)in the RHivs.T space, whose integral over RHiis shown in (E, F, G, H) using theTsataxis for brevity. Each geographic region is shown in a separate column, as labelled.
mineral dust and mixed-phase clouds, as well as a non-negligible potential for dust IN mediating the formation of relatively warm, pure ice clouds (WARM HET), which, if they occur at all, we predict to be found in air parcels prior to the formation of mixed-phase clouds (below their cloud base). We found the potential for unprocessed/uncoated dust to affect “classical” cirrus-forming regions to be negligible, with interactions only possible between processed dust and CIRRUS’ clouds (after previous mixed-phase cloud occur-rence). The details of dust IN activity in a given temperature and relative humidity environment depend on several factors, including dust particle mineralogy, size, chemical coatings,
210 220 230 240 250 260 270 280 80
90 100 110 120 130 140 150 160 170 180
(i) water (ii) mixed-phase (iii) ice
(iii) ice
(iv) COLD_HET
(v) WARM_HET
(vi) clear air
Temperatre [K]
RH
ice
[%]
RHw = 100%
Homogeneous nucleation limit 200 nm sulphate aerosols
SD (0.3-0.5 m; onset) [Moehler et al., 2006] SD (0.3-0.5 m; 0.5%) [Field et al., 2006] SD (0.5-5.0 m; onset) [Kanji and Abbatt, 2006] AD (0.3-0.5 m; onset) [Moehler et al.,2006] AD (0.3-0.5 m; 0.5%) [Field et al., 2006] ATD (0.3-0.5 m; onset) [Moehler et al., 2006] ATD (1-10 m; onset) [Knopf and Koop, 2006] Kao (0.4 m; 1%) [Welti et al., 2009] Kao (0.8 m; 1%) [Welti et al., 2009] Kao (<10um m; 2-3% ) [Zimmerman et al., 2008] Ill (0.4 m; 1%) [Welti et al., 2009] Ill (0.8 m; 1%) [Welti et al., 2009] Ill (10 m; 2-3%) [Zimmermann et al., 2008]
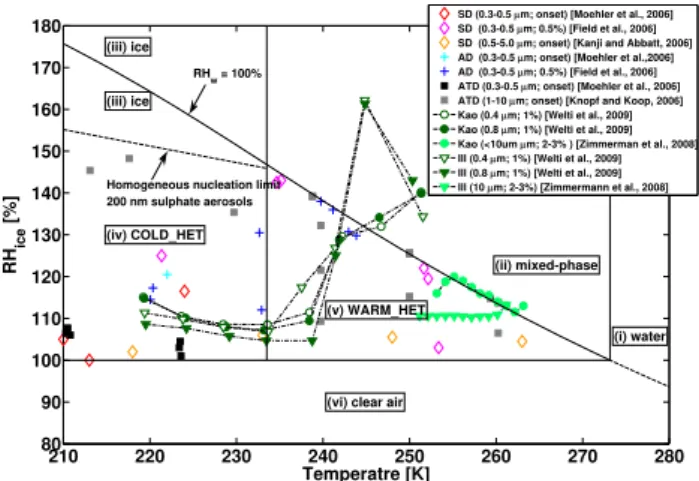
Fig. 8.Phase diagram as in Fig. 4, showing relative humidities mea-sured in laboratory experiments addressing heterogeneous ice nu-cleation on naturally occurring, pure and refined mineral substrates (SD = Saharan Dust; AD = Asian Dust; ATD = Arizona Test Dust; Kao = Kaolinite; Ill = Illite) and using a number of techniques. The legend indicates the type and diameter of the particles studied (re-ferring to a size distribution in the work of M¨ohler et al., 2006 and Field et al., 2006) and the criterion for the RHirecorded in or de-rived from the experiments (either for freezing onset or a minimum percentage of ice-activated particles, as indicated). Techniques rep-resented include AIDA chamber (M¨ohler et al., 2006; Field et al., 2006), continuous flow diffusion chamber (Welti et al., 2009), and environmental scanning electron microscope (Zimmermann et al., 2008). Only single-nucleation-event data from Field et al. (2006) are shown.
is not a region that is sampled by our trajectories, i.e. there is no direct transport pathway for ice nuclei from deserts to the COLD HET region. Stated differently, while these lab-oratory results are for uncoated (deposition) ice nuclei, any background IN in the COLD HET region will have to have experienced deep convection and/or cloud processing, with the associated coating or pre-activation.
The situation is less understood in region (v), which rep-resents WARM HET clouds, and which is sampled by our trajectories throughout the year, i.e. there is a direct transport pathway for ice nuclei to these regions from desert sources. The scatter in laboratory data in region (v) shown in Fig. 8 does not allow us to answer the question of “How important are heterogeneously nucleated WARM HET clouds?” with certainty. Moreover, at warmer temperatures laboratory data does not agree on whether ice is formed directly from the vapour (deposition nucleation) or through an intermediate liquid stage (immersion-freezing or condensation-freezing). In the follow-up laboratory study to Field et al. (2006), Con-nolly et al. (2009) describe only some deposition activity for T <−16◦C using 0.4 µm Saharan dust particles, however, in their conclusions they indicate that warmer temperature de-position nucleation could have been underestimated in their study due to a lack of interstitial particles capable of acting as
deposition IN. Using larger Saharan dust particles and longer experiments, Kanji and Abbatt (2006) report deposition nu-cleation at 263 K. Lastly, using large and atmospherically abundant illite particles, but also using larger ice-activated fractions (2–3%), Zimmermann et al. (2008) report ice nu-cleation at water subsaturated conditions forT <260 K.
Finally turning to field measurements, using a ground-based LIDAR system, Sassen (2005) reports the only mea-surements of desert dust serving as a deposition IN and cre-ating ice clouds “at modest supersaturations and tempera-tures”. The dust was Asian in origin in that study. Con-versely, during a two month field campaign in southern Mo-rocco (near the Saharan desert), Ansmann et al. (2008) ob-serve that the presence of a high number of dust particles (1–20 cm−3)does not result in the production of ice
parti-cles at the top of the dust layer without temperature reaching about −20◦C and without the liquid condensed phase ap-pearing first, although this may be due to the fact that less than one in 1000 dust particles will be active at−20◦C. In
a follow-up field campaign in Cape Verde (tropical Atlantic, downstream of Saharan dust sources), Ansmann et al. (2009) analyzed more than 200 different altocumulus layers, again finding that 99% of altocumulus layers showed a liquid cloud top (the region in which ice nucleation begins). However, limited conclusions can be made about which specific nucle-ation mechanisms were in opernucle-ation given that the cloud ob-servations were separated from the primary levels of Saharan dust.
In another ground-based LIDAR study in Japan, Sakai et al. (2004) describe measurements of ice production at the margins of a dry and depolarizing airmass that originated over the Gobi desert (Sakai et al., 2002); ice appears to have been first produced at∼7.5 km altitude with RHinear or just
over 100% and the temperature at the top of the ice cloud layer at ∼−35◦C, which just falls into our WARM HET cloud region (v), being too warm for the homogeneous freez-ing of pure water droplets and background sulphate solution droplets. The authors present evidence that moisture for the ice production was supplied by the intersection of the dry dust layer with a warm conveyor belt. While ice could have formed by deposition nucleation at the reported conditions, the authors note that measurement uncertainties cannot ex-clude other freezing modes.
4.2 Geographic extent of most significant dust/cloud
interactions
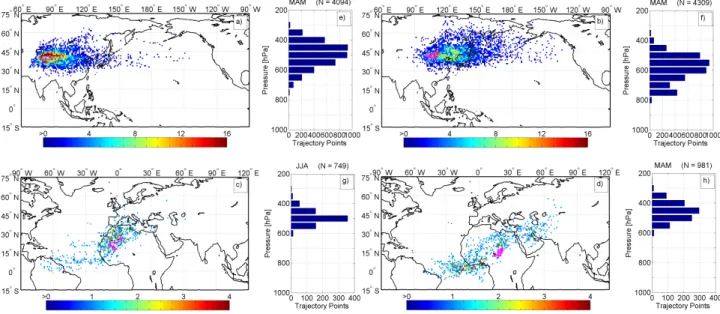
very active in winter, our trajectory analysis showed the least cloud formation during this time, hence we show the Bod´el´e in MAM for ease of comparison with the Asian deserts.)
The number of trajectory points classified as MPC clouds is shown in Fig. 9. There are approximately four times as many points fulfilling the MPC criteria in Asian regions as compared to African regions. Note that the color bars were allowed to saturate close to dust sources (shown in ma-genta) and also note that the scale changes between Asia and Africa in panels a and b vs. c and d. While Asian MPC clouds are found eastwards of the source deserts, African MPC clouds show the influence of both SW and NE trans-port patterns. Transtrans-port from the Taklimakan is more nar-rowly confined during March and April but extends to lati-tudes north of 45◦N in May, while transport from the Gobi
spans the full range of latitudes throughout MAM (monthly details not shown). In both Asian deserts, the pressure of MPC trajectory points decreases from March to May (not shown), but the pressure of Taklimakan MPC points is on average lower than the pressure of Gobi MPC points by ap-proximately 100 hPa (panels e and f). In Africa, transport from the Bod´el´e shows a NE peak in April and a SW peak in May, while transport from West Africa shows a similar strength of NE and SW transport in all summer months, in-creasing for both directions from June to August (monthly details not shown). The pressure of Bod´el´e MPC points is ap-proximately 100 hPa lower than the pressure of West African MPC points, likely due to a larger fraction of Bod´el´e MPC points being associated with deep convection in the intertrop-ical convergence zone (ITCZ). Note that the pressure of Tak-limakan MPC points, panel e is similar to that of Bod´el´e MPC points, panel h), but with a sharper peak at 400 hPa. Fi-nally, we note again that the Taklimakan is a source of contin-uous, low-grade dust emissions (Wang et al., 2008) through-out much of the year, except winter (DJF). While not shown for brevity, JJA and SON Taklimakan MPC points show a similar geographic extent to MAM, with a minimum in trans-Pacific transport in June and July, coinciding with the season of the slowest zonal flow. MPC points occur near western North America at lower pressures (∼500 hPa) in September and October, and typically at∼400 hPa in spring and sum-mer.
Figure 10 shows the geographic extent and pressure of tra-jectory points classified as WARM HET clouds from all dust source regions. The patterns are similar to MPC clouds, with approximately four times more WARM HET points originat-ing from Asian than from African deserts, and with Tak-limakan WARM HET points occurring at lower pressures than Gobi WARM HET points. As with MPC points, Tak-limakan transport is more zonally confined than Gobi trans-port, except in May (not shown), which is consistent with the lower pressure (higher altitude) of Taklimakan transport, closer to the jet stream. However, WARM HET points in general occur at slightly higher pressures (lower altitudes) than MPC points, where water saturation has not yet been
reached. Finally, compared to MPC points in Fig. 9, there is less Asian WARM HET points occurring in western North America, and there is less NE transport from West African dust sources.
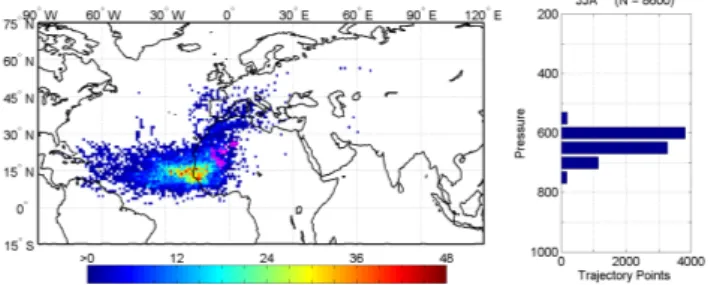
The geographic extent of WATER clouds during the peak of the dust season (JJA) is shown for West Africa in Fig. 11. (Although Fig. 6 shows an overall peak in WATER clouds in the Bod´el´e in JJA, this is a time when dust emission is suppressed in this region, precisely because of the ongoing wet season.) Although mineral dust is a relatively poor cloud condensation nucleus, the large quantities emitted from West Africa and advected over the Atlantic (as shown) will cer-tainly have some impact on warm clouds. Figure 11 also shows an influence extending to southern and western Eu-rope (primarily in August, though this month is not shown by itself). In contrast, any effect of the Bod´el´e on WATER clouds (again not shown) is confined to sub-Saharan latitudes by the trade winds; this effect is expected during spring and fall, when the Bod´el´e source is active. WATER clouds were not shown in Asian regions due to the small magnitude of the effect and its occurrence outside of the peak dust emis-sion season.
Lastly, Fig. 12 shows CIRRUS’ clouds during the peak of the dust emission season (MAM) in the Taklimakan, which is the region of greatest CIRRUS’ incidence (Fig. 6) The large potential geographic reach of CIRRUS’ clouds originating from the Taklimakan is evident. We reiterate the uncertain-ties associated with this cloud type, which occurs subsequent to MPC formation after further lifting and cooling: as dis-cussed previously, the fate of mineral dust in the preceding mixed-phase clouds is unclear and it is likely that a substan-tial fraction is lost due to in-cloud ice nucleation scavenging and below-cloud snow and rain scavenging. The spatial pat-terns are similar between the Taklimakan and the Gobi (not shown); moreover, the patterns are similar between MAM and JJA in the Taklimakan, when dust emission continues at a low level, as discussed above.
4.3 Ascent characteristics by dust region
The numerical nature of our study permits us to assess the characteristics of ascent of trajectories originating from each dust region. For Asian dust sources in particular, it is of-ten stated in the literature that dust emitted from the Gobi desert travels at altitudes<3 km 90% of the time, while dust emitted from the Taklimakan desert is easily entrained to al-titudes>5 km (e.g. Sun et al., 2001). African dust is always thought to travel at low altitudes in the Saharan Air Layer (Karyampudi et al., 1999). While the mixed boundary layer depth above the hotter African continent routinely reaches 5 km, as stated earlier the melting level and the tropopause altitude above this low-latitude desert are correspondingly higher than in Asia.
Fig. 9.Absolute number of trajectory points (in 1◦×1◦bins) classified as MPC clouds in trajectories originating from (a) Taklimakan, (b) Gobi, (c) West Africa and (d) Bod´el´e. Respective pressure [hPa] distributions are shown in panels(a–h). All panels show spring (MAM), except for (c) and (g), which show summer (JJA). Trajectory starting points are shown in magenta, with only perimeter points shown in the Taklimakan, for clarity.
Fig. 10.Same as Fig. 9, except for WARM HET trajectory points.
770 hPa to a number of different lower pressures (Fig. 13). We limited the investigation to March-April-May trajecto-ries, except for West Africa, where we also evaluated the June-July-August period, which coincides with the peak of the dust emission season. We find that the Asian trajectories show a clear pattern of higher ascent than the African trajec-tories. This is consistent with the results of the case studies shown in Sect. 2.2. While Taklimakan trajectories always ascend to a higher altitude than Gobi trajectories, the latter
Fig. 11. WATER cloud points originating from West African dust sources (shown in magenta) in JJA.
(not shown) and found that nearly 40% of trajectories as-cend to 300 hPa in JJA, while only∼10% ascend to the same pressure level in SON, with nearly no trajectories exhibiting ascent in DJF. Although we use extremely high resolution meteorological analyses, the ECMWF model still parameter-izes turbulent processes as well as sub-grid scale convection, and our analysis may underestimate both the ascent of bare mineral dust by clear-air turbulent processes and the ascent of cloud-processed mineral dust via convective systems. A more detailed microphysical study is required to determine whether the under-estimate of convective dust ascent is bal-anced by the accompanying wet removal processes.
5 Summary and outlook
The availability of non-cloud processed mineral dust ice nu-clei for interaction with warm and cold clouds was investi-gated using ECMWF meteorological analyses and∼60 000 trajectory calculations originating from each of four major dust emitting regions in the world. We simulated trans-port trajectories for the duration of 2007, neglecting dust emission and deposition processes. Dust-bearing trajecto-ries were assumed to be those coinciding with known dust emission seasons. The specific humidity at each trajectory’s starting point was transported in a Lagrangian manner and relative humidities with respect to water and ice were cal-culated in 6-hr steps downstream, allowing us to estimate the formation of liquid, mixed-phase and ice clouds. The potential for uncoated mineral dust to affect cirrus clouds was found to be negligible, but a significant number of tra-jectories reached cirrus-forming regions after processing in mixed-phase clouds. This indicates that mineral dusts in cir-rus forming regions are most relevant as immersion mode ice nuclei and perhaps also as deposition mode ice nuclei that have been pre-activated by one or more cycles of nu-cleation and evaporation within clouds, without having been scavenged to the surface.
By far the biggest potential impact of mineral dust was found to be on mixed-phase clouds themselves. However, the details of these interactions will depend on the effi-ciency of specific ice formation mechanisms in operation in
Fig. 12.CIRRUS’ cloud points originating from Taklimakan desert (perimeter shown in magenta) in MAM.
a given relative humidity/temperature environment. This is also the case for a small but non-negligible number of tra-jectory points which passed through ice-saturated (but water-subsaturated) regions too warm for homogeneous nucleation, where “warm” cirrus clouds (WARM HET) may be able to form by deposition freezing on dust IN. We reviewed some recent laboratory studies of ice nucleation at both cold and warm temperatures and we recommend that efforts con-tinue to characterize both the ice formation mode (deposi-tion nuclea(deposi-tion, immersion-freezing, condensa(deposi-tion-freezing, and contact nucleation) and ice production rates as a function of mineral particle size and composition, taking into account sample generation and dispersion methods (wet/dry), as well as the composition and thickness of atmospherically relevant coatings (e.g., water, sulphuric acid, nitric acid, ammonium sulphate, and dominant organic species). Given its poten-tial role in efficient dehydration of the upper troposphere as well as in cloud seeding processes below, the variable IN ef-ficiency of dust samples used in different laboratory experi-ments is important to reconcile, especially at warm tempera-tures. Finally, laboratory measurements of the effect of warm and mixed-phase cloud processing on bare mineral dust are necessary to reduce uncertainties in mineral dust concentra-tions and cloud lifetimes and distribuconcentra-tions.
0 10 20 30 40 50 60
200 250 300 350 400 450 500
% o f M -A -M t ra je ct o ri e s a sc e n d in g t o m in im u m p re ss u re
MINIMUM PRESSURE [hPa] TAKLIMAKAN
GOBI
GOBI (WESTERN)
WEST Africa
WEST Africa (JJA)
BODELE 0 1 2 3 4 5 6 7 8 9 10
200 250 300 350 400 450 500
R A T IO o f TA K LI M A K A N t o o the r dus t e m it ti ng r e g io ns
MINIMUM PRESSURE [hPa]
TAKLIMAKAN / GOBI
TAKLIMAKAN / GOBI (WESTERN)
TAKLIMAKAN / WEST Africa (JJA)
TAKLIMAKAN / BODELE
Fig. 13.Top panel shows percentage of March-April-May trajectories ascending to a given minimum pressure (hPa) from a starting pressure of 770 hPa in the four geographic regions in our study, plus the western Gobi region, which is otherwise not shown in our results due to strong similarities with the eastern Gobi region. West Africa is also shown for June-July-August, when the peak of the dust emission season occurs. The bottom panel shows the ratio of ascending Taklimakan trajectories to those ascending in other dust emitting regions.
All effects on cold clouds were bigger from the Taklimakan and Gobi deserts in Asia than from both dust sources in Africa, despite the former being climatologically a much smaller dust emission source. As such, further field cam-paigns should include the Taklimakan desert and use instru-mentation capable of resolving single particle microphysical processes (ice nucleation as well as warm and cold cloud pro-cessing) in real time and in situ, in addition to other comple-mentary in situ, ground-based and remote sensing methods. The ability to resolve the ice formation mechanism is neces-sary in order to verify warm temperature deposition freezing processes, and hence the existence of WARM HET clouds. While the Taklimakan is an interesting region to explore, the issue of the effects of dust on tropical convective transport and cyclone formation remains significant and complex (e.g., Evan et al., 2006).
When a wider range of data is available for the ice nu-cleation behaviour of atmospherically relevant mineral dust particles (bare and coated), the Lagrangian trajectory analy-sis described in this study can be extended to include micro-physical processes involved in wet deposition by ice crystals and cloud droplets. Moreover, the approach can be used to study trajectories originating at various heights, especially in the deep Saharan atmospheric boundary layer. Thus ex-panded, the method would be ideally suited to simulate single case studies measured in the field and to test microphysical parameterizations for use in global climate models.
Acknowledgements. We thank D. Brunner for an introduction
to LAGRANTO modelling, M. Sprenger for assistance with FORTRAN and Matlab programming, and S. Ferrachat for computational support. Helpful discussions are acknowledged in particular with D. Cziczo, and also with M. Baker, C. Hoose,
U. Krieger, C. Marcolli, P. Spichtinger, T. Storelvmo, M. Taddeo, I. Tegen, H. Wernli and B. Zobrist. Extensive use is made of meteorological analyses made available by the ECMWF in this work carried out primarily at ETH and supported by a Marie Curie Incoming International Fellowship awarded by the European Commission. Work at Dalhousie was supported by the Canadian Foundation for Climate and Atmospheric Science through the Cloud Aerosol Feedbacks on Climate network.
Edited by: Y. Balkanski
References
Andreae, M. O. and Rosenfeld, D.: Aerosol-cloud-precipitation interactions. Part 1. The nature and sources of cloud-active aerosols, Earth. Sci. Rev., 89, 13–41, 2008.
Ansmann, A., Mattis, I., M¨uller, D., Wandinger, U., Rad-lach, M., Althausen, D., and Damoah, R.: Ice formation in Saharan dust over central Europe observed with temper-ature/humidity/aerosol Raman lidar, J. Geophys. Res., 110, D18S12, doi:10.1029/2004JD005000, 2005.
Ansmann, A., Tesche, M., Althausen, D., et al.: Influence of Saha-ran dust on cloud glaciation in southern Morocco during the Sa-haran Mineral Dust Experiment, J. Geophys. Res., 113, D04210, doi:10.1029/2007JD008785, 2008.
Ansmann, A., Tesche, M., Seifert, P., Althausen, D., Engelmann, R., Fruntke, J., Wandinger, U., Mattis, I., and Muller D.: Evo-lution of the ice phase in tropical altocumulus: SAMUM lidar observations over Cape Verde, J. Geophys. Res., 114, D17208, doi:10.1029/2008JD011659, 2009.
Bailey, M. and Hallett, J.: Nucleation effects on the habit of vapour grown ice crystals from−18 to−42◦C, Q. J. Roy. Meteorol. Soc., 128, 1461–1483, 2002.
Cakmur, R. V., Miller, R. L., Perlwitz, J., Geogdzhayev, I. V., Gi-noux, P., Koch, D., Kohfeld, K. E., Tegen, I., and Zender, C. S.: Constraining the magnitude of the global dust cycle by minimiz-ing the difference between a model and observations, J. Geophys. Res., 111, D06207, doi:10.1029/2005JD005791, 2006.
Connolly, P. J., M¨ohler, O., Field, P. R., Saathoff, H., Burgess, R., Choularton, T., and Gallagher, M.: Studies of heterogeneous freezing by three different desert dust samples, Atmos. Chem. Phys., 9, 2805–2824, doi:10.5194/acp-9-2805-2009, 2009. Croft, B., Lohmann, U., Martin, R. V., Stier, P., Wurzler, S.,
Feichter, J., Hoose, C., Heikkil¨a, U., van Donkelaar, A., and Ferrachat, S.: Influences of in-cloud aerosol scavenging parameterizations on aerosol concentrations and wet deposi-tion in ECHAM5-HAM, Atmos. Chem. Phys., 10, 1511–1543, doi:10.5194/acp-10-1511-2010, 2010.
Cziczo, D. J., Murphy, D. M., Hudson, P. K., and Thomson, D. S.: Single particle measurements of the chemical composition of cirrus ice residue during CRYSTAL-FACE, J. Geophys. Res., 109, D04201, doi:10.1029/2003JD004032, 2004a.
Cuesta, J., Marsham, J. H., Parker, D. J., and Flamant, C.: Dynami-cal mechanisms controlling the vertiDynami-cal redistribution of dust and the thermodynamic structure of the West Saharan atmospheric boundary layer during summer, Atmos. Sci. Lett., 10(1), 34–42, doi:10.1002/asl.207, 2009.
Cziczo, D. J., DeMott, P. J., Brooks, S. D., Prenni, A. J., Thom-son, D. S., Baumgardner, D., WilThom-son, J. C., Kreidenweis, S. M., and Murphy, D. M.: Observations of organic species and atmospheric ice formation, Geophys. Res. Lett., 31, L12116, doi:10.1029/2004GL019822, 2004b.
DeMott, P. J., Cziczo, D. J., Prenni, A. J., Murphy, D. M., Krei-denweis, S. M., Thomson, D. S., Borys, R., and Rogers, D. C.: Measurements of the concentration and composition of nu-clei for cirrus formation, P. Natl. Acad. Sci., 100, 14655–14660, doi:10.1073/pnas.2532677100, 2003a.
DeMott, P. J., Sassen, K., Poellot, M. R., Baumgardner, D., Rogers, D. C., Brooks, S. D., Prenni, A. J., and Kreidenweis, S. M.: African dust aerosols as atmospheric ice nuclei, Geophys. Res. Lett., 30(14), 1732, doi:10.1029/2003GL017410, 2003b. Denman, K. L., Brasseur, G., Chidthaisong, A., Ciais, P., Cox, P.
M., Dickinson, R. E., Hauglustaine, D., Heinze, C., Holland, E., Jacob, D., Lohmann, U., Ramachandran, S., da Silva Dias, P. L., Wofsy, S. C., and Zhang, X.: Couplings Between Changes in the Climate System and Biogeochemistry, in: Climate Change 2007: The Physical Science Basis. Contribution of Working Group I to the Fourth Assessment Report of the Intergovernmental Panel on Climate Change, edited by: Solomon, S., Qin, D., Manning, M., Chen, Z., Marquis, M., Averyt, K. B., Tignor, M., and Miller, H. L., Cambridge University Press, Cambridge, United Kingdom and New York, NY, USA, 2007.
Diehl, K., Simmel, M., and Wurzler, S.: Numerical sensitivity stud-ies on the impact of aerosol propertstud-ies and drop freezing modes on the glaciation, microphysics, and dynamics of clouds, J. Geo-phys. Res., 111, D07202, doi:10.1029/2005JD005884, 2006. Eastwood, M. L., Cremel, S., Gehrke, C., Girard, E., and Bertram,
A. K.: Ice nucleation on mineral dust particles: Onset condi-tions, nucleation rates and contact angles, J. Geophys. Res., 113,
D22203, doi:10.1029/2008JD010639, 2008.
Eastwood, M. L., Cremel, S., Wheeler, M., Murray, B. J., Girard, E., and Bertram, A. K.: Effects of sulfuric acid and ammonium sulfate coatings on the ice nucleation proper-ties of kaolinite particles, Geophys. Res. Lett., 36, L02811, doi:10.1029/2008GL035997, 2009.
Engelstaedter, S., Tegen, I., and Washington, R.: North African dust emission and transport, Earth-Sci. Rev., 79, 73–100, 2006. Evan, A. T., Dunion, J., Foley, J. A., Heidinger, A. K., and Velden,
C. S.: New evidence for a relationship between Atlantic tropi-cal cyclone activity and African dust outbreaks,, Geophys. Res. Lett., 33, L19813, doi:10.1029/2006GL026408, 2006.
Field, P. R., M¨ohler, O., Connolly, P., Kr¨amer, M., Cotton, R., Heymsfield, A. J., Saathoff, H., and Schnaiter, M.: Some ice nucleation characteristics of Asian and Saharan desert dust, At-mos. Chem. Phys., 6, 2991–3006, doi:10.5194/acp-6-2991-2006, 2006.
Forster, P., Ramaswamy, V., Artaxo, P., Berntsen, T., Betts, R., Fa-hey, D. W., Haywood, J., Lean, J., Lowe, D. C., Myhre, G., Nganga, J., Prinn, R., Raga, G., Schulz, M., and Van Dorland, R.: Changes in Atmospheric Constituents and in Radiative Forcing, in: Climate Change 2007: The Physical Science Basis. Contri-bution of Working Group I to the Fourth Assessment Report of the IPCC, edited by: Solomon, S., Qin, D., Manning, M., Chen, Z., Marquis, M., Averyt, K. B., Tignor, M., and Miller, H. L., Cambridge University Press, Cambridge, United Kingdom and New York, NY, USA, 2007.
Herich, H., Tritscher, T., Wiacek, A., Gysel, M., Weingartner, E., Lohmann, U., Baltensperger, U., and Cziczo, D. J.: Water up-take of clay and desert dust aerosol particles at sub- and super-saturated water vapor conditions, Phys. Chem. Chem. Phys., 11, 7804–7809, doi:10.1039/b901585j, 2009.
Hobbs, P. V. and Rangno, A. L.: Ice particle concentrations in clouds, J. Atmos. Sci., 42, 2523–2549, 1985.
Hoffer, T. E.: A laboratory investigation of droplet freezing, J. Me-teorol., 18, 766–778, 1961.
Holton, J. R., Haynes, P. H., McIntyre, M. E., Douglass, A. R., Rood, R. B., and Pfister, L.: Stratosphere-Troposphere Ex-change, Rev. Geophys., 33(4), 403–439, 1995.
Hoose, C., Lohmann, U., Erdin, R., and Tegen, I.: The global in-fluence of dust mineralogical composition on heterogeneous ice nucleation in mixed-phase clouds, Environ. Res. Lett., 3, 025003, doi:10.1088/1748-9326/3/2/025003, 2008.
Isono, K, Komabayasi, M., and Ono, A.: The nature and the origin of ice nuclei in the atmosphere, J. Met. Soc. Jpn., 37(6), 211– 233, 1959.
Iwasaka, Y., Shi, G.-Y., Yamada, M., Matsuki, A., Trochkine, D., Kim, Y. S., Zhang, D., Nagatani, T., Shibata, T., Nagatani, M., Nakata, H., Shen, Z., Li, G., and Chen, B.: Importance of dust particles in the free troposphere over the Taklamakan Desert: Electron microscopic experiments of particles collected with a balloonborne particle impactor at Dunhuang, China, J. Geophys. Res., 108(D23), 8644, doi:10.1029/2002JD003270, 2003. Kanji, Z. A. and Abbatt, J. P. D.: Laboratory studies of ice
formation via deposition mode nucleation onto mineral dust and n-hexane soot samples, J. Geophys. Res., 111, D16204, doi:10.1029/2005JD006766, 2006.