www.adv-geosci.net/30/11/2011/ doi:10.5194/adgeo-30-11-2011
© Author(s) 2011. CC Attribution 3.0 License.
Geosciences
Local patterns and trends of the Standard Precipitation Index in
southern Portugal (1940–1999)
A. C. Costa
ISEGI, Universidade Nova de Lisboa, Lisbon, Portugal
Received: 28 October 2010 – Revised: 18 February 2011 – Accepted: 10 March 2011 – Published: 9 May 2011
Abstract.This paper analyzes the yearly changes in precip-itation from 1940 to 1999 on local and regional scales over the southern region of continental Portugal, which has large areas threatened by desertification. The Standard Precipita-tion Index (SPI) time series with the 12-month time scale is calculated for 43 meteorological stations. A geostatistical approach is used to evaluate the temporal dynamics of the spatial patterns of precipitation. The spatial homogeneity of the SPI is evaluated for each decade. Afterwards, a geosta-tistical simulation algorithm (direct sequential simulation) is used to produce 100 equiprobable maps of the SPI for each year. This gridded data set (6000 maps with 800 m×800 m grid cells) is then used to produce yearly scenarios of the SPI from 1940 to 1999, and uncertainty evaluations of the produced scenarios. The linear trend of SPI values over the sixty years period is calculated at each grid cell of the scenar-ios’ maps using a nonparametric estimator. Wilcoxon-Mann-Whitney one-sided tests are used to compare the local me-dian of the SPI in 1940/1969 with its meme-dian in 1970/1999. Results show that moderate drought conditions occur fre-quently over the study region, except in the northwest coast. Severe drought frequency patterns are found in areas of the centre and southeast regions. A significant trend towards dry-ing occurs in the centre region and in the northeast. Con-sidering the amount of water consumption and irrigation al-ready required in some municipalities, water shortage due to drought is a viable threat in most of the Alentejo region if those local trends persist.
Correspondence to:A. C. Costa ([email protected])
1 Introduction
The spatial, seasonal and inter-annual variability of rainfall follows a complex pattern in Mediterranean regions, such as the south of Portugal. These areas are subject not only to droughts, but also to flooding and erosion phenomena caused by intensive rainfall. Extreme precipitation events such as these have been raising concern about the risks of land degra-dation and desertification (L´azaro et al., 2001; Costa et al., 2008). Furthermore, the susceptibility map of desertification of Portugal’s National Action Programme to Combat Deser-tification shows that, under the mean climatic regime eval-uated, the south of the country has extensive areas highly vulnerable to desertification (Ros´ario, 2004). Accordingly, research on the extent of dryness and space-time patterns of extreme precipitation is an important contribution to evaluate desertification dynamics in this region.
1
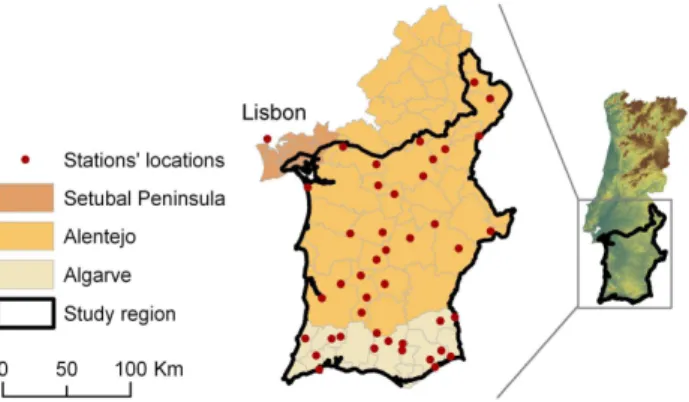
Fig. 1. Study region in the south of Portugal and meteorological stations’ locations.
The SPI has been widely used for drought analysis in many countries/regions such as America (Logan et al., 2010), Africa (Ntale and Gan, 2003) and Europe (Lloyd-Hughes and Saunders, 2002; Vicente-Serrano, 2006). Advantages and weaknesses of the SPI are discussed by Lloyd-Hughes and Saunders (2002) and Logan et al. (2010). A few stud-ies show the appropriateness of using the SPI to characterize droughts in Alentejo (Paulo et al., 2003; Paulo and Pereira, 2006), which is a region located in the central portion of the study domain (Fig. 1). Other studies analyzing the SPI in southern regions of Portugal focus on the stochastic proper-ties of the time series for predicting drought class transitions using Markov chains and log-linear models in a few moni-toring stations scattered over the region (Paulo et al., 2005; Moreira et al., 2006).
This study aims at analyzing yearly changes in SPI time series from 1940 to 1999 on local and regional scales over the southern region of continental Portugal. The 12-month SPI is calculated for 43 rainfall stations and a stochastic geo-statistical approach is used to produce a set of equally proba-ble yearly precipitation scenarios for the region. Changes in the spatial patterns of the SPI are analyzed, and uncertainty is assessed.
2 Data and methods
2.1 Study region and precipitation data
The study domain (Fig. 1) is defined by the southern river basins of continental Portugal, such as the Guadiana River that holds the largest Portuguese dam (Alqueva). In the northeast part it includes the Set´ubal peninsula, the centre corresponds to the Alentejo region, and the southern region is named Algarve. The climate regime, typically Mediter-ranean, is characterized by a dry and very hot summer and a very irregular distribution of precipitation, both in time and space, with very intense flood peaks and frequent drought periods. The heaviest and most frequent extreme
precipita-tion events occur in the Algarve region (Costa et al., 2008, Fragoso and Gomes, 2008). The Alentejo area is mainly an agro-silvo-pastoral region and the most affected by scarce precipitation, little runoff and water availability (Paulo et al., 2003; Santo et al., 2005).
Each of the 43 monitoring stations used (Fig. 1) has records of at least 30 years of daily precipitation amounts during the period from 1940 to 1999. Most of them were extracted from the National System of Water Resources In-formation (SNIRH – Sistema Nacional de Informac¸˜ao de Re-cursos H´ıdricos) database (http://snirh.inag.pt, access: Jan-uary 2004), and three of them (Beja, Lisboa Geof´ısica and Tavira) were compiled from the European Climate As-sessment (ECA) dataset (http://eca.knmi.nl, access: January 2004). Each station series data was previously quality con-trolled and comprehensively studied for homogeneity (Costa and Soares, 2009a, 2009b). Although the Lisboa Geof´ısica station is located outside the study region (Lisbon in Fig. 1), its data were also used in order to improve the SPI estimates over the northeast part of the study area.
2.2 SPI calculation
The SPI is computed by fitting a probability density function to the frequency distribution of precipitation summed over the desired time scale. This is performed separately for each period/month and for each location in space. Each probabil-ity densprobabil-ity function is then transformed into the standardized normal distribution (z-distribution). In this study the SPI was calculated on the 12-month time scale (for the end of Decem-ber) which reflects long-term precipitation patterns.
Lloyd-Hughes and Saunders (2002) describe in detail the calculation of SPI, which is outlined here. Those authors also tested the standardization procedure (probability trans-formation) assuming normal, log–normal, and gamma statis-tics for precipitation, and concluded that the gamma distribu-tion provides the best model for describing monthly precipi-tation over most of Europe, especially at the 12-month scale. Similarly to Paulo et al. (2005) and Moreira et al. (2006), the two-parameter gamma distribution was used to compute the SPI for stations located in the south of continental Portugal. The probability density function is defined as
g(x)= 1
βαŴ(α)x
α−1e−x/β forx >0, (1)
Table 1.Classification scale for the SPI values and corresponding event probabilities (McKee et al., 1993; Lloyd-Hughes and Saun-ders, 2002).
Class Description of state SPI values Probability (%)
1 Extreme drought SPI≤ −2 2.3 2 Severe drought −2<SPI≤ −1,5 4.4 3 Moderate drought −1.5<SPI≤ −1 9.2 4 Near normal −1<SPI<1 68.2 5 Moderately wet 1≤SPI<1.5 9.2 6 Severely wet 1.5≤SPI<2 4.4 7 Extremely wet SPI≥2 2.3
station in question. Since the gamma distribution is unde-fined atx=0, and the precipitation distribution may contain zeros within the time scale considered, the cumulative prob-ability becomes:
H (x)=1+(1−q)G(x) (2)
whereq is the probability of zero precipitation. The cumu-lative probability distributionH (x)is then transformed into the standard normal distribution to generate the SPI values. Positive SPI values reflect wet conditions while negative val-ues indicate a drier climate. State definitions are given in Table 1.
In this study, the SPI time series were computed using the program files from the National Drought Mitigation Cen-ter (http://www.drought.unl.edu/monitor/, access: 27 Octo-ber 2009).
2.3 Geostatistical simulation
Geostatistical conditional simulation methods generate a set of equiprobable realizations of the spatial distribution of an attribute, conditional to the observed data, which allow the characterization of the space-time uncertainty of the physical phenomena. The Direct Sequential Simulation (DSS) algo-rithm proposed by Soares (2001) reproduces both the spatial covariance structure and the histogram of the original vari-able. Dur˜ao et al. (2009, 2010) analyzed the spatial and tem-poral patterns of extreme precipitation indices in southern re-gions of Portugal using DSS, while Costa et al. (2008, 2010) used direct sequential cosimulation (coDSS) to map a flood indicator and the extreme precipitation frequency in southern Portugal using elevation as auxiliary information. The geo-statistical simulation approach used in this study is similar to that of Dur˜ao et al. (2010). However, instead of treating time as an additional dimension of the 2D space domain, the DSS algorithm was applied to each year without considering the previous years’ values. Otherwise, it would misrepresent the SPI values meaning: the 12-month SPI provides a compari-son of the precipitation for 12 consecutive months with the same 12 consecutive months for all the years included in the
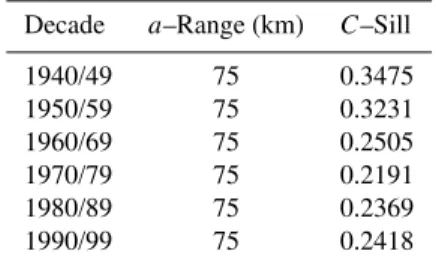
Table 2. Parameters of the exponential variogram models for the 12-month SPI, by decade.
Decade a–Range (km) C–Sill
1940/49 75 0.3475 1950/59 75 0.3231 1960/69 75 0.2505 1970/79 75 0.2191 1980/89 75 0.2369 1990/99 75 0.2418
historical record. The geostatistical procedures used can be summarized as follows.
Letz(uα,ti): α=1,. . . ,n;i=1,. . . ,T be the set of SPI
values measured at n locations uα and in ti time instants
(years). Thenmonitoring stations do not have to be all in-formed at the sameT time instants (i.e., a number of values can be missing). This data set corresponds to realizations of a spatiotemporal random variableZ(u,t )that can take a se-ries of values at any location in spaceuand instant in time taccording to a probability distribution. The DSS algorithm was applied in order to obtain a set ofm=100 equally prob-able realizations ofZ(u,t)at all 800 m×800 m grid cells of each instant in timeti (T=60):
zs(uα,ti):s=1,...,m;α=1,...,N;i=1,...,T (3)
whereN=74683 is the total number of grid nodes to be simulated for each year from 1940 to 1999.
Costa et al. (2008) suggested that a different space-time semivariogram model should be used for each decade in or-der to account for possible long-term trends, or fluctuations, in precipitation. In fact, based on the spatial range parameter of the semivariogram models, Costa et al. (2008, 2010) and Dur˜ao et al. (2009, 2010) concluded that the spatial patterns of extreme precipitation became more homogenous over the last decades of the twentieth century in the south of Portugal. Hence, in this study, the DSS algorithm also used a different exponential semivariogram model for each decade. The ex-ponential modelγ(h) approaches the sill (C)asymptotically, witharepresenting the practical range (distance at which the semivariance reaches 95% of the sill value):
γ (h)=C1−e(−3h/a), h6=0. (4)
The space-time scenario for a given yeart0corresponds to the average of the local histograms that were computed for all grid cellsuα:
zM(uα,t0)=
1 m
m
X
s=1
zs(uα,t0) ,α=1,...,N. (5)
Similarly, the uncertainty of the space-time scenario for a given yeart0 was evaluated by the standard deviation, the variance and the coefficient of variation of the local his-tograms.
2.4 Trend assessment
The nonparametric estimator of the slope proposed by Sen (1968), and based on the Kendall’s rank correlation, has been widely used to compute linear trends in hydrometeorological series (e.g., de Lima et al., 2010). The yearly trend map cor-responds to the Sen’s slope estimates computed at each grid celluα:
b(uα)=Median
"
zM(u
α,tj)−zM(uα,ti)
(tj−ti)
#
, (6)
∀ti< tj, α=1,...,N
wherezM(uα,tj)andzM(uα,ti)are data points of the
space-time scenario (Eq. 5) measured at yearstj and ti,
respec-tively.
To assess local changes in precipitation patterns, Wilcoxon-Mann-Whitney one-sided tests were applied to the SPI values, at each grid cell, to compare the median of the SPI values in 1940/1969 with their median in 1970/1999. The p-values of each test were estimated using Monte Carlo simulations with 10 000 samples. This nonparametric test was preferred over the usual t-test because of the small sam-ple sizes of each sub-period.
3 Results and discussion
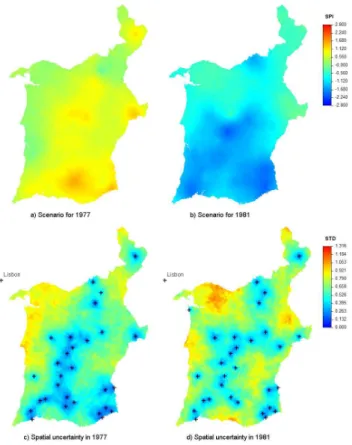
For illustration purposes, two scenarios of the SPI are shown in Fig. 2, as well as their spatial uncertainty measured by the standard deviation (STD). Negative values of the SPI indi-cate higher dryness (Table 1). The scenarios show that the inland areas and the southeast region are affected by drought in many years. The extreme drought episodes of 1948/49 and 1980/81 that affected Portugal’s territory (Trigo and DaCa-mara, 2000) were also captured by the SPI scenarios. Moder-ate drought conditions occur more frequently over the study region, except in the northwest coast.
As expected, regions where the SPI shows greater spatial variability correspond to regions less densely sampled. Only a few stations are located at medium (>400 m) and high ele-vations, thus greater uncertainty would be expected at those regions. However, the spatial variability in the mountainous regions of the south is often small, because the SPI is not
1
Fig. 2.Scenarios for the 12-month SPI and their corresponding spa-tial uncertainty measured by the standard-deviation in 1977 (left), and 1981 (right).
affected adversely by topography (Lloyd-Hughes and Saun-ders, 2002).
1
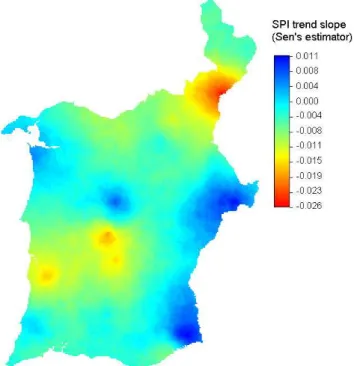
Fig. 3.Local trends in the 12-month SPI.
period with the last period of 1977/78 to 1998/99. If only these two periods were compared, one could conclude that drought frequency and severity were aggravating in the Alen-tejo region. However, looking at the whole study period from September 1932 to September 1999, the results of Moreira et al. (2006) indicate that the last period may correspond to a cycle that could be related to a long-term natural variability.
Similarly, the Wilcoxon-Mann-Whitney tests (Fig. 4) indi-cate a significant increase in dryness and drought conditions in most of the Alentejo region when comparing the first thirty years of SPI data (1940–1969 period) with the data from the last thirty years of the twentieth century (1970–1999 period). These results are also consistent with the local trend map (Fig. 3) as changes in the SPI median are statistically sig-nificant in the centre of the region and in the northeast area. The local trend map (Fig. 3) also shows a trend towards wet-ter conditions in a few areas, particularly in the west of the Alentejo region. However, this local trend may not be sig-nificant because the SPI median in 1970–1999 is not signifi-cantly greater than the SPI median in 1940–1969 in the whole study region (Fig. 4). Additionally, if a non-linear trend oc-curred at those locations, the nonparametric trend estimator may have not significantly captured the trend signal.
1
Fig. 4.Wilcoxon-Mann-Whitney tests results for the 12-month SPI.
4 Conclusions
This study evaluates spatial and temporal dynamics in pre-cipitation in southern Portugal, from 1940 to 1999, through the analysis of local patterns in the Standard Precipitation Index. The SPI has been computed for the 12-month time scale, which mainly addresses hydrological droughts (Heim, 2000; Lloyd-Hughes and Saunders, 2002). The hydrological component of droughts is very important given the high de-pendence of many socio-economic activities on surface wa-ter resources (e.g., agriculture, hydropower generation, and domestic supply).
The increasing precipitation trend found in the west, along the Guadiana river, may not be significant. The Guadiana supplies the Alqueva reservoir and irrigation water for much of the western region, but recent studies project decreases in the Guadiana stream flow (Kilsby et al., 2007). Hence, it is unclear if that trend signifies an increase in water availabil-ity. On the other hand, results show that a significant trend towards drying occurs in most of the Alentejo region, par-ticularly in the centre and in the northeast. Hence it is very important for water resources and agriculture management to propose adaptation and mitigation measures if these local trends become persistent.
Acknowledgements. The author acknowledges Andr´e Melo for an exploratory analysis of the SPI data and for the variogram models’ parameters. The author also thanks the two reviewers for valuable suggestions that have helped to improve the quality of this paper.
References
Costa, A. C. and Soares, A.: Trends in extreme precipitation indices derived from a daily rainfall database for the south of Portugal, Int. J. Climatol., 9, 1956–1975, 2009a.
Costa, A. C. and Soares, A.: Homogenization of climate data: re-view and new perspectives using geostatistics, Math. Geosci., 3, 291–305, 2009b.
Costa, A. C., Dur˜ao, R., Pereira, M. J., and Soares, A.: Using stochastic space-time models to map extreme precipitation in southern Portugal, Nat. Hazards Earth Syst. Sci., 8, 763–773, doi:10.5194/nhess-8-763-2008, 2008.
Costa, A. C., Soares, A., Pereira, M. J., and Dur˜ao, R.: Evaluation of space-time dynamics in extreme precipitation frequency using geostatistical cosimulation with elevation, WSEAS Transactions on Environment and Development, 6, 44–53, 2010.
de Lima, M. I. P., Carvalho, S. C. P., de Lima, J. L. M. P., and Coelho, M. F. E. S.: Trends in precipitation: analysis of long annual and monthly time series from mainland Portugal, Adv. Geosci., 25, 155–160, doi:10.5194/adgeo-25-155-2010, 2010. Dur˜ao, R., Pereira, M. J., Costa, A. C., Cˆorte-Real, J. M., and
Soares, A.: Indices of precipitation extremes in Southern Por-tugal - a geostatistical approach, Nat. Hazards Earth Syst. Sci., 9, 241–250, doi:10.5194/nhess-9-241-2009, 2009.
Dur˜ao, R., Pereira, M. J., Costa, A. C., Delgado, J., del Barrio, G., and Soares, A.: Spatial-temporal dynamics of precipitation extremes in southern Portugal: a geostatistical assessment study, Int. J. Climatol., 30, 1526–1537, 2010.
Fragoso, M. and Gomes, P. T.: Classification of daily abundant rain-fall patterns and associated large-scale atmospheric circulation types in Southern Portugal, Int. J. Climatol., 28, 537–544, 2008. Heim, R. R.: Drought indices: A review, in: Drought: A Global Assessment, edited by: Wilhite, D. A., Routledge Hazards and Disasters Series, Vol. 1, Ch. 11, Routledge, London, 159–167, 2000.
Kilsby, C. G., Tellier, S. S., Fowler, H. J., and Howels, T. R.: Hy-drological impacts of climate change on the Tejo and Guadiana Rivers, Hydrol. Earth Syst. Sci., 11, 1175–1189, 2007,
http://www.hydrol-earth-syst-sci.net/11/1175/2007/.
L´azaro, R., Rodrigo, F. S., Guti´errez, L., Domingo, F., and Puigdef´abregas, J.: Analysis of a 30-year rainfall record (1967– 1997) in semi–arid SE Spain for implications on vegetation, J. Arid. Environ., 48, 373–395, 2001.
Lloyd-Hughes, B. and Saunders, M. A.: A drought climatology for Europe, Int. J. Climatol., 22, 1571–1592, 2002.
Logan, K. E., Brunsell, N. A., Jones, A. R., and Feddema, J. J.: As-sessing spatiotemporal variability of drought in the U.S. central plains, J. Arid. Environ., 74, 247–255, 2010.
McKee, T. B., Doesken, N. J., and Kleist, J.: The relationship of drought frequency and duration to time scales, Preprints, 8th Conference on Applied Climatology, 17–22 January, Anaheim, California, Amer. Meteor. Soc., 179–184, 1993.
Moreira, E. E., Paulo, A. A., Pereira, L. S., and Mexia, J. T.: Anal-ysis of SPI drought class transitions using loglinear models, J. Hydrol., 331, 349–359, 2006.
Mourato, S., Moreira, M., and Corte-Real, J.: Interannual variabil-ity of precipitation distribution patterns in Southern Portugal, Int. J. Climatol., 30, 1784–1794, 2010.
Ntale, H. K. and Gan, T.: Drought indices and their application to East Africa, Int. J. Climatol., 23, 1335–1357, 2003.
Paulo, A. A. and Pereira, L. S.: Drought concepts and characteri-zation. Comparing drought indices applied at local and regional scales, Water Int., 31, 37–49, 2006.
Paulo, A. A., Pereira, L. S., and Matias, P. G.: Analysis of local and regional droughts in southern Portugal using the theory of runs and the Standardised Precipitation Index, in: Tools for Drought Mitigation in Mediterranean Regions, edited by: Rossi, G., Can-celliere, A., Pereira, L. S., Oweis, T., Shatanawi, M., and Zairi, A., Kluwer, Dordrecht, 55–78, 2003.
Paulo, A. A., Ferreira, E., Coelho, C., and Pereira, L. S.: Drought class transition analysis through Markov and loglinear models, an approach to early warning, Agr. Water Manag., 77, 59–81, 2005.
Ros´ario, L.: Indicadores de desertificac¸˜ao para Portugal Continen-tal, Direcc¸˜ao-Geral dos Recursos Florestais (Ed.), Lisboa, 56 pp, 2004.
Santo, F. E., Guerreiro, R., Pires, V. C., Pessanha, L. E. V., and Gomes, I. M.: Monitoring agricultural drought in mainland Por-tugal, in: Monitoring and Predicting Agricultural Drought: A Global Study, edited by: Boken, V. K., Cracknell, A. P., and Heathcote, R. L., Oxford University Press, New York, 181–195, 2005.
Sen, P. K.: Estimates of the regression coefficient based on Kendall’s tau, J. Am. Stat. Assoc., 63, 1379–1389, 1968. Soares, A.: Direct sequential simulation and cosimulation, Math.
Geol., 33, 911–926, 2001.
Trigo, R. M. and DaCamara, C.: Circulation Weather Types and their impact on the precipitation regime in Portugal, Int. J. Cli-matol., 20, 1559–1581, 2000.
Thom, H. C. S.: A note on the gamma distribution, Mon. Weather Rev., 86, 117–122, 1958.