www.atmos-chem-phys.net/8/4105/2008/ © Author(s) 2008. This work is distributed under the Creative Commons Attribution 3.0 License.
Chemistry
and Physics
Depletion of gaseous polycyclic aromatic hydrocarbons by a
forest canopy
S.-D. Choi1, R. M. Staebler2, H. Li1,*, Y. Su1,**, B. Gevao1,***, T. Harner2, and F. Wania1
1Department of Physical and Environmental Sciences, University of Toronto Scarborough, Toronto, Ontario, Canada 2Science and Technology Branch, Environment Canada, Toronto, Ontario, M3H 5T4, Canada
*now at: Worsfold Water Quality Centre, Trent University, Peterborough, Ontario, Canada **now at: Science and Technology Branch, Environment Canada, Toronto, Ontario, Canada
***now at: Department of Environmental Science, Environment and Urban Development Division, Kuwait Institute for Scientific Research, Kuwait
Received: 13 November 2007 – Published in Atmos. Chem. Phys. Discuss.: 8 February 2008 Revised: 26 May 2008 – Accepted: 9 July 2008 – Published: 31 July 2008
Abstract. Rapid uptake of gaseous polycyclic aromatic hy-drocarbons (PAHs) by a forest canopy was observed at Bor-den in Southern Ontario, Canada during bud break in early spring 2003. High volume air samples were taken on 12 individual days at three different heights (44.4, 29.1, and 16.7 m) on a scaffolding tower and on the forest floor be-low the canopy (1.5 m). Concentrations of PAHs were posi-tively correlated to ambient temperature, resulting from rel-atively warm and polluted air masses passing over the East-ern United States and Toronto prior to arriving at the sam-pling site. An analysis of vertical profiles and gas/particle partitioning of the PAHs showed that gaseous PAHs estab-lished a concentration gradient with height, whereas levels of particulate PAHs were relatively uniform, implying that only the uptake of gaseous PAHs by the forest canopy was sufficiently rapid to be observed. Specifically, the gaseous concentrations of intermediate PAHs, such as phenanthrene, anthracene, and pyrene, during budburst and leaf emergence were reduced within and above the canopy. When a gradient was observed, the percentage of PAHs on particles increased at the elevations experiencing a decrease in gas phase con-centrations. The uptake of intermediate PAHs by the canopy also led to significant differences in gaseous PAH composi-tion with height. These results are the most direct evidence yet of the filter effect of forest canopies for gaseous PAHs in early spring. PAH deposition fluxes and dry gaseous deposi-tion velocities to the forest canopy were estimated from the concentration gradients.
Correspondence to:F. Wania
1 Introduction
Vegetation constitutes an important environmental reservoir for semi-volatile organic compounds (SOCs) because of high surface coverage (80% of the earth’s terrestrial surface) and the presence of hydrophobic lipids and waxes in foliage (Si-monich and Hites, 1994a, 1995). A high surface roughness leads to fast uptake of atmospheric SOCs in forest canopies, which have indeed been shown to effectively filter many SOCs, including polycyclic aromatic hydrocarbons (PAHs). Such filtering reduces air concentrations and increases con-taminant deposition to the forest floor (Howsam et al., 2001a, b; Matzner, 1984; McLachlan and Horstmann, 1998; Si-monich and Hites, 1994b). Model calculations suggest that the filter effect is most efficient for airborne SOCs that have an octanol-air partition coefficient logKOA between 7 and 11 and an air-water partition coefficient logKAW above−6 (McLachlan and Horstmann, 1998). Calculations with a re-gional multimedia fate model indicated that in very large forested areas the average air concentrations of such chem-icals may be reduced by efficient dry deposition during the growing season (Wania and McLachlan, 2001). In partic-ular, global scale modeling revealed that the filter effect of boreal deciduous forests may reduce by half the long-range transport of SOCs to the Arctic (Su and Wania, 2005). De-spite these field measurements and modeling efforts devoted to quantifying the forest filter effect, the magnitude, variabil-ity, and mechanisms of this process remain to be fully char-acterized.
concentrations and bulk deposition below a canopy and at a nearby clearing has been applied to estimate the SOC de-position to forest canopies during an entire growing season (Horstmann and McLachlan, 1998; Su et al., 2007). While these studies can yield long term average gaseous deposition velocities to forests, they only provide indirect evidence of SOC uptake in the canopy and the resulting reduction of air concentrations. They are also unsuitable for chemicals that degrade in the canopy, such as the PAHs (Su et al., 2007). The purpose of this study was to determine concentration gradients of PAHs developing above a forest as a result of their rapid uptake in the canopy. Specifically, the tempo-ral variations of gaseous and particulate PAHs, their verti-cal profiles and gas/particle partitioning at different heights on a 45 m scaffolding tower were investigated in a Canadian deciduous forest.
2 Experimental section
2.1 Air sampling
The sampling site (44◦19′N, 79◦56′W), located 75 km
northwest of Toronto on the Canadian Forces Base Borden (Fig. S1 in the supplementary material, http://www.atmos-chem-phys.net/8/4105/2008/
acp-8-4105-2008-supplement.pdf), is a mixed deciduous forest, dominated by red maple (Acer rubrum), trembling aspen (Populus tremuloides), large-tooth aspen (Populus
grandidentata), white ash (Fraxinus americana), black
cherry (Prunus serotina), and white pine (Pinus strobes). Average canopy height and stand age is 22 m and 90 years (http://www.smc.ec.gc.ca/arqp/borden e.cfm), respectively. The terrain is flat and uniform surface characteristics apply to an area of several square kilometers. A 45 m scaffolding tower in the center of the forest is fully instrumented for measurements of micrometeorological parameters above and within the canopy. The site has previously been used for studies of the exchange of gases between the forest and the atmosphere (Fuentes et al., 1992; Fuentes et al., 1995; Fuentes et al., 1996; Gu et al., 1999; Makar et al., 1999). Details on the continuous flux program can be found in Lee et al. (1999).
Sampling was carried out in spring (24 April–2 June 2003) when PAH uptake in the forest canopy is expected to be largest, due to the appearance of a new, uncontaminated chemical storage compartment during budburst and leaf emergence. The seasonal development of the leaf area in-dex at Borden confirms that our sampling period corresponds to the early growing season (Strong et al., 2004). Three samples at different heights on the scaffolding tower (44.4, 29.1, and 16.7 m) and one sample on the forest floor below the canopy (1.5 m) were simultaneously taken on 12 individ-ual days using high volume air samplers (Fig. S2). Partic-ulate and gaseous PAHs were collected on Whatman GF/A
glass fiber filters (GFF: 203×254 mm) and two polyurethane
foam plugs (PUF: 80 mm diameter, 75 mm long), respec-tively. Prior to budburst (24 and 25 April), 24-h samples were collected for two continuous days to characterize the situa-tion without the presence of a canopy. While leaves were de-veloping, 24-h samples were collected every three days until leaves were completely developed, which lasted about one month (5 May–2 June). In total, 48 paired PUF and GFF samples were taken. More information on sampling times is presented in the supplementary material (Table S1).
At the same time, eddy covariance fluxes for sensible heat, CO2, and H2O were measured at 33 m using a triaxial sonic anemometer in combination with fast response gas analyz-ers. In addition to these measurements, data for air tem-peratures, wind speed and direction, incoming solar radia-tion, photosynthetically active radiaradia-tion, and relative humid-ity were continuously collected above the canopy. All mi-croclimatic and gas concentration measurements were ac-quired using data loggers, and results were averaged every half-hour.
2.2 Chemical analysis
PUFs and GFFs were individually Soxhlet extracted for 16 h with petroleum ether (PE) and dichloromethane (DCM), re-spectively. Extracts were concentrated by rotary evapora-tion, blown down to about 1 mL with a gentle stream of ni-trogen, and then solvent exchanged into iso-octane. Stan-dard solutions of deuterated PAHs (naphthalene, D8-acenaphthylene, D10-phenanthrene, fluoranthene, D10-pyrene, D12-benzo(a)D10-pyrene, D12-benzo(ghi)perylene) were spiked into the samples prior to extraction to check recov-eries during extraction and clean-up procedures. Extracts were cleaned and separated into two fractions on a column of 3 g 100-mesh silicic acid (deactivated with 3% water) over-laid by 2 g neutral alumina (deactivated with 6% water), and topped with 1 cm of anhydrous sodium sulfate. The col-umn was pre-washed with 30 mL of DCM and 30 mL of PE. The sample was eluted with 50 mL of PE (fraction 1, containing light PAHs) and then with 30 mL of DCM (frac-tion 2, containing heavy PAHs). Frac(frac-tions were reduced to 1 mL using a rotary evaporator and further blown down to about 0.5 mL under a gentle stream of nitrogen and sol-vent exchanged into iso-octane. Mirex (1,3,4-Metheno-2h-cyclobuta(cd)pentalene) was added to the sample prior to in-jection as internal standard.
Sixteen PAHs (naphthalene, acenaphthylene, acenaph-thene, and those listed in Table 1) were analyzed by gas chro-matography (GC)-electron impact mass spectrometry in the selected ion monitoring mode using an Agilent 6890 GC-5973 mass spectrometric detector. The separation was per-formed on a DB-5MS column (60 m×0.25 mm i.d., 0.10µm
film thickness). OneµL of samples was injected in splitless mode at inlet temperature of 280◦C. The carrier gas was
temperature program and the target ions are provided in the supplementary material.
2.3 Quality assurance and quality control
Field blanks were collected for every sampling event (n=12). PUF plugs and GFFs were extracted and analyzed for target analytes using the same method as was used for real sam-ples. The method detection limit (MDL) and recoveries for PAHs calculated from field blanks are shown in Table S2. The range of MDL, defined as the mean blank value plus three standard deviations, was 0.1–27.1 pg·m−3for gaseous
PAHs and 0.1–6.5 pg·m−3for particulate PAHs.
Concentra-tions below the limit of detection were eliminated and the remaining ones were corrected for average blank values, but not corrected for the recoveries of deuterated PAHs. Recov-ery, calculated using the seven deuterated PAHs, was 65– 136% for gaseous PAHs and 74–154% for particulate PAHs (Table S2). Breakthrough was checked by separately analyz-ing front and back PUFs in each of the four samples taken on 6 May, 30 May, and 2 June. Significant fractions of the three most volatile compounds (naphthalene, acenaphthylene, and acenaphthene) on the back PUF indicated breakthrough and they were thus not considered further. Meanwhile, lack of PAH detection on eight back-up GFFs (30 May and 2 June) indicated that an adsorption artifact was not observed. 2.4 Calculation of turbulent fluxes
Gas fluxes (pg·m−2
·s−1)between the air and forest canopy can be calculated by the modified Bowen ratio (MBR) method. This method has been widely used for the calcula-tion of air/surface exchange fluxes of mercury vapor, volatile organic compounds, and other trace gases (Doskey et al., 2004; Lindberg et al., 1998; Majewski et al., 1990; Meyers et al., 1996; Schween et al., 1997). Only recently has it found use for semi-volatile pesticides, both to measure volatiliza-tion from agricultural soils (Kurt-Karakus et al., 2006) and to quantify air-water exchange fluxes in Lake Superior (Per-linger et al., 2005). To our knowledge, this study is the first application of the modified Bowen ratio method to measur-ing fluxes of SOCs to a terrestrial surface. The underlymeasur-ing equation is:
Flux=−KC
dC
dz (1)
whereKC is the eddy diffusivity (m2·s−1)for chemicals,C
is concentration (pg·m−3), andzis height (m). It is assumed
that the turbulent exchange of heat and chemicals is gov-erned by the same turbulent mechanisms, i.e.KHeat equals
KC (Schween et al., 1997). KHeat is determined by com-bining direct eddy covariance flux measurements of sensible heat with the vertical temperature gradient,
w′T′=−KHeatdT
dz (2)
Table 1. Average and range of PAH concentrations in pg·m−3.
BDL means below method detection limit.
Gas-phase Particle-phase
Fluorene 450 1.3
(91–990) (BDL–3.8)
Phenanthrene 1250 5.9
(270–2600) (BDL–24)
Anthracene 82 1.7
(BDL–380) (BDL–4.8)
Fluoranthene 190 20
(83–440) (3.8–72)
Pyrene 160 18
(34–410) (3.9–56)
Benz(a)anthracene 5.3 13
(0.8–20) (3.4–43)
Chrysene 12 21
(2–34) (4.9–61)
Benzo(b)fluoranthene 5.2 31
(BDL–27) (3.4–80)
Benzo(k)fluoranthene 1.3 14
(BDL–8.2) (BDL–33)
Benzo(a)pyrene 0.5 14
(BDL–7.5) (2.4–39)
Indeno(123,cd)pyrene 1.4 27
(BDL–6.6) (6.4–60)
Dibenz(ah)anthracene 0.05 7.1
(BDL–0.80) (BDL–12)
Benzo(ghi)perylene 1.6 25
(BDL–6.2) (7.0–54)
P
13PAH 2200 200
(540–4300) (46–520)
wherew is the vertical wind component, T is the temper-ature, andw′T′ represents the turbulent sensible heat flux
directly measured by the sonic anemometer (CSAT3, Camp-bell Scientific Corp) at 33 m, determined on a half-hourly basis. The vertical temperature gradient is determined us-ing the temperatures at 43.4 m and 29.0 m in an 8-level tem-perature profile measured with aspirated, radiation-shielded copper-constantan thermocouples. It is also assumed that the chemical undergoes no transformations between the two gradient levels. Strictly speaking, the gradient method can only be used to derive fluxes for time periods when both the vertical eddy diffusivityKC and the concentration gradient
(a) (b)
(c) (d)
0 1000 2000 3000 4000 5000 6000 7000 8000 A p ril 24 A p ril 25 Ma y 0 6 Ma y 0 9 Ma y 1 2 Ma y 1 6 Ma y 1 8 Ma y 2 1 Ma y 2 4 Ma y 2 7 Ma y 3 0 Ju n e 0 2 C o nc ent ra tion ( pg m -3) 0 2 4 6 8 10 12 14 16 18 20 T e m p er at ur e ( ℃ )A (44.4 m) B (29.1 m) C (16.7 m) D (1.5 m) Temp 0 100 200 300 400 500 600 700 800 Ap ri l 2 4 Ap ri l 2 5 Ma y 0 6 Ma y 0 9 Ma y 1 2 Ma y 1 6 Ma y 1 8 Ma y 2 1 Ma y 2 4 Ma y 2 7 Ma y 3 0 J u ne 0 2 C o nc e nt rat io n ( p g m -3 ) 0 2 4 6 8 10 12 14 16 18 20 Tem per at u re ( ℃) A (44.4 m)
B (29.1 m) C (16.7 m) D (1.5 m) Temp 0% 20% 40% 60% 80% 100%
A B C D
Benzo(ghi)perylene Dibenz(ah)anthracene Indeno(123,cd)pyrene Benzo(a)pyrene Benzo(k)fluoranthene Benzo(b)fluoranthene Chrysene Benz(a)anthracene Pyrene Fluoranthene Anthracene Phenanthrene Fluorene 0% 20% 40% 60% 80% 100%
A B C D
Benzo(ghi)perylene Dibenz(ah)anthracene Indeno(123,cd)pyrene Benzo(a)pyrene Benzo(k)fluoranthene Benzo(b)fluoranthene Chrysene Benz(a)anthracene Pyrene Fluoranthene Anthracene Phenanthrene Fluorene
Gas
Particle
∑
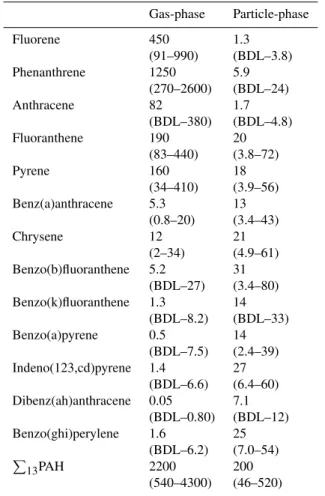
Fig. 1.Temporal variations of the total PAH concentrations (P
13PAH) and the average composition in the gaseous (a, b) and particulate
phase (c, d) at different heights. Black lines in (a) and (c) denote average temperatures at height B during the sampling time
a reasonable estimate of the range within which the real flux resides. An overview of the theoretical background of the MBR technique can be found in Businger (1986) and Wesely and Hicks (2000).
3 Results and discussion
3.1 Temporal variations of gaseous and particulate PAHs Table 1 lists arithmetic means and ranges of the concentra-tions of individual PAHs during the sampling period. Con-centration data for each air sample are provided in Table S3 and S4. The average concentration of P
13PAH (sum of the 13 PAHs listed in Table 1) in this study (2.4 ng·m−3)is
lower than the annual average (12.8 ng·m−3)for the same
site (derived from 35 measurements from October 2001 to November 2002) presumably because the latter is strongly influenced by high winter time air concentrations (Su et al., 2006).
1% 2% 3% 1% 1% 1% 1% 1% 0% 0% 0% 0% 0% 1% 1% 0% 0% 0% 0% 0% 1% 1% 1% 0% 1% 1% 1% 0% 0% 1% 1% 0% 0% 0% 1% 0% 0% 0% 0% 0% 0% 0% 0% 0% 0% 0% 1% 0% 44.4 m 29.1 m 16.7 m 1.5 m 27% 58% 41% 22% 15% 15% 17% 16% 3% 6% 6% 3% 6% 18% 19% 8% 4% 5% 12% 2% 9% 16% 13% 7% 7% 13% 26% 5% 9% 28% 31% 4% 5% 8% 11% 5% 6% 18% 16% 4% 2% 3% 4% 2% 8% 17% 26% 4% 44.4 m 29.1 m 16.7 m 1.5 m 44.4 m 29.1 m 16.7 m 1.5 m 4% 9% 31% 2% 4% 9% 17% 3% 2% 2% 13% 0% 2% 6% 100% 2% 0% 0% 0% 0% 5% 6% 100% 0% 0% 0% 100% 0% 0% 0% 0% 0% 0% 0% 0% 0% 2% 4% 0% 0% 0% 3% 0% 0% 2% 4% 14% 0% 30 00 15 00
0 pg m-3
40
0
20
0
0 pg m-3
40
0
20
0
0 pg m-3
Anthracene Anthracene Phenanthrene
Pyrene Pyrene
Apr 24 Apr 25 May 6 May 9 May 12 May 16 May 18 May 21 May 24 May 27 May 30 Jun 2
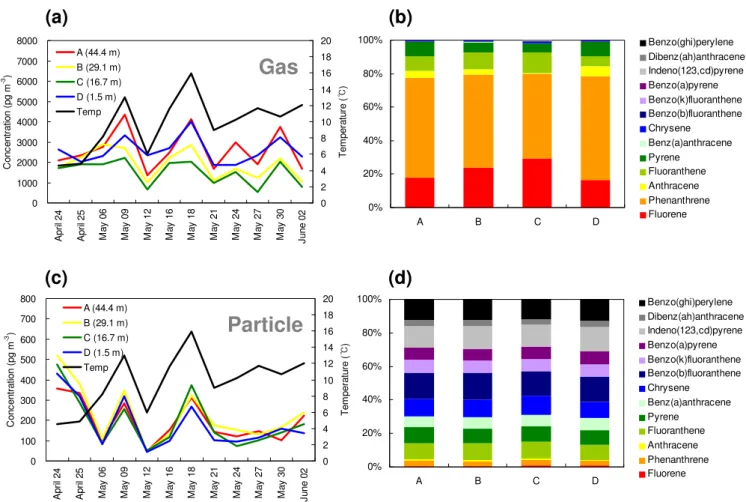
Fig. 2. Vertical profiles of gaseous phenanthrene, anthracene, and pyrene during each sampling day. Percentages of the compounds on particles at the different heights are indicated as well.
of the gaseous PAHs vary with height (Fig. 1a). Gener-ally, the sequence of increasing gas phase concentrations is C(16.7 m)<B(29.1 m)<A(44.4 m)=D(1.5 m). The aver-age difference between heights A and C is 42% and 2% for gaseous and particulate P
13 PAH concentrations, re-spectively. T-tests for concentration pairs at two differ-ent heights confirm significant difference (p<0.05) between
A−B,A−C,B−C,B−D, and C−D. Only gaseous PAH levels atAand D are not significantly different. None of the total and individual concentration differences between particulate PAH concentrations are significant. The aver-age composition of gaseous PAHs also shows subtle differ-ences with height (Fig. 1b). In particular, the contribution of phenanthrene ranges from 51% (height C) to 62% (height
A andD). However, there is no difference in the partic-ulate PAH composition with height (Fig. 1d). These re-sults indicate that only the concentration and composition of gaseous PAHs are influenced by the canopy. Namely, this re-sult agrees with the contention that dry gaseous deposition is the principal process of PAH uptake by vegetation (Simonich and Hites, 1994a).
Theoretically, other processes may contribute to PAH con-centrations that vary with height. Whereas differences in photo-oxidant concentrations with height may lead to dif-ferent loss rates of PAH vapors, the reaction of gas phase
PAHs with hydroxyl radicals proceeds with half lives on the order of 10 h and more (Brubaker Jr. and Hites, 1998; Kwok et al., 1994) and thus is clearly too slow to explain the observed concentration differences. Reactions with other oxidants, such as ozone, are even slower. Also, photo-oxidant concentrations at Borden tend to show only minor variations with height and do not have higher values within the canopy (e.g. Makar et al., 1999). During the sampling period, ozone did not show any significant concentration gradient above 16.7 m. Neither were temperature gradients recorded that would be sufficiently large to cause signifi-cantly different reaction rates at different elevations or to no-tably influence the gas/particle partitioning behavior of the PAHs. In any case, the temperature dependence of the OH radical oxidation of PAHs is very minor (Brubaker Jr. and Hites, 1998).
3.2 Evidence for the uptake of some gaseous PAHs by the forest canopy
all samples (Fig. 1b). In order to confirm which compounds have vertical gradients, the gas-phase concentrations of in-termediate PAHs and particle-phase concentrations of less volatile PAHs were plotted against sampling height (Fig. S4). Gradients with lower concentrations close to the canopy are apparent for gaseous PAHs with three and four aromatic rings, such as phenanthrene, anthracene, and pyrene (Fig. 2). They have logKOA values of 7.78, 7.82, and 8.93 at 25◦C (calculated from sub-cooled liquid vapor pressure) (Lei et al., 2002; Xiao and Wania, 2003), which is in the expected range for a pronounced filter effect (7<logKOA<11) (McLach-lan and Horstmann, 1998). No such gradients were observed for highly volatile PAHs such as fluorene because of the low uptake capacity of the canopy for these PAHs, which may quickly establish equilibrium between air and canopy. Gra-dients for less volatile PAHs were not observed either be-cause they were strongly associated with particles during the sampling period (Table S5).
Whenever a gradient was observed, the percentage of PAHs on particles increased at the elevations which expe-rienced a decrease in gaseous concentration (Fig. 2). This was most evident in the case of pyrene. This observation suggests that it was mostly the gaseous compounds that were taken up in new foliage and is consistent with the lack of a gradient for the less volatile, particle-bound compounds. The gas/particle partitioning behavior was explored further by relating the fraction in the particle phase (Table S5) to a PAH’s vapor pressure. This discussion, which suggested that the gas/particle partitioning behavior above and within the canopy is indeed statistically different, can be found in the supplementary material. Incidentally, the finding that gas phase concentrations change with height, whereas particle phase concentrations do not, implies either that the kinetics of gaseous deposition to the canopy are more rapid than the kinetics of desorption from the particles or that the PAHs in question are not sufficiently desorbable from the particles.
As expected, no strong gradients were observed, espe-cially for phenanthrene and pyrene, on the first two sampling days in late April, which was prior to the emergence of the new foliage at Borden. After budburst, the gradients were maintained throughout May and early June. This suggests that it is indeed the newly emerging foliage which results in the rapid uptake and a decrease in air concentrations. In ad-dition to the gradients above the canopy, inverse gradients were often observed below the canopy, i.e. the PAH levels measured at the forest floor (1.5 m) were typically higher than the levels within and above the canopy. Again, this phenomenon was only observed for the more volatile PAHs (phenanthrene, anthracene, and pyrene) (Fig. 2), suggesting volatilization from forest litter. In early spring, the potential for such revolatilization may be high because snowmelt has just delivered PAHs that had been deposited over the winter months to the soil surface.
Whether uptake by plants is thermodynamically or kineti-cally limited depends in part on a chemical’s octanol-air par-tition coefficient (logKOA)(B¨ohme et al., 1999; McLach-lan, 1999). Previous studies had identified critical logKOA values of 9.9 and 9.7 for the gaseous deposition of SOCs to a German and a Canadian deciduous canopy, respectively (Horstmann and McLachlan, 1998; Su et al., 2007). Com-pounds with logKOAbelow that threshold approached equi-librium between air and the forest canopy during a grow-ing season, whereas the uptake of less volatile SOCs is ki-netically controlled. In this study, however, even relatively volatile PAHs with logKOA<9 (phenanthrene, anthracene, and pyrene) were likely subject to kinetically limited dry gaseous deposition. This can be explained by the sampling date in early spring, when leaves had just been emerging and had not had time to approach equilibrium with atmospheric PAH levels. In contrast, the logKOAthresholds in the pre-vious studies were determined from data covering the entire growing season.
3.3 PAH flux to the forest canopy
As expected, an investigation of the eddy diffusivities (sen-sible heat, momentum, and CO2) measured during spring 2003 revealed that they were highly variable and in partic-ular that none of the 12 sampling days experienced a “sta-tionary” period that would allow for steady-state flux con-ditions and thus a direct application of measured eddy dif-fusivities to individual 24-h measurements. All three eddy diffusivities on average displayed diurnal cycles with min-ima at night and daytime maxmin-ima on the order of 10 m2·s−1.
Due to instrumental difficulties with the CO2profile during this experiment, KHeat experienced significantly less noise and was subsequently used as placeholder forKC. A median diurnal cycle ofKHeatfor the period 20 April–10 June 2003 (Fig. S7) shows a strong diurnal pattern with a noon time maximum (17:00 GMT) and a very low value during night time. The eddy diffusivity derived from the transport of mo-mentum showed a similar range and would produce similar flux estimates.
and the effect cancels when the MBR method is applied. Since temperature and PAH concentrations do exhibit sim-ilar profiles (Fig. 1), suggesting that the sink for PAH is col-located with the source of the sensible heat, at the elevations with the highest leaf densities, this is thought to be a rea-sonable assumption. The median 24-h gradients of phenan-threne, anthracene, and pyrene for the 10 sampling days in May and June are 32, 3, and 6 pg·m−3
·m−1, respectively. These gradients are highly variable during the sampling pe-riod (Fig. 2), and the flux estimate can only be expected to deliver an order of magnitude estimate.
We have no measurements on whether or how the con-centration gradients above the canopydC/dzchanged dur-ing the sampldur-ing periods. However, we can make different assumptions concerning the diurnal variability ofdC/dzto at least provide a rough estimate of a range within which the true flux is likely located. Three diurnal gradient sce-narios were used, all sharing the same average value de-rived from measurements (Fig. S8): Scenario I assumes that
dC/dz was constant throughout the 24-h sampling period (dC/dz(day)=dC/dz(night)). Scenario II assumes a de-crease ofdC/dz by an arbitrary 50% during the day as a result of increased mixing (dC/dz(day)=0.5·dC/dz(night)). This scenario approximate a situation where PAHs are ad-vected into the region from elsewhere (MacLeod et al., 2007). A 50% reduction seems reasonable given the ampli-tudes shown by MacLeod et al. (2007) for PCBs, and would be partially explained by the increased mixing height during the daytime. Considering the tight relationship between air mass origin and air concentration discussed above, this is not an unlikely scenario. In order to evaluate the influence of the degree of gradient reduction on the uncertainty of PAH fluxes, a third scenario III assumes a reduction ofdC/dzby 75% (dC/dz(day)=0.25·dC/dz(night)).
By combining the diurnal cycle of theKHeat(Fig. S7) with the PAH concentration gradients (Fig. S8), we can estimate the average diurnal fluxes for the three gradient scenarios for pyrene, phenanthrene, and anthracene (Fig. S9):
Flux=−1
24 24
X
i=1
KHeat(i)
CA(i)−CB(i)
zA−zB
(3) Wherei denotes the hour,KHeat(i)is the median eddy dif-fusivity for houri, andCA andCB are the hourly scenario concentrations.CAandCBare constrained by the condition
1 24
24
X
i=1
CA(i)=C(zA)
where the latter is the measured 24-h average.
Note that these fluxes only include the turbulent exchange and do not account for molecular diffusion at night or inter-mittent transport mechanisms. Maximum uptake is observed during the day in all cases. This pattern results from the di-urnal cycle of the diffusivity because theKis close to zero at night.
Table 2.Average fluxes (pg·m−2
·s−1)and dry gaseous deposition
velocities (cm·s−1)of intermediate PAHs for different gradient
sce-narios. A range of fluxes was calculated based on the interquartile range ofKHeatanddC/dz.
Scenario I Scenario II Scenario III Flux vG Flux vG Flux vG
Phenanthrene 71 7 48 5 35 3 (10–149a) (1–14a) (4–149a) (0–14a) (1–149a) (0–14a)
Anthracene 7 11 5 8 3 5 (1–9a) (2–14a) (0–9a) (1–14a) (0–9a) (0–14a)
Pyrene 14 12 10 8 7 6 (2–16a) (2–14a) (1–16a) (1–14a) (0–16a) (0–14a)
aFluxes and deposition velocities are capped at a maximum level
determined by the 75th percentile of the reciprocal aerodynamic resistance. The reciprocal aerodynamic resistance represents the physical limit to deposition, equivalent to assuming that the only resistance to transport exists in the surface layer.
The median fluxes for the three intermediate PAHs (Table 2) are in the range of 35 to 71 pg·m−2
·s−1 for phenanthrene, 3 to 7 pg·m−2·s−1 for anthracene, and 7 to 14 pg·m−2·s−1for pyrene. This implies the net dry gaseous
deposition of micrograms of PAHs to the canopy per square meter during spring. Scenario I produces higher fluxes than the other scenarios, but they are comparable. For a systematic uncertainty analysis of these results, the uncer-tainties related to both the measured eddy diffusivity and concentration gradients and the uncertainty introduced by the assumed diurnal cycle scenarios were considered. The uncertainty range for the flux estimates given in Table 2 was estimated by first calculating the interquartile range (25th to 75th percentiles) of hourly KHeat and of dC/dz for the three diurnal gradient scenarios, and then propagat-ing these into the flux, i.e. KHeat(25%)·dC/dz(25%) and
KHeat(75%)·dC/dz(75%). Spurious negative KHeat values (suggesting counter-gradient flux) and values greater than 50 m2·s−1 were removed before analysis. The reciprocal
3.4 Dry gaseous deposition velocities
Despite the considerable uncertainty in the fluxes derived in the preceding section, we judged it to be worthwhile to es-timate the order of magnitude of dry gaseous deposition ve-locities to the canopy (vGin cm·s−1)using:
vG=−Flux/CG (4)
whereCG is the gaseous concentration of PAHs at level B. The median velocities are on the order of 5 to 10 cm·s−1 (Ta-ble 2). They vary between chemicals, increasing two-fold from phenanthrene (3–7 cm·s−1)to anthracene and pyrene (5–12 cm·s−1). Again, we provide ranges indicating the un-certainty of these estimates (see also Table S7). Variability in the deposition velocities of different PAHs would be ex-pected, if they had approached equilibrium between canopy and atmospheric gas phase to a different extent. In gen-eral, however we suspect that these three PAHs were still far from equilibrium because sampling occurred very early in the growing season.
The deposition velocities for intermediate PAHs from this study are of the same order of magnitude as, albeit somewhat higher than, those previously reported for SOCs in Borden (2.7 cm·s−1)(Su et al., 2007) and a German deciduous forest
(3.6 cm·s−1) (Horstmann and McLachlan, 1998). It is
en-couraging that the deposition velocities derived here agree reasonably with those reported previously, at least consider-ing their considerable uncertainty. The latter values are aver-age gross deposition velocities for the entire growing season, and were indirectly determined from differences in total de-position under the canopy and a nearby clearing (Horstmann and McLachlan, 1998), whereas the values reported here are net deposition velocities during the first month after bud-burst, so perfect agreement can not be expected, especially as gross deposition velocities may vary during the growing season. As long as the PAHs were far from reaching equilib-rium between atmospheric gas phase and leaves during that month, net and gross deposition velocities would be similar because revolatilization from the canopy would still be negli-gible. The high deposition velocities observed in the present study lend further support to the very rapid uptake of PAHs by deciduous forest canopies.
4 Conclusions
Rapid uptake of gaseous PAHs by the deciduous forest canopy was observed during bud break in early spring. This conclusion relies on the following evidence:
1. Concentrations of intermediate gaseous PAHs, such as phenanthrene, anthracene, and pyrene, within the canopy were reduced relative to above and below the canopy.
2. When this gradient was observed, the percentage of PAHs on particles increased at the elevations which ex-perienced a decrease in gaseous concentration.
3. No strong gradients were observed prior to the emer-gence of the new foliage, but the gradients were main-tained throughout the sampling period after budburst. 4. The gas/particle partitioning behavior above and within
the canopy was statistically different.
These observations suggest that the newly emerging foliage indeed resulted in the rapid uptake of intermediate gaseous PAHs and a decrease in air concentrations.
Average diurnal fluxes and dry gaseous deposition veloci-ties were estimated from the air concentrations measured at the two highest elevations. The net dry gaseous deposition flux of individual PAHs to the canopy was in the range of micrograms per square meter during spring. Deposition velocities were of the same order of magnitude as, albeit somewhat higher than, those previously reported, lending further support to the hypothesis of rapid uptake of SOCs by deciduous forest canopies. This is the first study applying the MBR method to estimating fluxes of SOCs to a terrestrial surface and showing the most direct evidence yet of the filter effect of forest canopies for gaseous SOCs.
Supplementary material
Information on sampling site and events; detection limits and recoveries; back-trajectories and wind-rose diagrams; vertical profiles and particle-bound percentages for all PAHs; regression parameters, fitting curves and discussion of gas/particle partitioning; diurnal cycles of the diffusiv-ity, gradient, and flux. This material is available free of charge at: http://www.atmos-chem-phys.net/8/4105/2008/ acp-8-4105-2008-supplement.pdf.
Acknowledgements. This work was financially supported by the Canadian Foundation for Climate and Atmospheric Sciences (Project GR-007). We further thank S. Hayward and T. Dermott for help with collecting samples, M. S. McLachlan for valuable comments on the manuscript, and J. Fuentes for advice on the setup of the micrometeorological technique.
Edited by: J. Rinne
References
B¨ohme, F., Welsch-Pausch, K., and McLachlan, M. S.: Uptake of airborne semivolatile organic compounds in agricultural plants: Field measurements of interspecies variability, Environ. Sci. Technol., 33, 1805–1813, 1999.
Brubaker Jr., W. W. and Hites, R. A.: OH reaction kinetics of polycyclic aromatic hydrocarbons and polychlorinated
Businger, J. A.: Evaluation of the accuracy with which dry depo-sition can be measured with current micrometeorological tech-niques, J. Climate Appl. Meteor., 25, 1100–1124, 1986. Doskey, P. V., Kotamarthi, V. R., Fukui, Y., Cook, D. R., Breitbeil
III, F. W., and Wesely, M. L.: Air-surface exchange of peroxy-acetyl nitrate at a grassland site, J. Geophys. Res., 109, D10310, doi:10.1029/2004JD004533, 2004.
Fuentes, J. D., Gillespie, T. J., Den Hartog, G., and Neumann, H. H.: Ozone deposition onto a deciduous forest during dry and wet conditions, Agr. Forest Meteorol., 62, 1–18, 1992.
Fuentes, J. D., Wang, D., Den Hartog, G., Neumann, H. H., Dann, T. F., and Puckett, K. J.: Modelled and field measurements of biogenic hydrocarbon emissions from a Canadian deciduous for-est, Atmos. Environ., 29, 3003–3017, 1995.
Fuentes, J. D., Wang, D., Neumann, H. H., Gillespie, T. J., Den Hartog, G., and Dann, T. F.: Ambient biogenic hydrocarbons and isoprene emissions from a mixed deciduous forest, J. Atmos. Chem., 25, 67–95, 1996.
Gu, L., Fuentes, J. D., Shugart, H. H., Staebler, R. M., and Black, T. A.: Responses of net ecosystem exchanges of carbon diox-ide to changes in cloudiness: results from two North American deciduous forests, J. Geophys. Res., 104, 31 421–31 434, 1999. Horstmann, M. and McLachlan, M. S.: Atmospheric deposition of
semivolatile organic compounds to two forest canopies, Atmos. Environ., 32, 1799–1809, 1998.
Howsam, M., Jones, K. C., and Ineson, P.: Dynamics of PAH de-position, cycling and storage in a mixed-deciduous ( Quercus-fraxinus) woodland ecosystem, Environ. Pollut., 113, 163–176, 2001a.
Howsam, M., Jones, K. C., and Ineson, P.: PAHs associated with the leaves of three deciduous tree species – II: Uptake during a growing season, Chemosphere, 44, 155–164, 2001b.
Kurt-Karakus, P. B., Bidleman, T. F., Staebler, R. M., and Jones, K. C.: Measurement of DDT fluxes from a historically treated agricultural soil in Canada, Environ. Sci. Technol., 40, 4578– 4585, 2006.
Kwok, E. S. C., Harger, W. P., Arey, J., and Atkinson, R.: Reactions of gas-phase phenanthrene under simulated atmospheric condi-tions, Environ. Sci. Technol., 28, 521–527, 1994.
Lee, X. H., Fuentes, J. D., Staebler, R. M., and Neumann, H. H.: Long-term observation of the atmospheric exchange of CO2with
a temperate deciduous forest in southern Ontario, Canada., J. Geophys. Res., 104, 15 975–15 984, 1999.
Lei, Y. D., Chankalal, R., Chan, A., and Wania, F.: Supercooled liquid vapor pressures of the polycyclic aromatic hydrocarbons, J. Chem. Eng. Data, 47, 801–806, 2002.
Lindberg, S. E., Hanson, P. J., Meyers, T. P., and Kim, K.-H.: Air/surface exchange of mercury vapor over forests – the need for a reassessment of continental biogenic emissions, Atmos. En-viron., 32, 895–908, 1998.
MacLeod, M., Scheringer, M., Podey, H., Jones, K. C., and Hungerb¨uhler, K.: The origin and significance of short-term vari-ability of semivolatile contaminants in air, Environ. Sci. Tech-nol., 41, 3249–3253, 2007.
Majewski, M. S., Glotfelty, D. E., Paw, U. K. T., and Seiber, J. N.: A field comparison of several methods for measuring pesticide evaporation rates from soil, Environ. Sci. Technol., 24, 1490– 1497, 1990.
Makar, P. A., Fuentes, J. D., Wang, D., Staebler, R. M., and Wiebe, H. A.: Chemical processing of biogenic hydrocarbons within and above a temperate deciduous forest, J. Geophys. Res., 104, 3581–3603, 1999.
Matzner, E.: Annual rates of deposition of polycyclic aromatic hy-drocarbons in different forest ecosystems, Water Air Soil Pollut., 21, 425–434, 1984.
McLachlan, M. S. and Horstmann, M.: Forests as filters of airborne organic pollutants: a model, Environ. Sci. Technol., 32, 413–420, 1998.
McLachlan, M. S.: Framework for the interpretation of measure-ments of SOCs in plants, Environ. Sci. Technol., 33, 1799–1804, 1999.
Meyers, T. P., Hall, M. E., Lindberg, S. E., and Kim, K.-H.: Use of the modified Bowen-ratio technique to measure fluxes of trace gases, Atmos. Environ., 30, 3321–3329, 1996.
Perlinger, J. A., Tobias, D. E., Morrow, P. S., and Doskey, P. V.: Evaluation of novel techniques for measurement of air-water ex-change of persistent bioaccumulative toxicants in Lake Superior, Environ. Sci. Technol., 39, 8411–8419, 2005.
Schween, J. H., Dlugi, R., Hewitt, C. N., and Foster, P.: Determi-nation and accuracy of VOC-fluxes above the pine/oak forest at Castelporziano, Atmos. Environ., 31(SI), 199–215, 1997. Simonich, S. L. and Hites, R. A.: Vegetation-atmosphere
partition-ing of polycyclic aromatic hydrocarbons, Environ. Sci. Technol., 28, 939–943, 1994a.
Simonich, S. L. and Hites, R. A.: Importance of vegetation in re-moving polycyclic aromatic hydrocarbons from the atmosphere, Nature, 370, 49–51, 1994b.
Simonich, S. L. and Hites, R. A.: Organic pollutant accumulation in vegetation, Environ. Sci. Technol., 29, 2905–2914, 1995. Strong, C., Fuentes, J. D., and Baldocchi, D.: Reactive hydrocarbon
flux footprints during canopy senescence, Agr. Forest Meteorol., 127, 159–173, 2004.
Su, Y. and Wania, F.: Does the forest filter effect prevent semivolatile organic compounds from reaching the Arctic?, Env-iron. Sci. Technol., 39, 7185–7193, 2005.
Su, Y., Lei, Y. D., Wania, F., Shoeib, M., and Harner, T.: Regress-ing gas/particle partitionRegress-ing data for polycyclic aromatic hydro-carbons, Environ. Sci. Technol., 40, 3558–3564, 2006.
Su, Y., Wania, F., Harner, T., and Lei, Y. D.: Deposition of polybrominated diphenyl ethers, polychlorinated biphenyls, and polycyclic aromatic hydrocarbons to a boreal decidous forest, Environ. Sci. Technol., 41, 534–540, 2007.
Wania, F. and McLachlan, M. S.: Estimating the influence of forests on the overall fate of semivolatile organic compounds using a multimedia fate model, Environ. Sci. Technol., 35, 582–590, 2001.
Wesely, M. L. and Hicks, B. B.: A review of the current status of knowledge on dry deposition, Atmos. Environ., 34, 2261–2282, 2000.