Article
Printed in Brazil - ©2016 Sociedade Brasileira de Química0103 - 5053 $6.00+0.00*e-mail: [email protected]
Gas-Phase Polycyclic Aromatic Hydrocarbons in the Parking Lot Impacted by
Light-Duty Vehicles Burning Gasoline and Ethanol Blends
Fabio C. Sabino,a Jurandir P. Pinto,a Ismael R. Amador,a Leila D. Martinsb and Maria Cristina Solci*,a,c
aUniversidade Estadual de Londrina, Rodovia Celso Garcia Cid, km 380, 86051-990 Londrina-PR, Brazil
bUniversidade Tecnológica Federal do Paraná, Av. Pioneiros, 3131, 86036-370 Londrina-PR, Brazil
cINCT de Energia e Ambiente, Universidade Federal da Bahia, 40170-290 Salvador-BA, Brazil
In order to study the emission of vapor-phase polycyclic aromatic hydrocarbons (PAHs) by light-duty vehicles burning gasoline and ethanol blends, air samplings were performed at a parking lot in Londrina, PR, Brazil. The samples were obtained during the summer and winter 2012. The semi-volatile PAHs were collected using a cartridge packed with XAD-2 resin, extracted under sonication and subsequently analyzed by liquid chromatograph equipped with fluorescence and photodiode array detectors. Acenapthene (ACE) appears as the most abundant PAH, followed by acenapthylene (ACY) (summer) and fluorene (FLU) (winter). From the total PAHs analyzed (83.5 ng m−3 in winter and 574 ng m−3 in summer), low molecular weight PAHs (LM-PAHs)
corresponded to 93%. The PAH source fingerprint identified in this study was obtained from local and identified sources, and the fluoranthene (FLT) / (FLT + pyrene (PYR)) and anthracene (ANT) / (ANT + phenanthrene (PHE)) ratios corresponding to 0.94 and 0.46, respectively, were characteristic of gasoline and ethanol blend emission.
Keywords: vapor-phase PAHs, biofuel engines, mobile source, diagnostic ratio
Introduction
Vehicle traffic is one of the most important sources of polycyclic aromatic hydrocarbons (PAHs) in urban atmosphere. Measurements taken in traffic tunnels that are heavily exposed to automobile exhaust gases have been used to estimate pollution data. PAH content is used as a marker for emissions from several types of combustion sources.1-5
Unlike the rest of the world, in Brazil, light-duty vehicles (LDVs) run on gasohol (75-80% gasoline/20-25% ethanol) or hydrous ethanol. Besides the fact of being the only country to use these fuels in such proportions, Brazil has a large production of flex-fuel cars (cars with bi-fuel engines), which raises the possibility of air contaminated with gasoline and ethanol at different proportions. The purposes of adding ethanol to gasoline are to reduce the emission of air pollutants, decrease the country’s oil imports and act as anti-knock, i.e., an additive to prevent fuel pre-ignition. The first flexible car was released in
Brazil in 2003. In 2014, over 3,333,000 light-duty vehicles were licensed, of which approximately 88% are flex-fuel.6
The proportion of consumption of gasoline vs. ethanol in center-south of Brazil is, on average, around 50% ethanol.7
The vehicular emission of PAHs, considered toxic to human health, was investigated in environments such as tunnels and bus stations in a few Brazilian cities. These studies presented results on particulate phase PAHs, which characterize emissions arising from the use of diesel/biodiesel and fuel mixtures in Brazil.5,8-12 However,
the characterization of PAH concentrations on the vapor phase of ethanol-gasoline blends from light-duty vehicles in real operation conditions is scarce both in Brazil and in the world.
Although light PAHs are considered less toxic, they are able to react with other pollutants such as O3, NOx and SO2
to form dione-, nitro- and dinitro-PAHs and sulfuric acid, respectively, which can be significantly toxic to both the environment and human health.13,14
affected by emissions from light-duty vehicles in real conditions, burning gasoline and ethanol blends in different proportions in flex-fuel cars.
Experimental
Site characterization
The parking lot in this study is poorly ventilated and the vehicles in it move at low speed, an appropriate sampling location for this purpose. Furthermore, the conditions at the parking lot hinder pollutant dispersion and, due to the low level of lighting inside the location, there is practically no photodegradation. Considering the summer environmental temperature in Londrina, and that the lighter PAHs are present mainly in the vapor phase, PAHs were collected on solid sorbent, with the use of low flow rate and sampling duration in order to avoid formation of artifact.
Londrina is the fourth largest city in Southern Brazil and is located in the north of the state of Paraná (lat. 23°18’ S; long. 51°09’ W). It has a population of 543,000 inhabitants and approximately 360,000 automobile vehicles, with 61% being light vehicles. The study site is a covered parking lot in a commercial establishment (supermarket) for approximately 450 light vehicles located in the western side of Londrina. The parking lot was selected due to the characteristics it presented: a semi-closed place, known source of PAHs emission, i.e., vehicles burning ethanol and gasohol (fuel with 20-25% ethanol), security and facilities to collect the samples. The fuel characteristics of gasohol and ethanol are presented in Table 1. The building is situated between two large avenues that can be considered external sources of pollutants, and it is relatively close to
food industries. The sampling location inside the parking lot was chosen to minimize any possible external influence or photochemical reactions. The parking lot was designed to have one-way traffic. Access is controlled by numbered cards that the driver receives when entering the parking lot, which includes a brief stop followed by acceleration. Even under heavy traffic conditions, vehicles move slowly at free flow (around 20 km h−1) without having to wait in line. The
sampling was carried out in a single location, 50 m from the main entrance of the parking lot.
Sampling and analysis
The air samples at the supermarket parking lot were collected during the winter (June) and summer (December) 2012. The measurements were conducted continuously for nine and ten days, respectively, inside the parking lot, at 12 h intervals (9 am to 9 pm). All samplings were performed at approximately 1.8 m from the ground. The vapor-phase PAHs were collected in duplicate using a trapping device (SKC Inc.) consisting of a glass cartridge packed with XAD-2 resin supported by two polyurethane foam (PUF) plugs. Particulate-phase PAHs were pre-retained by a polytetrafluoroethylene (PTFE) filter (Millipore, 37 mm, 1 µm pore size) connected in series with the cartridge. The sampling device was protected with aluminum foil during the sampling period. Samples were collected at a flow rate of 2 L min–1, leading to an average sample volume of 2.88 m3.
The accuracy of the flow rate at the sampling device was determined by averaging the flow rates measured at the beginning and the end of the sampling period. The cartridges were stored in a clean screw-capped vial with a PTFE cap liner and placed in refrigerated containers for transportation.
Table 1. Gasohol and ethanol specifications used in Brazil in 2012 (Agência Nacional do Petróleo, Gás Natural e Biocombustíveis (ANP) resolutions No. 07/2011 and 57/2011)
Characteristic Common gasolinea Premium gasoline Ethanolb
Density at 20 oC / (g cm−3) 0.72-0.76 0.72-0.76 0.8075-0.8110
Residue / wt.% 2 2 5c
Anti-knock index 87 91 –
Pump, maximum / (g L−1) 0.005 0.005 –
Water, maximum / % – – 4.9
Methanol, maximum / % 0.5 0.5 0.5
Ethanold / % 20 2 94.5
Sulfur, maximum / (mg kg−1) 800 800 –
Olephines / % 30 30 –
Aromatics / % 45 45 –
Benzene, maximum / % 1.0 1.5 –
PAHs were extracted with 20 mL of a dichloromethane and methanol mixture (4:1) (high-performance liquid chromatography (HPLC)-grade, J. T. Baker) for 20 min using an ultrasonic bath in closed flasks. The emulsion was filtered, and the filtrate was concentrated under 40 oC
to approximately 2 mL. The extract volume was reduced to ca. 0.5 mL under a helium stream at room temperature and atmospheric pressure in closed flasks. The residue was dissolved with dichloromethane/methanol to exactly 1 mL as the final solution.11
PAHs samples were either analyzed immediately after collection or remained under refrigeration for a maximum of one day of storage, until analysis. The samples were analyzed using an HPLC system (DIONEX ULTIMATE 3000) equipped with a fluorescence detector (FD). Twenty µL of the extract were injected with the use of an auto-sampler. The PAHs were separated by gradient elution in the following conditions: a Metasil ODS Metachem column (250 mm × 4.6 mm × 5 µm); temperature of 35 oC;
H2O/CH3CN gradient mobile phase: 0 to 20 min, 65% CH3CN;
36 min, 100% CH3CN; 44 min, 65% CH3CN. The flow rate
at mobile phase was 1.0 mL min−1. For the fluorescence
detection, the excitation and emission wavelength pairs were programmed to change during the analytical run in order to optimize the detection of each component as shown in Table 2. Quantification was performed from the HPLC profiles using the external standard method. The external standard was purchased from RESTEK (EPA 610 mix No. 31555/610) containing 16 PAH compounds in
methanol/CH2Cl2, including naphthalene (NAP),
acenapthylene (ACY), acenapthene (ACE), fluorene (FLU), phenanthrene (PHE), anthracene (ANT), fluoranthene (FLT), pyrene (PYR), benzo(a)anthracene (BaA), chrysene (CHR), benzo(b)fluoranthene (BbF), benzo(k)fluoranthene (BkF), benzo(a)pyrene (BaP), indeno(1,2,3-cd)pyrene (INP), dibenzo(a,h)anthracene (DBA), benzo(ghi)perylene (BPE). Each analytical curve was constructed with five points for all the target analytes in a concentration ranging from 0.05 to 1.0 µg mL−1. The determination coefficient (r2) for all
PAHs was higher than 0.99. The HPLC was calibrated with a diluted standard solution and the serial dilution analyses from PAH standards presented limit of quantification
(LOQ) between 0.07 and 1.6 ng m−3. Each PAH recovery
was determined by spiking sample cartridges with a known amount of standard, following the same experimental procedure used for the sample treatment. Mean extraction recovery (n = 3) for the 10 PAH species ranged from 76 to 99%. These recoveries were taken into account during the reporting of sample levels. Appropriate corrections were made to the measured concentrations. Field blanks (pre-cleaned XAD resin) were obtained for every four samples.
The results from analyses performed on field blanks indicated no significant contamination, except for NAP. For this reason, NAP was not included in this work. The results from analyses performed on field blanks indicated no significant contamination. The concentration of vapor PAHs in the ambient air was operationally defined as the concentration passing through the Teflon filters and remaining retained in the adsorbent tubes.15
Results and Discussion
Vapor-phase PAH concentration
The samples were collected during the winter and summer of 2012 in a parking lot located in Londrina. During the winter sampling, the environmental temperature ranged from 15.7 to 19.8 ºC, with mean temperature of 17.8 ºC. Relative humidity varied from 83.2 to 95.8% with an average value of 89.6%. During the summer sampling, the environmental temperature ranged from 21.3 to 25.8 ºC with mean temperature of 24.3 ºC. Relative humidity varied from 66.4 to 94.0% with an average value of 83.9%. Table 3 presents the PAH limits of detection (LOD) and LOQ for the method and the recovery rate obtained.
Seven PAHs (acenapthylene, acenapthene, fluorene, phenanthrene, anthracene, fluoranthene and pyrene) were detected in the samples with the predominance for 3-ring PAHs at the vapor phase. Individual compound concentration was found in the range of 2.4 to 310 ng m−3
for PYR and ACE, respectively. Total PAH (∑ PAH),
estimated as the sum of daily mean concentrations, ranged from 38.1 to 909 ng m−3; the average PAH concentration
Table 2. Excitation and emission wavelength pairs of fluorescence detector
time / min Excitation wavelength / nm
Emission wavelength / nm
0 220 330
12.4 289 330
15.8 245 370
17.7 232 423
21.0 266 399
23.7 266 371
24.6 245 430
25.6 232 423
27.1 292 414
29.0 270 440
31.4 244 480
for winter was 83.5 ± 29.5 ng m-3 and 574 ± 220 ng m−3 for
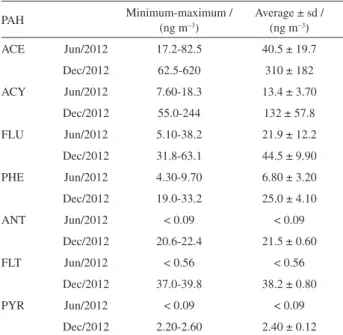
summer. Table 4 presents the PAH concentration range and average amount for the compounds under study.
During the summer, the concentrations for all PAHs quantified were higher than during the winter, ranging from
2.2 to 620.3 ng m−3. During winter, ANT, FLT and PYR
were below the quantification limit. Figure 1 presents the daily concentrations for the PAHs found in the air from inside the parking lot in June (winter) 2012. In general, ACE (49%) presented the highest concentration among the PAHs analyzed, followed by FLU (26%) and ACY (16%). Tuesdays and Wednesdays presented higher PAH concentrations in winter, which may be associated with the higher traffic flow on these days. In Brazil, it is common to have sale days in supermarkets and consequently, an increase in the number of people and traffic on these days. An increase in carbonyl compounds was also observed at the same place and days.16
In December 2012, seven PAHs were determined, wherein ACE and ACY occurred in greater concentration than the other PAHs. ACE presented the highest value, 620.3 ng m−3 on Saturday 15th, a behavior different than
the one observed during the winter. ACE contributed 54% to the total PAHs, followed by 23% for ACY, 7.8% for FLU, and 6.6% for FLT. Figure 2 presents the PAH daily concentrations obtained in December 2012 (summer).
The relative humidity inside the parking lot did not vary between the two campaigns (89.6 ± 3% in winter and 83.9 ± 9% in summer), while the average temperature ranged from 17.8 ± 2 °C in winter to 24.3 ± 2 °C in summer. The partitioning of semi-volatile compounds from the gas phase to the particles might increase in cooler ambient temperature, and this behavior can explain the PAH variation between the winter and summer campaigns. The partitioning of PAHs in air is a function of both ambient
temperature and volatility of the species. The ∑ PAH
daily concentration was approximately seven-fold higher in summer than in winter. The higher temperature and Table 4. Gas-phase PAH concentration range and average (ng m−3) in
winter and summer 2012 at a parking lot
PAH Minimum-maximum /
(ng m−3)
Average ± sd / (ng m−3)
ACE Jun/2012 17.2-82.5 40.5 ± 19.7
Dec/2012 62.5-620 310 ± 182
ACY Jun/2012 7.60-18.3 13.4 ± 3.70
Dec/2012 55.0-244 132 ± 57.8
FLU Jun/2012 5.10-38.2 21.9 ± 12.2
Dec/2012 31.8-63.1 44.5 ± 9.90
PHE Jun/2012 4.30-9.70 6.80 ± 3.20
Dec/2012 19.0-33.2 25.0 ± 4.10
ANT Jun/2012 < 0.09 < 0.09
Dec/2012 20.6-22.4 21.5 ± 0.60
FLT Jun/2012 < 0.56 < 0.56
Dec/2012 37.0-39.8 38.2 ± 0.80
PYR Jun/2012 < 0.09 < 0.09
Dec/2012 2.20-2.60 2.40 ± 0.12
PAH: polycyclic aromatic hydrocarbons; sd: standard deviation; ACE: acenapthene; ACY: acenaphtylene; FLU: fluorene; PHE: phenanthrene; ANT: anthracene; FLT: fluoranthene; PYR: pyrene.
Table 3. PAH limits of detection (LOD) and quantification (LOQ) (ng m−3)
using HPLC/FD and recovery rate (%)
PAH LOD /
(ng m−3)
LOQ / (ng m−3)
RR ± sd / %
Acenaphtene (ACE) 0.02 0.07 87 ± 9
Acenaphtylene (ACY) 0.52 1.60 91 ± 7
Anthracene (ANT) 0.03 0.09 88 ± 8
Benzo(a)anthracene (BaA) 0.03 0.10 81 ± 11
Benzo(a)pyrene (BaP) 0.14 0.53 92 ± 4
Benzo(b)fluoranthene (BbF) 0.04 0.13 76 ± 12 Benzo(ghi)perylene (BPE) 0.04 0.13 96 ± 6 Benzo(k)fluoranthrene (BKF) 0.04 0.13 84 ± 6
Crysene (CHR) 0.03 0.10 92 ± 4
Dibenzo(a,h)anthracene (DBA) 0.04 0.13 96 ± 5
Phenanthrene (PHE) 0.03 0.10 92 ± 4
Fluoranthene (FLT) 0.16 0.56 79 ± 7
Fluorene (FLU) 0.17 0.56 87 ± 6
Indeno(1,2,3-cd)pyrene (INP) 0.04 0.13 97 ± 6
Naphthalene (NAP) 0.04 0.13 96 ± 6
Pyrene (PYR) 0.03 0.09 99 ± 5
PAH: polycyclic aromatic hydrocarbon; LOD: limit of detection; LOQ: limit of quantification; RR: recovery rate; sd: standard deviation.
probably the higher number of vehicles in December may suggest the concentration difference between winter and summer. In Brazil, sales increase at the end of the year, especially of groceries due to the holiday season in December and the receiving of Christmas bonus by workers.
Low and middle molecular weight PAHs
The PAH species concentration was separated considering the low molecular weight PAHs (LM-PAHs), which are those containing three rings (NAP, ACY, ACE, FLU, PHE, ANT), and middle molecular weight (MM-PAHs) containing four rings (FLT, PYR, CHR).9 From the
total PAH analyzed (83.5 ng m−3 in winter and 574 ng m−3 in
summer), LM-PAHs corresponded to 93%. Abrantes et al.17
investigated emissions from vehicular engines using a chassis dynamometer powered with gasoline and anhydrous ethanol. The results presented as emission rate showed that lighter PAHs were prevalent, while larger molar mass PAHs were not detected. They also concluded that 92% of the PAHs were emitted from engines powered by gasoline.
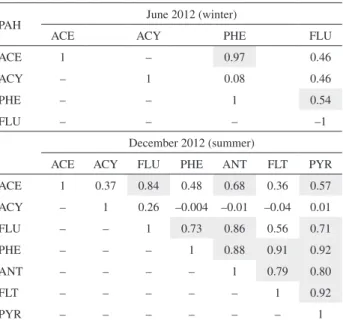
Considering the variability in the contributions of different PAHs, Pearson linear correlation coefficients (r) were calculated between certain pairs of species throughout the sampling campaigns in the commercial parking lot. The values are presented in Table 5. Significant linear correlations occurred between PHE and ACE (r = 0.97) and PHE and FLU (r = 0.54) in the winter of 2012. During summer, linear correlations were significant among several PAHs, including PYR, which were not significant during winter. The PHE, ANT, FLT and PYR group presented high linear correlations (r > 0.71) except for FLT and FLU (r = 0.56). Therefore, in order to characterize the emission signatures from the light-duty vehicle fleet in use
in Brazil burning gasoline and ethanol blend, the rates were calculated for the significantly correlated PAHs.
Diagnostic ratios (DR)
Diagnostic ratios (DR) are the rates of defined pairs of individual compounds. They have been widely used as markers of different PAH source categories, mainly for the distinction between pyrogenic and petrogenic sources. PAHs of similar molar masses are commonly chosen as indicators due to their minimal differences in volatility, solubility in water and adsorption.18 However, it is well
known that different combustion conditions may cause substantial variability in the emission and degradation of individual compounds, which can therefore impair the implementation of DR as a reliable tool.19 Thus, it is
recommended to perform DR calculation for PAHs when the source is sharp and the measurements are carried out near a known source, as performed in this work. In order to obtain the DR signature for the current Brazilian light-duty vehicular fleet, the ANT / (PHE + ANT), FLT / PYR and FLT / (FLT + PYR) ratios were chosen, since they are usually used for indication of combustion emissions.19 During winter, the FLT / PYR ratio of 4.1
and ANT / (PHE + ANT) ratio of 0.71 were obtained. For summer, three DR were calculated: FLT / PYR with a value of 15.9; FLT / (FLT + PYR) with a value of 0.94, and ANT / (PHEN + ANT) with 0.46. As expected, the ratios Figure 2. PAH daily concentrations obtained in December 2012 inside
the parking lot.
Table 5. Pearson linear correlation coefficients (r) between PAH pairs during winter and summer 2012
PAH June 2012 (winter)
ACE ACY PHE FLU
ACE 1 – 0.97 0.46
ACY – 1 0.08 0.46
PHE – – 1 0.54
FLU – – – –1
December 2012 (summer)
ACE ACY FLU PHE ANT FLT PYR
ACE 1 0.37 0.84 0.48 0.68 0.36 0.57
ACY – 1 0.26 –0.004 –0.01 –0.04 0.01
FLU – – 1 0.73 0.86 0.56 0.71
PHE – – – 1 0.88 0.91 0.92
ANT – – – – 1 0.79 0.80
FLT – – – – – 1 0.92
PYR – – – – – – 1
indicate a petrogenic source considering the ratios typically reported in literature for gas-phase PAHs.19-22
Results from studies conducted in Brazil in environments with characterized sources were performed in road tunnels in the city of São Paulo.5,12 However, they reported PAHs in
particulate phase, which does not enable DR comparison. In addition, comparisons using results obtained in different countries are not recommended due to the difference in the composition of combustible mixtures. In general, DRs are better indicators when the air samples are collected in receiver areas that are heavily affected by specific sources. Finally, another important aspect that should be mentioned is that variations in the flow of light-duty vehicles do not alter the emission characteristics inside the parking lot.
Acetaldehyde and PAHs
During the winter and summer campaigns, considering all days sampled, Saturday presented the highest concentrations of PAHs when compared to the other weekdays, which may be associated with the increase in the flow of vehicles. In the same period, during the same campaign, carbonyl compounds were determined and an increase in acetaldehyde (AA) was also observed.16 The
higher aldehyde emission is typical from the ethanol use in Brazilian cars. Figure 3 shows the acenaphthene and acetaldehyde profiles for the winter and summer campaigns.
Figure 3 shows strong similarity between ACE and AA profiles, suggesting the same source of emission for both species. The correlation coefficients between ACE and AA concentrations were 0.71 and 0.63 for winter and summer, respectively. The agreement between profiles was clearer for the campaigns, the vehicles burning gasoline and ethanol blends contributed to the emission of pollutants that can cause consequences to the environment.
Conclusions
By using measurements from a parking lot site, characteristic semi-volatile PAH profiles from gasoline and ethanol blend emission used in Brazil are proposed. ACE appears as the most abundant PAH, followed by ACY (in the summer) and FLU (in the winter). The PAH source fingerprint identified in this study was obtained from a location with known sources, with FLT / (FLT + PYR) and ANT / (ANT + PHE) ratios of 0.94 and 0.46, respectively, which is characterized as being from a gasoline and ethanol blend emission. Certainly, this information can be used to assess real-world situations where PAH contributions are considered a result of several complex sources.
Acknowledgments
This study received financial support in the form of a grant from the National Institute of Science and Technology for Energy and Environment (INCT-EA; notification 15/2008). The authors would also like to thank the National Council of Technological and Scientific Development (CNPq), Process No. 308211/2010-3, Coordination for the Improvement of Higher Education Personnel (CAPES) and Araucária Foundation/Paraná.
References
1. Benner, B. A.; Gordon, G. E.; Wise, S. A.; Environ. Sci. Technol.
1989, 23, 1269.
2. Miguel, A. H.; Kirchstetter, T. W.; Harley, R. A.; Environ. Sci. Technol. 1988, 32, 450.
3. Oda, J.; Nomura, S.; Yasuhara, A.; Shibamoto, T.; Atmos. Environ. 2001, 35, 4819.
4. Wingfors, H.; Sjödin, A.; Haglund, P.; Brorstöm-Lundén, E.;
Atmos. Environ. 2001, 35, 6361.
5. Vasconcellos, P. C.; Zacarias, D.; Pires, M. A. F.; Pool, C. S.; Carvalho, L. R. F.; Atmos. Environ.2003, 37, 3009.
6 Associação Nacional dos Fabricantes de Veículos Automotores (ANFAVEA), 2014, http://www.anfavea.com.br/tabelas2014. html accessed in January 2016.
7. Andrade, M. F.; Ynoue, R. Y.; Freitas, E. D.; Todesco, E.; Vela, A. V.; Ibarra, S.; Martins, L. D.; Martins, J. A.; Carvalho, V. S. B.; Front. Environ. Sci.2015, 3, 1.
8. Pereira, P. A. P.; Lopes, W. A.; Carvalho, L. S.; da Rocha, G. O.; Bahia, N. C.; Loyola, J.; Quitério, S. L.; Escaleira, V.; Arbilla, G.; de Andrade, J. B.; Atmos. Environ. 2007, 41, 7837. 9. Tavares Jr., M.; Pinto, J. P.; Souza, A. L.; Scarmínio, I.; Solci,
M. C.; Atmos. Environ. 2004, 38, 5039.
10. da Rocha, G. O.; Lopes, W. A.; Pereira, P. A. P.; Vasconcellos,
P. C.; Oliveira, F. S.; Carvalho, L. S.; Conceição, L. S.; de Andrade, J. B.; J. Braz. Chem. Soc.2009, 20, 680. 11. Martins, L. D.; da Silva Jr., C. R.; Solci, M C.; Pinto, J. P.;
Souza, D. Z.; Vasconcellos, P.; Guarieiro, A. L. N.; Guarieiro, L. L. N.; Sousa, E. T.; Andrade, J. B.; Environ. Monit. Assess.
2012, 184, 2663.
12. Brito, J.; Rizzo, L. V.; Herckes, P.; Vasconcellos, P. C.; Caumo, S. E. S.; Fornaro, A.; Ynoue, R. Y.; Artaxo, P.; Andrade, M. F.;
Atmos. Chem. Phys. 2013, 13, 12199.
13. Dutcher, D. D.; Stolzenburg, M. R.; Thompson, S. L.; Medrano, J. M.; Gross, D. S.; Kittelson, D. B.; McMurry, P. H.;
Atmosphere2011, 2, 182.
14. Kim, K.; Jahan, S. A.; Kabir, E.; Brown, R. J. C.; Environ. Int.
2013, 60, 71.
15. Park, J.-S.; Wade, T. L.; Sweet, S.; Atmos. Environ. 2001, 35, 3241.
16. Pinto, J. P.; Martins, L. D.; da Silva Jr., C. R.; Sabino, F. C.; Amador, I. R.; Solci, M. C.; Atmos. Pollut. Res. 2014, 5, 404.
17. Abrantes, R.; Assunção, J. V.; Pesquero, C. R.; Bruns, R. E.; Nóbrega, R. P.; Atmos. Environ. 2009, 43, 648.
18. Kuo, C.; Chien, P.; Kuo, W.; Wei, C.; Rau, J.; Environ. Monit. Assess. 2013, 185, 5749.
19. Katsoyiannis, A.; Sweetman, A. J.; Jones, K. C.; Environ. Sci. Technol. 2011, 45, 8897.
20. Tobiszewski, M.; Namiesnik, J.; Environ. Pollut. 2012, 162, 110.
21. Ravindra, K.; Sokhi, R.; Grieken, R.; Atmos. Environ. 2008,
42, 2895.
22. Athanasios, K.; Andrew, J. S.; Kevin, C. J.; Environ. Sci. Technol.2011, 45, 8897.