Obstructive Pulmonary Disease In-Hospital Care: A Joint
Analysis from the AUDIPOC and European COPD Audit
Studies
Jose Luis Lopez-Campos1,2*, M. Isabel Asensio-Cruz1, Ady Castro-Acosta2,3, Carmen Calero1,2,
Francisco Pozo-Rodriguez2,3, on behalf of the AUDIPOC and the European COPD Audit studies"
1Unidad Me´dico-Quiru´rgica de Enfermedades Respiratorias, Instituto de Biomedicina de Sevilla (IBiS), Hospital Universitario Virgen del Rocio/Universidad de Sevilla, Sevilla, Spain,2Centro de Investigacio´n Biome´dica en Red de Enfermedades Respiratorias (CIBERES), Instituto de Salud Carlos III, Madrid, Spain,3Hospital 12 de Octubre, Instituto de Investigacio´n i+12, Madrid, Spain
Abstract
Background:Clinical audits have emerged as a potential tool to summarize the clinical performance of healthcare over a specified period of time. However, the effectiveness of audit and feedback has shown inconsistent results and the impact of audit and feedback on clinical performance has not been evaluated for COPD exacerbations. In the present study, we analyzed the results of two consecutive nationwide clinical audits performed in Spain to evaluate both the in-hospital clinical care provided and the feedback strategy.
Methods:The present study is an analysis of two clinical audits performed in Spain that evaluated the clinical care provided to COPD patients who were admitted to the hospital for a COPD exacerbation. The first audit was performed from November–December 2008. The feedback strategy consisted of personalized reports for each participant center, the presentation and discussion of the results at regional, national and international meetings and the creation of health-care quality standards for COPD. The second audit was part of a European study during January and February 2011. The impact of the feedback strategy was evaluated in term of clinical care provided and in-hospital survival.
Results:A total of 94 centers participated in the two audits, recruiting 8,143 admissions (audit 1:3,493 and audit 2:4,650). The initially provided clinical care was reasonably acceptable even though there was considerable variability. Several diagnostic and therapeutic procedures improved in the second audit. Although the differences were significant, the degree of improvement was small to moderate. We found no impact on in-hospital mortality.
Conclusions: The present study describes COPD hospital care in Spanish hospitals and evaluates the impact of peer-benchmarked, individually written and group-oral feedback strategy on the clinical outcomes for treating COPD exacerbations. It describes small to moderate improvements in the clinical care provided to COPD patients with no impact on in-hospital mortality.
Citation:Lopez-Campos JL, Asensio-Cruz MI, Castro-Acosta A, Calero C, Pozo-Rodriguez F, et al. (2014) Results from an Audit Feedback Strategy for Chronic Obstructive Pulmonary Disease In-Hospital Care: A Joint Analysis from the AUDIPOC and European COPD Audit Studies. PLoS ONE 9(10): e110394. doi:10.1371/ journal.pone.0110394
Editor:James D. Chalmers, University of Dundee, United Kingdom
ReceivedJune 16, 2014;AcceptedAugust 21, 2014;PublishedOctober 15, 2014
Copyright:ß2014 Lopez-Campos et al. This is an open-access article distributed under the terms of the Creative Commons Attribution License, which permits
unrestricted use, distribution, and reproduction in any medium, provided the original author and source are credited.
Data Availability:The authors confirm that all data underlying the findings are fully available without restriction. All relevant data are within the paper and its Supporting Information files.
Funding:AUDIPOC study was funded by Fondo de Investigacio´n Sanitaria, Spanish Ministry of Health, project numbers PI07/90129, PI07/90309, PI07/90486, PI07/90503, PI07/90516, PI07/90721, PI08/90129, PI08/90578, PI08/90251, PI08/90529, PI08/90129, PI07/90403, PI08/90447, PI08/90457, PI08/90486, and PI08/ 90550. The European COPD audit was funded by the European Respiratory Society. The funders had no role in study design, data collection and analysis, decision to publish, or preparation of the manuscript.
Competing Interests:The authors have declared that no competing interests exist. * Email: [email protected]
"Membership of the AUDIPOC and the European COPD Audit studies is provided in File S1.
Introduction
The existence of a gap between the healthcare that patients actually receive and the guidelines for that healthcare is now well acknowledged [1]. The variations in clinical practice establish a complex interplay of different factors that impact the resulting
clinical care provided to patients and the clinical outcomes. Accordingly, the information obtained in an audit should be used to improve care, and several pathways for this aim have been described [4].
In this context, feedback from the audited information constitutes a key step to improve clinical practice [5]. A key question is how successful audit and feedback are in motivating health professionals to modify their clinical practice. To date, several systematic reviews have assessed the effectiveness of audit and feedback with inconsistent results [6,7]. A recent Cochrane systematic review concluded that audit and feedback generally lead to small, but potentially important, improvements in health care that depend on both the baseline performance and how the feedback is provided [8]. Accordingly, the impact of audit and feedback should be monitored by auditing clinical practices after implementing an intervention [3]; however, it should be acknowl-edged that the potential effect may also be influenced by the characteristics of the studied disease.
Chronic obstructive pulmonary disease (COPD) is a major and growing health problem [9]. Patients with COPD often suffer episodes of exacerbation during the course of their disease that often require hospitalization; these exacerbations are associated with significant mortality and morbidity [10,11] and are respon-sible for most of the social and economic burden of COPD [12]. Thus, the clinical care provided to patients who are admitted to the hospital for a COPD exacerbation should be carefully evaluated. However, the impact of audit and feedback on clinical performance has not been evaluated for COPD exacerbations.
In recent years, Spain had used an auditing process for COPD, named AUDIPOC, which has resulted in the completion of two major clinical audits in the country [13,14]. In the present study, we evaluated the results of two consecutive clinical audits performed in Spain to assess the clinical care provided to patients who were admitted to the hospital with a physician discharge diagnosis of a COPD exacerbation. The analysis will compare the performances in both audits to evaluate the components of the feedback approach that enhance COPD clinical performance.
Methods
The present study is an analysis of two clinical audits performed in Spain that evaluated the clinical care provided to COPD patients who were admitted to the hospital for a COPD exacerbation. Both audits had a similar methodology that has been extensively reported in previous publications [13,14]. Briefly, both studies were clinical audits with prospective case ascertain-ment of consecutive exacerbation hospital admissions and retrospective data gathering from medical records. All cases admitted to the hospital in any Department or Unit during a 2-month period with a discharge diagnosis of COPD exacerbation were included. The inclusion of a case in the audit was finally decided upon discharge if the diagnosis of COPD exacerbation was included in the discharge report as the cause of admission. The cases with a specific diagnosis that was different from a COPD exacerbation upon admission, including pulmonary edema, pneumonia, pulmonary embolism, pneumothorax, rib fractures, aspiration, pleural effusion or any other associated respiratory or non-respiratory condition, were excluded. The medical records of the included patients were reviewed, and the audit data were extracted. The survivals were followed-up for 90 days from hospitalization to evaluate their vital status and whether the patient had been readmitted. The participant investigators were asked to complete a resource and organization database
recording the hospital and respiratory unit or department resources.
The first audit was conducted from November–December 2008, and 129 hospitals participated, recruiting 5,178 patients. The second audit was part of a European study in which 432 centers from 13 countries recruited 18,016 patients. In Spain, 94 hospitals participated and recruited a total of 5,271 cases during January– February 2011. For the purpose of the present study, we selected the centers that participated in both audits. Ninety-four centers were included in this analysis. Altogether, a total of 8,143 cases were included in both audits.
The recorded variables have been reported and included information on the patient characteristics (e.g., age and gender), disease characteristics (e.g., disease severity, clinical features and exacerbation), resources available (e.g., hospital structure, hospital materials and human resources) and clinical practice (e.g., the adopted diagnostic and therapeutic interventions and the adjust-ment to clinical guidelines). Adherence to the clinical practice guidelines was analyzed following the GOLD recommendations for exacerbation management, which were available at the time of each audit. An adequate use of mechanical ventilation or antibiotics was considered to be present when a patient with such prescriptions correctly received them or when a patient who did not have such prescriptions did not receive them accordingly.
After the first audit, feedback was planned in three different ways. First, a specific report was created for each participant center. In this report, the value of each recorded variable was presented for that center and benchmarked against the regional and national values. Second, the results of the audit were presented in the Spanish Society of Pneumology and Thoracic Surgery (SEPAR) annual congress and in the European Respira-tory Society (ERS) annual meeting, and all investigators were invited to attend. Additionally, several smaller local meetings were planned during the next two years following the first audit to communicate the results. Notably, investigators were encouraged to organize meetings at the regional level to discuss the audit results, and several meetings were organized. Third, after the first audit, the SEPAR organized a working committee to create COPD healthcare quality standards, which were made available to all respiratory physicians [15]. All these initiatives were performed during 2009 and 2010, and the second audit was conducted in 2011. After the first audit, participants were not informed of an upcoming second audit.
In Spain, both audits were approved by the institutional review board of Hospital Universitario Virgen del Rocı´o (approval acta 07/2008 and 16/2010) and confirmed by each participating hospital [13,16]. Additionally, the hospital management director of each center authorized the audit and agreed not to inform the medical staff that the audit was being conducted so that their medical practice would not change. According to ethical regulations, all data were de-identified in the database by an audit number that was not related to the medical record number or to any personal data. There was no personal information in the database that could be used to identify the patient.
Statistical analysis
t-test (evaluating the variance equivalence with the Levene’s test) or chi-squared test (with the Fisher’s exact test, if required). Kaplan-Meier curves were constructed that evaluated in-hospital survival using the log-rank test to compare the in-hospital global mortality in both audits. The alpha error was set at 0.05.
Results
Ninety-four Spanish hospitals participated in both clinical audits. The main characteristics of the participant hospitals are summarized in table 1. The participating hospitals were largely public hospitals, with a high proportion being university/teaching hospitals and having a respiratory ward or team. The distribution of the participating hospitals among the different administrative regions is given in table S1 of the online supplement. All the regions in the country participated in this study.
A total of 8,143 admissions were analyzed from the two audits (audit 1: 3,493; audit 2: 4,650). The characteristics of the patients are summarized in table 2. The cases were mostly males in their eighth decade of life with a high proportion of active smokers. The number of patients with no information on their forced expiratory volume in one second (FEV1) was 3,273, including 2,874 patients
without spirometry and 399 patients with some spirometric information but no FEV1. Altogether, the availability of the
FEV1significantly improved in the second audit. The majority of
these patients were considered to have severe or very severe disease. More than 40% of the patients had not been previously admitted, and this percentage increased significantly in the second audit. Although there were some statistical differences, the clinical presentation according to the three Anthonisen criteria was not clinically different between the audits.
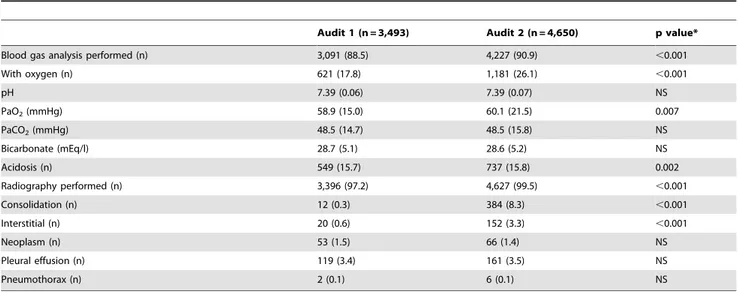
The diagnostic procedures improved by the second audit (table 3). The proportion of cases with blood gas analysis significantly increased from 88.5 to 90.9%, and radiographies were also slightly more frequently performed in the second audit than in the first (99.5% vs. 97.2%). Although the increases were significant, they were not extremely different. The severity of the blood gas alterations was similar between the audits. An unexpected finding was the high proportion of consolidations in the radiographies for the second audit.
The therapeutic interventions before admission, during hospi-talization and at discharge are summarized in table 4. Before admission, the number of administered treatments increased in the second audit, with a special emphasis on short-acting bronchodi-lators, long-acting muscarinic antagonists (LAMA) and systemic steroids. During admission, there were also some differences between the audits, but they were less striking. Notably, there was a significant decrease in systemic steroid use and a slight decrease in oxygen use in the second audit. The therapeutic recommen-dations at discharge were similar. Although the differences were significant, the percentages of each therapeutic option were not very dramatic.
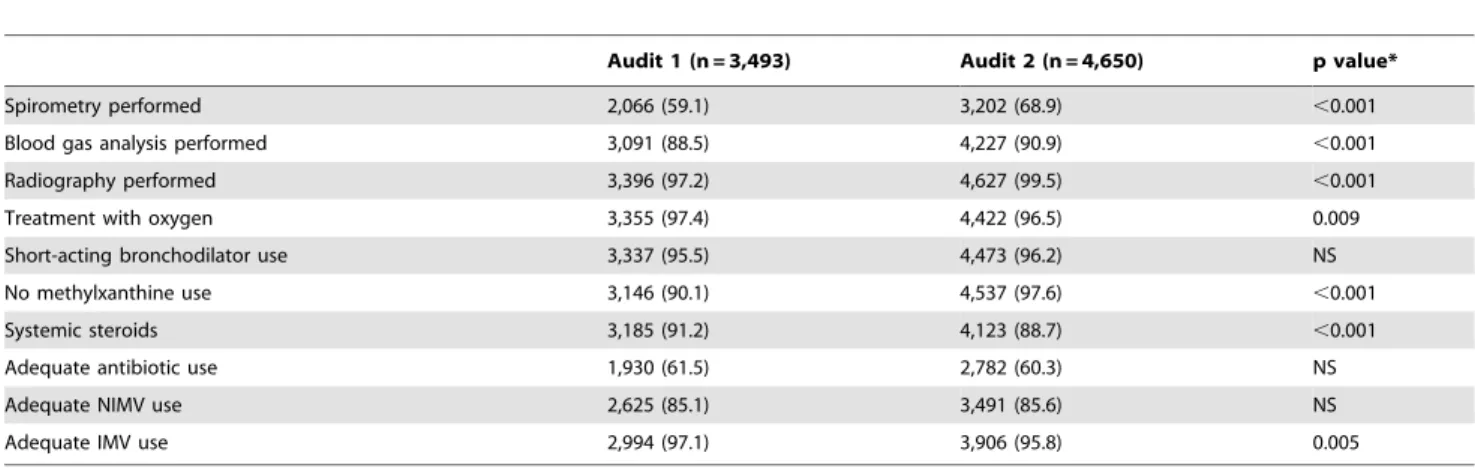
The 10 recommendations evaluated according to the GOLD guidelines are summarized in table 5. The majority of these recommendations improved in the second audit. However, although the differences were significant, they were not very striking.
The survival curves for both audits are shown in figure 1. The in-hospital mortality was not different between the two audits. The first audit reported 164 (4.7%) deaths, and the second reported 202 (4.3%) deaths, and this difference was not significantly different. Accordingly, the median survival in the Kaplan-Meier analysis was not significantly prolonged in the second audit (56.7 days) compared with the first audit (64.6 days). The lengths of stay
were very similar between the two audits, with 8.7 (7.8) days in audit 1 and 8.5 (7.3) days in audit 2 (not significantly different).
Discussion
The present study describes the state of COPD hospital care in Spanish hospitals and evaluates the impact of a feedback strategy on clinical care. After two consecutive audits, with feedback performed in between audits, we have observed some improve-ments in the clinical care provided to COPD patients. However, the majority of these improvements were small or moderate and did not impact the in-hospital mortality. This finding suggests that performing a clinical audit and providing the participant centers with the results according to our feedback strategy increased awareness and improved some aspects of COPD exacerbations, although there was no clear benefit on the outcomes.
The performance of a blood gas analysis is one of the key diagnostic measures for evaluating the severity of an exacerbation in hospitals. In those centers that do not offer this procedure, the
alternative is to use pulse-oximetry to evaluate oxygen saturation. However, this method does not measure the pH or PaCO2,
potentially leading to an incorrect assessment [22]. The use of
Table 1.General characteristics of the hospitals participating in both audits.
Variables Mean IRR p value*
General characteristics
Number of beds (n) 555.3 273–1073 0.049
Catchment population (inhabitants) 324.344 149.799–705.727 NS
University/teaching hospital (%) 62 0–100 NS
Public hospital (%) 98.7 66.7–100 NS
Hospital with intensive care unit (%) 89.9 50–100 0.020
Number of beds in intensive care unit (n) 15 4–26 NS
Spirometry available (%) 100 100–100 NS
Hospital with a respiratory ward (%) 78.5 50–100 NS
Hospital with a respiratory team (%) 96.2 75–100 NS
Material resources
Respiratory outpatient clinic (%) 100 100–100 NS
COPD outpatient clinic (%) 59.5 0–100 NS
Specialty triage system (%) 8.9 0–100 0.039
Emergency department (%) 86.1 66.7–100 NS
Intermediate care unit (%) 30.4 0–100 NS
Number of beds in intermediate care unit (n) 7.8 4–30 NS
Offer non-invasive ventilation for acidosis (%) 96.2 66.7–100 NS
Offer invasive ventilation for acidosis (%) 81.0 50–100 NS
Human resources
Chest physicians (n) 8.7 5–16 0.071
Chest physicians per 1000 beds (n) 17.3 1.2–27.2 0.001
Respiratory trainees (n) 3.6 1.25–7.5 0.025
Respiratory trainees per 100 beds (n) 5.9 2.4–26 ,0.001
Physiotherapists (n) 1.4 0.25–3 ,0.001
Physiotherapists per 1000 beds (n) 3.1 0.3–15.4 ,0.001
Specialist nurses (n) 4.5 0–21.3 ,0.001
Specialist nurses per 100 beds (n) 7.1 0–20.4 ,0.001
Lung function technicians (n) 2.1 1.4–2.3 0.046
Lung function technicians per 1000 beds (n) 4.8 1.1–11.4 0.011
Hospital performance
Admissions for any cause in the previous year (n) 62.802.5 25.142–154.244 0.044
Percentage of COPD admissions in the unit (%) 57.9 29–83 NS
Daily respiratory physician on call (%) 25.3 0–100 NS
Number of ward rounds (n) 1.5 1–3.1 NS
Percentage of patients seen by physiotherapist (%) 21.9 0–90 NS
Percentage of patients seen by respiratory physician (%) 54.6 30–95 NS
Capacity to perform NIMV on all eligible patients (%) 56.6 0–100 NS
Capacity to perform IMV on all eligible patients (%) 76.6 50–100 NS
Early discharge program (%) 20.3 0–100 ,0.001
Percentage of patients in the early discharge program (%) 20.4 5–40 NS
Ability to care for long-term oxygen therapy patients (%) 97.5 66.7–100 NS
Ability to care for home-ventilated patients (%) 89.9 66.7–100 NS
Percentage of patients with rehabilitation (%) 29.7 10–100 0.021
Data are expressed as the mean or relative frequency according to the nature of the variable. IRR: Inter-regional range. NS: not significant. *p value for the differences between the Spanish regions calculated by the ANOVA or chi-square test.
Table 2.Characteristics of the patients included in each audit.
Audit 1 (n = 3,493) Audit 2 (n = 4,650) p value*
Age (years) 73.3 (10.05) 72.7 (10.6) 0.007
Males (n) 3,036 (86.9) 4,001 (86.0) NS
Tobacco
NCurrent smokers (n) 772 (22.1) 1,129 (24.3) 0.023
NEx-smokers (n) 2,069 (59.2) 3,022 (65.0) ,0.001
NNever smokers (n) 151 (4.3) 211 (4.5) NS
NMissing (n) 501 (14.3) 288 (6.2) ,0.001
Tobacco history (pack-years) 55.4 (29.6) 51.8 (32.6) ,0.001
Comorbidities (Charlson) 2.8 (1.8) 1.7 (1.7) ,0.001
Body mass index (kg/m2) 27.6 (5.3) 27.7 (5.4) NS
Spirometry: FEV1(%) 44.8 (17.0) 45.1 (16.4) NS
GOLD spirometric assessment:
NNo information available 1,812 (51.9) 1,461 (31.4) ,0.001
NNo obstruction 157 (4.5) 247 (5.3) NS
NMild (n) 50 (1.4) 74 (1.6) NS
NModerate (n) 422 (12.1) 887 (19.1) ,0.001
NSevere (n) 737 (21.1) 1,424 (30.6) ,0.001
NVery severe (n) 315 (9.0) 557 (12.0) ,0.001
First admission (n) 1,415 (40.5) 2,093 (45.0) ,0.001
Respiratory ward (n) 1,921 (55.5) 2,637 (56.7) NS
Dyspnea increase (n) 3,328 (95.3) 4,431 (95.3) NS
Sputum increase (n) 2,258 (64.6) 3,140 (67.5) 0.004
Sputum color change (n) 1,654 (47.4) 2,349 (50.5) 0.002
Data are expressed as the mean (standard deviation) or absolute (relative) frequencies. NS: not significant. FEV1: forced expiratory volume in one second. *Calculated using the unpaired Student’st-test or chi-square test.
doi:10.1371/journal.pone.0110394.t002
Table 3.Diagnostic procedures performed during admission in each audit.
Audit 1 (n = 3,493) Audit 2 (n = 4,650) p value*
Blood gas analysis performed (n) 3,091 (88.5) 4,227 (90.9) ,0.001
With oxygen (n) 621 (17.8) 1,181 (26.1) ,0.001
pH 7.39 (0.06) 7.39 (0.07) NS
PaO2(mmHg) 58.9 (15.0) 60.1 (21.5) 0.007
PaCO2(mmHg) 48.5 (14.7) 48.5 (15.8) NS
Bicarbonate (mEq/l) 28.7 (5.1) 28.6 (5.2) NS
Acidosis (n) 549 (15.7) 737 (15.8) 0.002
Radiography performed (n) 3,396 (97.2) 4,627 (99.5) ,0.001
Consolidation (n) 12 (0.3) 384 (8.3) ,0.001
Interstitial (n) 20 (0.6) 152 (3.3) ,0.001
Neoplasm (n) 53 (1.5) 66 (1.4) NS
Pleural effusion (n) 119 (3.4) 161 (3.5) NS
Pneumothorax (n) 2 (0.1) 6 (0.1) NS
Data are expressed as the mean (standard deviation) or absolute (relative) frequencies. NS: not significant. PaO2: partial pressure of oxygen in arterial blood. PaCO2: partial pressure of carbon dioxide in arterial blood.
Previous admission During admission At discharge
Audit 1 (n = 3,493) Audit 2 (n = 4,650) p value* Audit 1 (n = 3,493) Audit 2 (n = 4,650) p value* Audit 1 (n = 3,493) Audit 2 (n = 4,650) p value*
SABA (n) 1,227 (35.1) 2,183 (46.9) ,0.001 3,069 (87.9) 4,184 (90.0) 0.003 1,703 (48.8) 1,894 (40.7) ,0.001
SAMA (n) 587 (16.8) 1,022 (22.0) ,0.001 3,062 (87.7) 4,333 (93.2) ,0.001 780 (22.3) 834 (17.9) ,0.001
LABA alone (n) 186 (5.3) 265 (5.7) ,0.001 – – – 229 (6.6) 339 (7.3) ,0.001
LAMA (n) 1,286 (36.8) 2,446 (52.6) ,0.001 – – – 2,243 (64.2) 3,055 (65.7) ,0.001
ICS alone (n) 277 (7.9) 301 (6.5) ,0.001 448 (12.8) 844 (18.2) ,0.001 284 (8.1) 278 (6.0) ,0.001
ICS/LABA combination (n) 1,529 (43.8) 2,819 (60.6) ,0.001 – – – 2,584 (74.0) 3,487 (75.0) ,0.001
Methylxanthines (n) 235 (6.7) 412 (8.9) ,0.001 347 (9.9) 113 (2.4) ,0.001 336 (9.6) 417 (9.0) ,0.001
Systemic steroids (n) 415 (11.9) 771 (16.6) ,0.001 3,185 (91.2) 4,123 (88.7) ,0.001 2,407 (68.9) 2,908 (62.5) ,0.001
Antibiotics (n) 524 (15.0) 847 (18.2) ,0.001 3,129 (89.6) 4,309 (92.7) ,0.001 1,808 (51.8) 2,284 (49.1) ,0.001
Oxygen (n) – – – 3,355 (97.4) 4,422 (96.5) 0.009 1,474 (42.2) 1,892 (40.7) ,0.001
Non-invasive ventilation (n) – – – 353 (10.1) 555 (11.9) ,0.001 210 (6.0) 318 (6.8) ,0.001
Invasive ventilation (n) – – – 28 (0.8) 80 (1.7) ,0.001 – – –
Data are expressed as the mean (standard deviation) or absolute (relative) frequencies. NS: not significant. SABA: Short-acting beta agonist, SAMA: short-acting muscarinic antagonist. LABA: acting beta agonist, LAMA: long-acting muscarinic antagonist, ICS: inhaled corticosteroid.
*Calculated using the unpaired Student’st-test or chi-square test. The figures for non-invasive ventilation at discharge refer to home mechanical ventilation. –: not applicable or not recorded.
doi:10.1371/journal.pone.0110394.t004
Audit
and
Feedback
in
COPD
ONE
|
www.ploson
e.org
6
October
2014
|
Volume
9
|
Issue
10
|
chest radiography is another diagnostic intervention that is needed to eliminate other potential accompanying conditions that may mimic or worsen the exacerbation. In this regard, there is an ongoing debate on the significance of the consolidation frequently found in these COPD patients [23]. Additionally, from a therapeutic standpoint, several positive changes were observed after the feedback strategy was implemented. Short-acting bronchodilators were more frequently used, and the use of methylxanthines, which are no longer recommended, was decreased. Interestingly, the use of systemic steroids was also decreased, which is an unexplained finding that will need to be addressed in the future. The adequate use of invasive mechanical ventilation will also need to be further explored. However, all of these measures had a negligible impact on in-hospital mortality or length of stay and several factors are deemed to play a role in determining such clinically relevant endpoints. One potential
explanation for such a finding is the presence of a ceiling effect with a good starting position for the majority of the items. Previous studies have demonstrated the influence of the baseline perfor-mance on the potential improvement gained [24]. Another explanation may be related to the feedback strategy used. Although it seems intuitive that health care professionals will modify their clinical practice if they receive feedback that their clinical practice is inconsistent with those of their peers or the accepted guidelines, this outcome has not been consistently demonstrated. Although there is some controversy that feedback with peer comparison is either more or less effective than other initiatives [25,26], we provided feedback that was benchmarked against the peer average because providing this information may help participants understand the relative deviation of their own measures, which could improve patient outcomes.
Feedback can be delivered in different ways, and audit and feedback can be used as components of a multifaceted strategy to improve the quality of healthcare. In our study, we provided oral and written information at the individual level and oral information at the group level. Additionally, healthcare quality standards for COPD were constructed according to the experience with the first AUDIPOC audit [15]. Although this feedback strategy informs the participants of the audit results, alternative feedback strategies may result in different outcomes. For example, there are care bundles, including several evidence-based practices, that should be delivered to all patients to guarantee a set of minimum requirements for clinical care and several initiatives for COPD have been implemented [27,28].
Some limitations must be considered when interpreting our results. Within each region, the participating hospitals volun-teered. Therefore, although all regions were sampled, there was no attempt at representative sampling. As a consequence, the hospitals involved in the study were different in organizational terms and there was a certain degree of variability concerning the available resources (Table 1). However, the participating centers were identical for both audits. Additionally, the investigators were the same for the majority of the involved centers. We therefore believe that the potential impact of structural differences between the first and the second audits should be minimal. Another limitation is the considerably high number of investigators who
Table 5.Adjustment to the GOLD guidelines.
Audit 1 (n = 3,493) Audit 2 (n = 4,650) p value*
Spirometry performed 2,066 (59.1) 3,202 (68.9) ,0.001
Blood gas analysis performed 3,091 (88.5) 4,227 (90.9) ,0.001
Radiography performed 3,396 (97.2) 4,627 (99.5) ,0.001
Treatment with oxygen 3,355 (97.4) 4,422 (96.5) 0.009
Short-acting bronchodilator use 3,337 (95.5) 4,473 (96.2) NS
No methylxanthine use 3,146 (90.1) 4,537 (97.6) ,0.001
Systemic steroids 3,185 (91.2) 4,123 (88.7) ,0.001
Adequate antibiotic use 1,930 (61.5) 2,782 (60.3) NS
Adequate NIMV use 2,625 (85.1) 3,491 (85.6) NS
Adequate IMV use 2,994 (97.1) 3,906 (95.8) 0.005
Data are expressed as the mean (standard deviation) or absolute (relative) frequencies. NS: not significant. NIMV: non-invasive mechanical ventilation. IMV: invasive mechanical ventilation.
*Calculated using the unpaired Student’st-test or chi-square test. doi:10.1371/journal.pone.0110394.t005
Figure 1. Kaplan-Meier curves comparing the in-hospital
survival between the audits. The grey line represents the first
recorded the information using different information sources, as is intrinsically associated with audits.
In summary, our study evaluated the impact of a peer-benchmarked, individually written and group-oral feedback strategy on the clinical outcomes for treating COPD exacerba-tions. The results of our study suggest that performing a clinical audit and providing the participant centers with the results according to our feedback strategy increased awareness and improved some aspects of COPD exacerbation treatment. Accordingly, other feedback strategies may yield different results. Although we did not observe a clear benefit in the clinical outcomes, several aspects of the diagnostic and therapeutic clinical care provided to the COPD patients admitted to hospitals seemed to improve, which, in turn, may reduce the gap between the healthcare that patients receive and the guidelines for that care.
Supporting Information
Table S1 Percentual distribution of the cases included in both audits according to the region within the country.
(DOCX)
File S1 Membership of the AUDIPOC and the European COPD Audit studies.
(DOCX)
Acknowledgments
The authors are thankful to Enzo Emanuele, MD, PhD (Living Research s.a.s., Robbio, Italy) for his expert editorial assistance.
Author Contributions
Analyzed the data: JLLC MIAC CC. Contributed to the writing of the manuscript: JLLC ACA FPR.
References
1. Asch SM, Kerr EA, Keesey J, Adams JL, Setodji CM, et al. (2006) Who is at greatest risk for receiving poor-quality health care? N Engl J Med 354: 1147– 1156.
2. Agabiti N, Belleudi V, Davoli M, Forastiere F, Faustini A, et al. (2010) Profiling hospital performance to monitor the quality of care: the case of COPD. Eur Respir J 35: 1031–1038.
3. Flottorp SA (2010) Using audit and feedback to health professionals to improve the quality and safety of health care. Copenhagen European Observatory on Health Systems and Policies: WHO. regional office for Europe; IX, 42 p. 4. Berwick DM, James B, Coye MJ (2003) Connections between quality
measurement and improvement. Med Care 41: I30–38.
5. Mugford M, Banfield P, O’Hanlon M (1991) Effects of feedback of information on clinical practice: a review. Bmj 303: 398–402.
6. Stone EG, Morton SC, Hulscher ME, Maglione MA, Roth EA, et al. (2002) Interventions that increase use of adult immunization and cancer screening services: a meta-analysis. Ann Intern Med 136: 641–651.
7. van der Veer SN, de Keizer NF, Ravelli AC, Tenkink S, Jager KJ (2010) Improving quality of care. A systematic review on how medical registries provide information feedback to health care providers. Int J Med Inform 79: 305–323. 8. Ivers N, Jamtvedt G, Flottorp S, Young JM, Odgaard-Jensen J, et al. (2012) Audit and feedback: effects on professional practice and healthcare outcomes. Cochrane Database Syst Rev 6: Cd000259.
9. Lopez-Campos JL, Ruiz-Ramos M, Soriano JB (2014) Mortality trends in chronic obstructive pulmonary disease in Europe, 1994–2010: a joinpoint regression analysis. Lancet Respir Med 2: 54–62.
10. Miravitlles M, Ferrer M, Pont A, Zalacain R, Alvarez-Sala JL, et al. (2004) Effect of exacerbations on quality of life in patients with chronic obstructive pulmonary disease: a 2 year follow up study. Thorax 59: 387–395.
11. Soler-Cataluna JJ, Martinez-Garcia MA, Roman Sanchez P, Salcedo E, Navarro M, et al. (2005) Severe acute exacerbations and mortality in patients with chronic obstructive pulmonary disease. Thorax 60: 925–931.
12. Dalal AA, Shah M, D’Souza AO, Rane P (2011) Costs of COPD exacerbations in the emergency department and inpatient setting. Respir Med 105: 454–460. 13. Pozo-Rodriguez F, Alvarez CJ, Castro-Acosta A, Melero Moreno C, Capelastegui A, et al. (2010) [Clinical audit of patients admitted to hospital in Spain due to exacerbation of COPD (AUDIPOC study): method and organisation]. Arch Bronconeumol 46: 349–357.
14. Lopez-Campos JL, Hartl S, Pozo-Rodriguez F, Roberts CM, European CAt (2013) European COPD Audit: design, organisation of work and methodology. Eur Respir J 41: 270–276.
15. Soler-Cataluna JJ, Calle M, Cosio BG, Marin JM, Monso E, et al. (2009) [Health-care quality standards in chronic obstructive pulmonary disease]. Arch Bronconeumol 45: 196–203.
16. Pozo-Rodriguez F, Lopez-Campos JL, Alvarez-Martinez CJ, Castro-Acosta A, Aguero R, et al. (2012) Clinical audit of COPD patients requiring hospital admissions in Spain: AUDIPOC study. PLoS One 7: e42156.
17. Lilford RJ, Brown CA, Nicholl J (2007) Use of process measures to monitor the quality of clinical practice. Bmj 335: 648–650.
18. Miravitlles M, Soler-Cataluna JJ, Calle M, Molina J, Almagro P, et al. (2014) Spanish guideline for COPD (GesEPOC). Update 2014. Arch Bronconeumol 50 Suppl 1: 1–16.
19. Miravitlles M, Soriano JB, Garcia-Rio F, Munoz L, Duran-Tauleria E, et al. (2009) Prevalence of COPD in Spain: impact of undiagnosed COPD on quality of life and daily life activities. Thorax 64: 863–868.
20. Lopez-Campos JL, Soriano JB, Calle M, Encuesta de Espirometria en Espana P (2013) A comprehensive, national survey of spirometry in Spain: current bottlenecks and future directions in primary and secondary care. Chest 144: 601–609.
21. Lopez-Campos JL, Calero C, Lopez-Ramirez C. Exacerbations or complica-tions? Redefining the concepts in COPD. Int J Clin Pract 2014 (in press). 22. Tsai CL, Ginde AA, Blanc PG, Camargo CA (2009) Improved care of acute
exacerbation of chronic obstructive pulmonary disease in two academic emergency departments. Int J Emerg Med 2: 111–116.
23. Roberts CM, Lopez-Campos JL, Pozo-Rodriguez F, Hartl S, European CAt (2013) European hospital adherence to GOLD recommendations for chronic obstructive pulmonary disease (COPD) exacerbation admissions. Thorax 68: 1169–1171.
24. Ivers NM, Grimshaw JM, Jamtvedt G, Flottorp S, O’Brien MA, et al. (2014) Growing Literature, Stagnant Science? Systematic Review, Meta-Regression and Cumulative Analysis of Audit and Feedback Interventions in Health Care. J Gen Intern Med.
25. Kiefe CI, Allison JJ, Williams OD, Person SD, Weaver MT, et al. (2001) Improving quality improvement using achievable benchmarks for physician feedback: a randomized controlled trial. Jama 285: 2871–2879.
26. Sondergaard J, Andersen M, Stovring H, Kragstrup J (2003) Mailed prescriber feedback in addition to a clinical guideline has no impact: a randomised, controlled trial. Scand J Prim Health Care 21: 47–51.
27. Hopkinson NS, Englebretsen C, Cooley N, Kennie K, Lim M, et al. (2012) Designing and implementing a COPD discharge care bundle. Thorax 67: 90– 92.