Deletion of miR-150 Exacerbates Retinal
Vascular Overgrowth in High-Fat-Diet
Induced Diabetic Mice
Liheng Shi1, Andy Jeesu Kim1, Richard Cheng-An Chang2, Janet Ya-An Chang1, Wei Ying2, Michael L. Ko1, Beiyan Zhou2,3, Gladys Yi-Ping Ko1,4*
1Department of Veterinary Integrative Biosciences, College of Veterinary Medicine and Biomedical Sciences, Texas A&M University, College Station, Texas, United States of America,2Department of Veterinary Physiology and Pharmacology, College of Veterinary Medicine and Biomedical Sciences, Texas A&M University, College Station, Texas, United States of America,3Department of Immunology, University of Connecticut Health Center School of Medicine, Farmington, Connecticut, United States of America,
4Texas A&M Institute of Neuroscience, Texas A&M University, College Station, Texas 77843–4458, United States of America
Abstract
Diabetic retinopathy (DR) is the leading cause of blindness among American adults above 40 years old. The vascular complication in DR is a major cause of visual impairment, making find-ing therapeutic targets to block pathological angiogenesis a primary goal for developfind-ing DR treatments. MicroRNAs (miRs) have been proposed as diagnostic biomarkers and potential therapeutic targets for various ocular diseases including DR. In diabetic animals, the expres-sion levels of several miRs, including miR-150, are altered. The expresexpres-sion of miR-150 is signif-icantly suppressed in pathological neovascularization in mice with hyperoxia-induced
retinopathy. The purpose of this study was to investigate the functional role of miR-150 in the development of retinal microvasculature complications in high-fat-diet (HFD) induced type 2 diabetic mice. Wild type (WT) and miR-150 null mutant (miR-150-/-) male mice were given a HFD (59% fat calories) or normal chow diet. Chronic HFD caused a decrease of serum miR-150 in WT mice. Mice on HFD for 7 months (both WT and miR-miR-150-/-) had significant decreases in retinal light responses measured by electroretinograms (ERGs). The retinal neovasculariza-tion in miR-150-/--HFD mice was significantly higher compared to their age matched WT-HFD mice, which indicates that miR-150 null mutation exacerbates chronic HFD-induced neovascu-larization in the retina. Overexpression of miR-150 in cultured endothelial cells caused a signifi-cant reduction of vascular endothelial growth factor receptor 2 (VEGFR2) protein levels. Hence, deletion of miR-150 significantly increased the retinal pathological angiogenesis in HFD induced type 2 diabetic mice, which was in part through VEGFR2.
Introduction
Obesity associated type 2 diabetes has reached epidemic proportions in the past few decades (http://win.niddk.nih.gov/statistics/index.htm; provided in the public domain by the National Institute of Diabetes and Digestive and Kidney Diseases). Fluctuations in systemic glucose
a11111
OPEN ACCESS
Citation:Shi L, Kim AJ, Chang RC-A, Chang JY-A, Ying W, Ko ML, et al. (2016) Deletion of miR-150 Exacerbates Retinal Vascular Overgrowth in High-Fat-Diet Induced Diabetic Mice. PLoS ONE 11(6): e0157543. doi:10.1371/journal.pone.0157543
Editor:Masuko Ushio-Fukai, University of Illinois at Chicago, UNITED STATES
Received:February 18, 2016
Accepted:June 1, 2016
Published:June 15, 2016
Copyright:© 2016 Shi et al. This is an open access article distributed under the terms of theCreative Commons Attribution License, which permits unrestricted use, distribution, and reproduction in any medium, provided the original author and source are credited.
Data Availability Statement:All relevant data are within the paper. The numerous data are in the "Tables" of the text file.
levels lead to serious complications such as diabetic retinopathy (DR), diabetic nephropathy, and diabetic neuropathy [1–3]. In diabetic retinopathy, microvascular complications often lead to leakage of blood into the eyes and ultimately cause retinal degeneration and distorted vision. Besides controlling systemic glycemic levels, intra-ocular anti-vascular endothelial growth fac-tor (VEGF) injections are now the first-line gold standard treatment for DR macular edema and vascular complications [4,5]. While 70% of DR patients respond well to the current anti-VEGF therapies, about 30% are unresponsive [6–13], and often these non-responders are iden-tified months after the treatments have started. In addition, side-effects such as sustained eleva-tion of intra-ocular pressure, retinal detachments and tears, and ocular hemorrhage [14,15] become greater risks of blindness and can outweigh the benefits of anti-VEGF treatments. Hence, identifying the mechanistic development and discovering new strategies for treatment of DR are critical needs.
MicroRNAs are short non-coding RNAs that form complexes with RNA binding proteins to suppress the expression of targeted genes via post-transcriptional mechanisms [16]. Micro-RNAs exhibit specific temporal and spatial expression following environmental stimulation [17], and they repress gene expression through complementary binding to the 3'UTR region of mRNAs. Because the expression of miRNAs can be cell or tissue specific, miRNAs have been used as diagnostic biomarkers or potential therapeutic targets [18–20]. In the retina, a single point mutation of miR-204 causes inherited retinal dystrophy [21]. In streptozotocin-induced diabetic rats, the expression levels of 86 miRNAs are altered in the retina, implying that these miRNAs might be involved in the pathogenesis of DR, and they could also serve as novel thera-peutic targets for DR treatment [22–26].
Among these miRNAs that are altered in the diabetic retina, miR-150 is highly expressed in retinal vascular endothelial cells [27]. MiR-150 was first known as a circulating miRNA that is secreted into macrovesicles by blood cells and monocytic cells [28–30]. It regulates the develop-ment of B cells and production of hematopoietic progenitor cells [28–30]. MiR-150 expression or secretion is up-regulated by oxidative stress and down-regulated in hypoxic conditions [31,32] suggesting that it could be a biomarker coordinating cell to cell communication in the vascular system. The expression of miR-150 is significantly suppressed in pathological neovas-cularization in mice with hyperoxia-induced proliferative retinopathy [33]. This observation suggests that miR-150 is involved in neovascular complications in ocular diseases. Hence, we postulate that miR-150 might contribute to the pathogenesis of DR vascular complications.
We previously showed that obesity-induced early diabetes has a detrimental impact on reti-nal light sensitivity and health [34]. Mice under chronic high-fat-diet (HFD) not only become obese, they also develop a stable hyperglycemia with a progressively increased hyperinsuline-mia over time, indicating the progressive worsening of insulin resistance [35]. These obese mice frequently develop chronic inflammation within adipose tissues [36–38], which is a sig-nificant factor contributing to systemic insulin resistance [38–42] and hyperglycemia [35], two hallmarks of type 2 diabetes. Unlike other diabetic mouse models derived from monogenic dis-orders or chemical destruction ofβ-cells, the HFD-induced diabetic mouse model is widely used in studies on pathophysiology of obesity and type 2 diabetes, such as mechanisms of impaired glucose tolerance and insulin resistance, as well as other diabetic complications [35,43], and it is more clinically relevant to obesity-associated type 2 diabetes in humans [35,43]. These HFD-induced diabetic mice also have structural and functional deficits in the retina similar to certain characteristics found in other DR animal models, including defects in the inner retinal light responses, lesions in the retinal vasculature, and thickness of Bruch's membrane [44]. Furthermore, mice fed with a HFD containing 42% fat calories for 12 months have significantly greater numbers of atrophic capillaries and pericyte ghosts compared to mice fed with a normal diet [45]. Because HFD-induced DR in mice is characterized by its
slow-onset that mirrors the pathophysiology of human type 2 diabetes-associated DR, the HFD-induced DR mouse model is a suitable model for type 2 diabetes-associated non-prolifer-ative DR in humans [45].
As shown in our previous study, mice under a HFD (59% fat calories) for 3 months not only become obese with insulin resistance and systemic hyperglycemia, their retinal light sensitivi-ties decrease [34]. In this report, we extended our study and examined HFD-induced DR in mice after they were fed with a HFD for 7 months. We further examined the HFD-induced DR in miR-150 null mutant (miR-150-/-) mice and determined the functional role of miR-150 in neovascularization under diabetic conditions, as well as the downstream target(s) of miR-150 by using ERG recordings for retinal light responses, morphological staining for retinal vascula-ture, and other biochemical / molecular assays.
Materials and Methods
Animals
The C57BL/6J mouse strain was used in this study for its robust development of severe obesity, hyperglycemia, and hyperinsulinemia under the HFD regimen compared to other mouse strains [46]. Male C57BL/6J mice (wild type; WT) were purchased from Harlan (Houston, TX, USA). B6(C).MiR-150tm1Rsky/J (miR-150-/-) mice were originally purchased from the Jack-son Laboratory (Bar Harbor, ME, USA). All animal experiments were approved by the Institu-tional Animal Care and Use Committee of Texas A&M University. Mice were housed under temperature and humidity-controlled conditions with 12:12 hour light–dark cycles. All mice were fed with laboratory chow and waterad libitum. Starting at 5 weeks of age, mice were fed either a HFD (59.4% fat calories, 18.1% protein calories, and 22.5% carbohydrates calories; TestDiet1, St. Louis, MO, USA) or normal standard laboratory chow (controls; 10% fat calo-ries, 20% protein calocalo-ries, and 70% carbohydrates calories; Research Diets, Inc., New Bruns-wick, NJ, USA) for 27 weeks. Their body weight and food intake were monitored throughout. Blood was taken from the tail vein and glucose levels measured by the Clarity Plus Blood Glu-cose Monitoring System (Diagnostic Test Group, Boca Raton, FL, USA).
Electroretinogram (ERG)
Mice were dark adapted for a minimum of 6 hours and anesthetized with an intraperitoneal injection of Avertin (2% 2,2,2-tribromoethanol, 1.25% tert-amyl alcohol; Thermo Fisher Scien-tific, Grand Island, NY, USA) solution (12.5 mg/ml) at a dosage of 500μl per 25 g bodyweight.
time of a- and b-waves and oscillatory potentials (OPs) were recorded and analyzed by using the ERGView 4.4 software (OcuScience).
Cell Culture and Western Immunoblot Analysis
Human umbilical vein endothelial cells (HUVECs, Cell Applications, San Diego, CA, USA) were seeded onto 24-well plates in endothelial cell growth medium (Cell Applications) and allowed to adhere overnight. The cells were transfected with a miR-150 expression vector (Gen-eCopoeia, Rockville, MD, USA) using anin vitrotransfection kit (Signagen Lab, Rockville, MD, USA) and harvested 60 hours later. Human retinal endothelial cells (HRECs; Cell Sys-tems, Kirkland, WA, USA) were maintained in EGM™-2MV BulletKit™culture medium (Lonza, Allendale, NJ, USA). The cells were transfected with a miR-150 expression vector (GeneCopoeia) using the Lipofectamine LTX & PLUS reagent (Thermo Fisher Scientific) and harvested 60 hours after transfection. The cells were homogenized in RIPA buffer supple-mented with a protease inhibitor mixture containing 1mM NaF and 1mM NaVO3. The cell
lysates were centrifuged, and the supernatants were denatured with 2X SDS sample buffer. Samples were separated on 10% sodium dodecyl sulfate–polyacrylamide gels by electrophoresis and transferred to nitrocellulose membranes. The primary antibodies used in this study were anti-VEGFR2 (Cell Signaling Technology, Denver, MA, USA), anti-pan actin (Cell Signaling Technology), and anti-GAPDH (Cell Signaling Technology). Blots were visualized by using appropriate secondary antibodies conjugated to horseradish peroxidase (Cell Signaling Tech-nology) and an enhanced chemiluminescence detection system (Thermo Fisher Scientific). Rel-ative protein expressions for all proteins involved in this study were reported as a ratio to pan-actin. Band intensities were quantified by densitometry using Scion Image (National Institutes of Health, Bethesda, MD, USA). Each experiment was repeated four times (n = 4).
Trypsin Digestion of Mouse Retinas and Hematoxylin and Eosin (H&E)
Staining
Mice were deeply anesthetized by isoflurane and quickly decapitated to minimize pain and dis-tress. Mouse eyes were excised and fixed with Zamboni's fixative (American Matertech Scien-tific Inc, Lodi, CA) for 2 hours at 4°C. The retinas were isolated and washed with distilled water overnight at room temperature. Trypsin digestion was performed to isolate the retinal vasculature according to a previous description [47]. Briefly, the retinas were incubated with 3% trypsin (BD Biosciences, Franklin Lakes, NJ, USA) for 1–1.5 h at 37°C, followed by gentle washing with distilled water until tissue debris no longer fell off the retinas. The remaining reti-nal tissues containing retireti-nal blood vessels were carefully transferred to a glass-slide and flat-tened. The retinal vasculature was stained with heamatoxylin and eosin (H&E) using a staining kit (VitroView H&E Stain Kit, GeneCopoeia) or immunostained with the VEGFR2 anti-body conjugated with Alexa-488 (Cell Signaling) at 1:100 dilution.
Immunofluorescent Staining and Quantification of Retinal Vasculature
the Image Composite Editor (Microsoft, Seattle, WA, USA). The vascular area (percentage, %) was quantified using Image J software (NIH, Bethesda, MD, USA) by the following procedure: in a selected retinal region, the total pixel-number of the selected area was first measured. Within the selected retinal region, the pixel-number of any green fluorescence-positive area was measured. The vascular area (%) was calculated by dividing the pixel-number of the fluo-rescence-positive area by the total pixel-number of the selected retinal region. There were 4 peripheral and 4 central areas from each whole retina randomly selected, analyzed, and aver-aged. The density of microaneurysm-like structures and the capillary vessel bifurcation joints (both together referred to as“microaneurysms”) were counted from 4 peripheral regions of each retina using the fluorescent images captured under 10X magnification. The number of microaneurysms was counted by Image J software. The microaneurysm particles (larger than 9 square pixels with circularity between 0.00–1.00) were highlighted and counted by adjusting the threshold. Each experimental group had retinas from 6–8 mice (n = 6–8).
Quantitative Real Time PCR (Q-PCR)
Blood was collected from the mouse ocular vein and kept at room temperature for 30 minutes followed by centrifugation at 2000 g for 10 minutes at 4°C. 400–500μl serum was transferred to a
new tube and used for the purification of miRNAs (Direct-zol™RNA Kit; Zymo Research, Irvine, CA, USA). Real time PCR reactions were performed by TaqMan miRNA assay kits (Thermo Fisher Scientific). Specific primers and probes for mmu-miR-150-5p (5’UCUCCCAACCCUU GUACCAGUG 3’) were purchased from Life Technologies/Thermo Fisher. Taqman Q-PCR master mix (Thermo Fisher Scientific) was used for PCR amplification (40 cycles). All experi-ments were repeated five times (n = 5). A standard curve was generated with known quantities of miRNA (1 ×, 2 ×, 4 ×, 5 ×, 8 ×, and 10 × dilutions). The cycle values corresponding to the log val-ues of the standard curve were used to generate an equation for linear regression. The cycle valval-ues from the sample miRNAs were fit into the equation to quantify miRNA levels. Cel-miR-39 (Life Technologies/Thermo Fisher) was used as the spike-in control.
Statistics
All data are presented as mean ± standard error of the mean (SEM). Student’st-test and one- or two-way ANOVA followed by Tukey'spost hoctest for unbalanced n were used for statistical anal-yses. Specifically for the animal studies, the 2-way ANOVA followed by Tukey'spost hoctest for unbalanced n were used to determine the statistical significance among all 4 groups (WT-normal diet, WT-HFD, miR-150-/--normal diet, and miR-150-/--HFD), as well as whether there was an interaction between the two factors: HFD regimen and miR-150 null mutation (miR-150-/-). A statistical significance in the interaction between HFD and miR-150-/-would indicate that miR-150-/-exacerbated the HFD-caused effects. Throughout,p<0.05 was regarded as significant.
Results
Compared to the WT, deletion of miR-150 did not alter the systemic body
weight and blood glucose level in HFD-induced obese mice
conditions. By the end of the HFD regimen, both WT and miR-150-/-HFD mice had twice the body weights of mice fed with a normal chow diet (WT: HFD vs normal chow, 51.8 ± 2.0 g vs 25.5 ± 2.7 g; miR-150-/-: HFD vs normal chow, 45.4 ± 2.2 g vs 28.7 ± 2.0 g;Fig 1A). There was no statistically significant difference in the interaction between miR-150 deletion and HFD reg-imen in regards to body weight, as the body weights between WT and miR-150-/-mice in the same diet were similar (2-way ANOVA analysis). Both WT and miR-150-/-HFD mice dis-played significantly higher blood glucose levels in a non-fasted state compared to mice fed with normal chow, but there was no statistically significant difference in the interaction between miR-150 null mutation and HFD regimen in systemic glycemia, which indicated that hypergly-cemia was mainly induced by chronic HFD (2-way ANOVA analysis; WT-normal diet: 114.8 ± 16.5 mg/dl; WT-HFD: 267.8 ± 37.5 mg/dl; miR-150-/--normal diet: 122.4 ± 12.9 mg/dl; miR-150-/--HFD: 298.2 ± 23.6 mg/dl;Fig 1B). Since miR-150 is largely present in the blood after it is expressed and secreted from the spleen, mesenteric lymph nodes, and the thymus [30], we next determined whether the serum level of miR-150 was altered by HFD. The serum level of miR-150 was significantly suppressed in HFD mice compared to mice fed with a nor-mal diet (student’st-test; the relative abundance of miR-150/ miR-39 for Normal is
0.02819 ± 0.00199, and for HFD is 0.02032 ± 0.00194. n = 5 for each group.Fig 1C). Therefore, miR-150 levels were influenced by diet, which could play a crucial role in the pathogenesis of DR.
The retinal light responses were decreased in miR-150
-/-HFD mice
miR-150-/-groups). MiR-150 deletion did not have any impact on ERG b-wave amplitudes, suggesting that miR-150 deletion did not affect inner retinal physiology. In addition, there was no statistically significant difference in the interaction between the two factors, miR-150 null mutation and HFD regimen (2-way ANOVA). The implicit time of a- and b-waves under sco-topic and phosco-topic conditions showed similar statistical comparisons among all four groups (data not shown).
The amplitudes of OPs (the summation of OP1, OP2, OP3, and OP4;ƩOP1-4) were signifi-cantly decreased in HFD-mice (both WT and miR-150-/-) compared to the mice fed with nor-mal chow (Fig 2E and 2F, Tables1and2). However, because the photopic OP amplitudes were too small to be analyzed at lower light intensities, we were only able to obtain photopic OPs from 3, 10, and 25 cd.s/m2, while we were able to analyze scotopic OPs from all light intensities tested in this study (from 0.1 to 25 cd.s/m2). Deletion of miR-150 itself did not affect OPs. There was no statistically significant difference in the interaction between the two factors, miR-150 null mutation and HFD regimen (2-way ANOVA). These results indicated that HFD had a detrimental impact on the inner retina, and deletion of miR-150 did not further aggravate the decreased retinal light responses in HFD-induced diabetic mice.
Deletion of miR-150 exacerbates HFD-induced DR microvascular
complications
Even though miR-150 mutation did not exacerbate HFD-induced decreases of retinal light responses, we further examined whether deletion of miR-150 affected neo-microvasculature by fluorescent staining of retinal blood vessels. Mice fed with HFD for 27 weeks had a significant increase in retinal vascular densities measured in central and peripheral retinas (Fig 3A and 3B). To better observe the changes in retinal vasculature, we performed trypsin-digestion on mouse retinas to isolate the retinal vasculature. The retinal neurons and other nonvascular cells were washed out after trypsin digestion, and the retinal vasculature was visualized by H&E staining. Retinal capillary vasculature is composed of retinal endothelial cells and pericytes. The endothelial cells have an elongated shape (Fig 3A) and form the tube of capillaries, while pericytes with a rounded shape (white arrowheads,Fig 3A) wrap around the endothelial cells and sustain the blood–retina barrier. We observed several defects of retinal vasculature from the mice fed with HFD (Fig 3A), including the loss of pericytes and the formation of acellular capillaries (red arrowheads), both of which occur in early human DR. Thus, mice under HFD for 27 weeks had developed DR.
Deletion of miR-150 itself did not seem to cause any vascular abnormality in the mouse retina, but miR-150-/-mice fed with HFD had significantly increased vasculature networks (Fig 3A). In addition to the pericyte loss and the formation of acellular capillaries, we also identified microa-neurysm-like structures (endothelial cell-extrusion from existing capillaries) in the HFD-mouse retinal vasculature. As these microaneurysm-like structures (white circles;Fig 3A) were smaller compared to human DR microaneurysms, it is possible that these structures could be newly formed branch points (bifurcations), or they could develop into larger structures that resemble
Fig 1. Systemic status of WT and miR-150 null mutant (miR-150-/-) mice with normal chow diet or HFD.
Wild type (WT) and miR-150-/-mice were fed with a normal chow diet (Normal) or HFD for 27 weeks. (A) The
body weights and (B) blood glucose levels measured at the end of 27 weeks are presented. (A and B) There is a statistically significant difference between the HFD and Normal groups, but there is no statistical difference between WT-HFD and miR-150-/--HFD. There is no statistical interaction between miR-150 null
mutation and HFD regimen (2-way ANOVA). n = 5 for each group. (C) Wild type mice fed with HFD have a significant decrease of miR-150 expression compared to mice fed with normal diet (Normal; student’st-test). *p<0.05. miR-39 was used as the internal spike-control. The relative abundance of miR-150 / miR-39 for Normal is 0.02819±0.00199, and for HFD is 0.02032±0.00194. n = 5 for each group.
the human DR microaneurysms in a later stage of DR. However, we observed these bifurcations and microaneurysm-like structures (“microaneurysms”) mostly in HFD mouse retinal vascula-ture but rarely in mice fed with normal chow, and the density of these microaneurysms was sig-nificantly higher in HFD-mice compared to mice fed with normal chow (Fig 3C). Moreover, there was a statistically significant difference in the interaction between miR-150 mutation and HFD regimen in vascular area and microaneurysms (#p<0.05; 2-way ANOVA;Fig 3B and 3C)
indicating that miR-150-/-mice are more sensitive to HFD-induced diabetic insults during the development of DR vascular complications compared to the WT. Thus, deletion of miR-150 accelerated the pathological neovascularization in HFD-induced diabetic retina.
Vascular endothelial growth factor receptor 2 (VEGFR2) is a
downstream target of miR-150
Angiogenic factors including VEGF, fibroblast growth factor (FGF), platelet-derived growth factor (PDGF), and angiopoietins promote endothelial cell proliferation and vascular tube for-mation through their respective receptors [51]. Vascular endothelial growth factor receptor 2 (VEGFR2) is one of the principal receptors of VEGF, which mediates VEGF centric signaling [51]. Upregulation of VEGF has been observed in hypoxia-induced retinopathy, diabetic reti-nopathy, and age-dependent macular degeneration [52]. Since deletion of miR-150 increased microvascular density and angiogenesis in mouse retina under diabetic conditions, we sus-pected that miR-150 might regulate VEGF signaling. To determine whether miR-150 was able to regulate the VEGFR2 level in endothelial cells, we transfected human umbilical vein endo-thelial cells (HUVECs) with a miR-150 expression vector and detected the protein levels of VEGFR2. Myeloblastosis (c-Myb) is one of the known targets of miR-150 [10,53–55] and as such was used as a positive control. Overexpression of miR-150 (hsa-miR-150) in HUVECs caused a decrease of VEGFR2 (0.55 ± 0.03 fold) and c-Myb (0.46 ± 0.04 fold) compared to the control transfected with a scramble microRNA (Scramble, 1.00 ± 0.09 fold;Fig 4A). A similar result was observed in the transfected human retinal microvascular endothelial cells (HRECs). Overexpression of miR-150 in HRECs inhibited VEGFR2 level (0.51 ± 0.10 fold) compared to
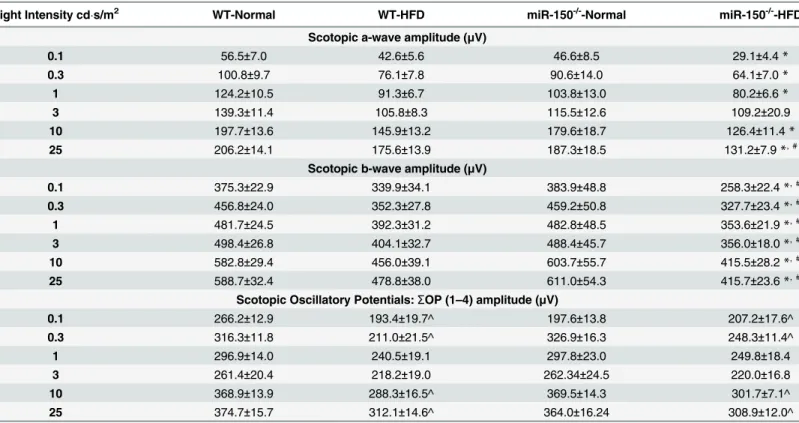
Fig 2. Scotopic and photopic light responses are decreased in WT and miR-150-/-mice fed with HFD.All mice were dark
adapted for at least 6 hours before ERG recordings. (A) The average scotopic ERG a-wave amplitudes recorded from miR-150
-/-with HFD (miR-150-/--HFD) are significantly lower compared to the WT fed with normal chow diet (WT-Normal;
*) or miR-150-/-fed
with normal chow diet (miR-150-/--Normal; #). There is no statistical difference between WT fed with HFD (WT-HFD) and miR-150-/-
-HFD. HFD-mice (both WT and miR-150-/-groups) had significantly smaller (v) a-wave amplitudes compared to mice fed with a
normal chow (both WT and miR-150-/-groups). The miR-150-/-mice (both normal chow and HFD groups) had significantly smaller
(w) a-wave amplitudes compared to the WT mice (both normal chow and HFD groups). (B) The averaged photopic ERG a-wave amplitudes recorded from WT-HFD are significantly lower than WT-Normal (*) at 3 and 10 cd.s/m2light intensities. The photopic a-wave amplitudes recorded from miR-150-/--HFD are significantly lower than WT-normal (#) at 3, 10, and 25 cd.s/m2light intensities.
HFD-mice (both WT and miR-150-/-groups) had significantly smaller (v) amplitudes compared to mice fed with a normal chow (both
WT and miR-150-/-groups). (C) The average scotopic ERG b-wave amplitudes recorded from miR-150-/--HFD are significantly lower compared to WT-Normal (*) or miR-150-/--Normal (#). There is no statistical difference between WT-HFD and miR-150-/--HFD.
HFD-mice (both WT and miR-150-/-groups) had significantly smaller (v) a-wave amplitudes compared to mice fed with a normal chow
(both WT and miR-150-/-groups). The miR-150-/- mice (both normal chow and HFD groups) had significantly smaller (w) a-wave
amplitudes compared to the WT mice (both normal chow and HFD groups). (D) The averaged ERG photopic b-wave amplitudes recorded from WT-HFD are significantly lower than WT-Normal (*) and miR-150-/--Normal (#) at 1 and 10 cd.s/m2light intensities.
The photopic b-wave amplitudes recorded from miR-150-/--HFD are significantly different from the other 3 groups (&) at 25 cd.s/m2
light intensities. HFD-mice (both WT and miR-150-/-groups) had significantly smaller (v) amplitudes compared to mice fed with a
normal chow (both WT and miR-150-/-groups). (E) The averaged scotopic oscillatory potential amplitudes [as a summation from
OP1 to OP4;Ʃ(OP1-4)] recorded from HFD-mice (both WT-HFD and miR-150-/--HFD) are significantly lower (*) than mice fed with a normal chow (both WT-Normal and miR-150-/--Normal) at 0.1, 0.3, 10, and 25 cd.s/m2light intensities. (F) The averaged photopic
oscillatory potential amplitudes [Ʃ(OP1-4)] recorded from HFD-mice (both WT-HFD and miR-150-/--HFD) are significantly lower (
*) than mice fed with a normal chow (both WT-Normal and miR-150-/--Normal) at 25 cd.s/m2light intensities. (A-F) Overall, there is no statistical significance of interaction between two factors: miR-150 null mutation and HFD regimen (2-way ANOVA).p<0.05 (denoted as*, #, &, v, w). Data of scotopic and photopic ERG a- and b-waves and OPs are listed in Tables1and2.
the control scramble (1.00 ± 0.21 fold;Fig 4B). In addition, we found that the VEGFR2 level in the miR-150-/-mouse retinas was higher than the age matched WT mouse retinas (under both normal chow and HFD;Fig 4C). The presence of VEGFR2 in the retinal vasculature obtained from the miR-150-/-under HFD was higher than that of the WT (Fig 4C). Thus, the ability of miR-150 to regulate angiogenesis is in part through VEGFR2.
Discussion
Previously, we observed that obesity-induced type 2 diabetic conditions decrease retinal light sensitivities [34]. Mice fed with a HFD for only 3 months developed chronic insulin-resistance
Table 1. Dark-adapted (scotopic) retinal light responses (Data forFig 2A, 2B and 2E).
Light Intensity cds/m2 WT-Normal WT-HFD miR-150-/--Normal miR-150-/--HFD
Scotopic a-wave amplitude (μV)
0.1 56.5±7.0 42.6±5.6 46.6±8.5 29.1±4.4*
0.3 100.8±9.7 76.1±7.8 90.6±14.0 64.1±7.0*
1 124.2±10.5 91.3±6.7 103.8±13.0 80.2±6.6*
3 139.3±11.4 105.8±8.3 115.5±12.6 109.2±20.9
10 197.7±13.6 145.9±13.2 179.6±18.7 126.4±11.4*
25 206.2±14.1 175.6±13.9 187.3±18.5 131.2±7.9*, #
Scotopic b-wave amplitude (μV)
0.1 375.3±22.9 339.9±34.1 383.9±48.8 258.3±22.4*, #
0.3 456.8±24.0 352.3±27.8 459.2±50.8 327.7±23.4*, #
1 481.7±24.5 392.3±31.2 482.8±48.5 353.6±21.9*, #
3 498.4±26.8 404.1±32.7 488.4±45.7 356.0±18.0*, #
10 582.8±29.4 456.0±39.1 603.7±55.7 415.5±28.2*, #
25 588.7±32.4 478.8±38.0 611.0±54.3 415.7±23.6*, #
Scotopic Oscillatory Potentials:ƩOP (1–4) amplitude (μV)
0.1 266.2±12.9 193.4±19.7^ 197.6±13.8 207.2±17.6^
0.3 316.3±11.8 211.0±21.5^ 326.9±16.3 248.3±11.4^
1 296.9±14.0 240.5±19.1 297.8±23.0 249.8±18.4
3 261.4±20.4 218.2±19.0 262.34±24.5 220.0±16.8
10 368.9±13.9 288.3±16.5^ 369.5±14.3 301.7±7.1^
25 374.7±15.7 312.1±14.6^ 364.0±16.24 308.9±12.0^
Scotopic ERG a-wave:
*denotes miR-150-/—HFD significantly different from WT-Normal. # denotes miR-150-/—HFD significantly different from miR-150-/—Normal.
There is a significant difference between mice with normal chow (both WT and miR-150-/-) and HFD-mice (both WT and miR-150-/-), indicating the impact of HFD on the scotopic ERG a-wave.
There is a significant difference between WT (both normal chow and HFD) and miR-150-/-, indicating the impact of miR-150 null mutation on the scotopic ERG a-wave.
Scotopic ERG b-wave: *denotes miR-150-/--HFD signi
ficantly different from WT-Normal.
#denotes miR-150
-/--HFD significantly different from miR-150-/--Normal.
There is a significant difference between mice with normal chow (both WT and miR-150-/-) and HFD-mice (both WT and miR-150-/-), indicating the impact of HFD on the scotopic ERG b-wave.
Scotopic ERG Oscillatory Potentials:
^ denotes both WT-HFD and miR-150-/—HFD significantly different from both WT-Normal and miR-150-/—Normal, indicating the impact of HFD on scotopic ERG OPs.
and glucose intolerance with significantly increased adiposity, which are signs of type 2 diabe-tes [34]. In this study, we found that the serum miR-150 level was significantly suppressed in WT HFD-induced type 2 diabetic mice (Fig 1). By using the miR-150 null (miR-150-/-) mouse model, we were able to reveal how miR-150 contributed to the pathogenesis of DR vascular complications in HFD-induced type 2 diabetes. Deletion of miR-150 in mice mildly affected photoreceptor light sensitivities (as shown by ERG a-waves), but it did not have any significant impact on the inner retinal light sensitivities (shown in ERG b-waves and OPs) or general reti-nal vasculature. However, under HFD-induced diabetic conditions, miR-150-/-mice had a sig-nificant increase in retinal vasculature and microaneurysms compared to the WT-HFD mice (Fig 3), even though retinal light responses were similar. Thus, deletion of miR-150 does not further exacerbate the neural retina as much as ocular vasculature under diabetic insults. This observation might be due to the fact that normally the neural retina has very low expression of miR-150 compared to the hematologic and endothelial cells in the blood vessels [27,31], so
Table 2. Light-adapted (photopic) retinal light responses (Data forFig 2C, 2D and 2F).
Light Intensity cds/m2 WT-Normal WT-HFD miR-150-/--Normal miR-150-/--HFD
Photopic a-wave amplitude (μV)
0.3 5.1±0.6 4.3±0.6 2.9±0.6 4.0±0.8
1 6.7±1.1 5.6±0.7 5.7±0.3 4.6±0.4
3 12.4±1.7 7.3±0.9* 8.8±0.8 7.4±0.5#
10 18.6±2.1 11.6±1.1* 14.0±1.4 12.2±0.8#
25 26.7±2.9 21.6±2.3 21.8±1.3 14.8±1.2#
Photopic b-wave amplitude (μV)
0.3 20.4±1.6 13.3±2.3 13.6±1.7 15.9±2.0
1 37.6±3.2 21.8±2.9*, # 40.2±4.6 29.4±2.1
3 63.2±4.6 33.8±4.8 66.5±6.7 46.7±3.4&
10 97.8±8.9 62.3±8.6*, # 101.2±10.5 72.9±5.0
25 141.5±12.0 84.6±13.0 140.0±12.7 100.6±5.8&
Photopic Oscillatory Potentials:ƩOP (1–4) amplitude (μV)
3 6.63±0.69 6.03±0.37 7.40±0.86 5.44±0.87
10 11.3±1.4 9.92±0.47 11.7±1.2 8.81±0.90
25 18.8±1.8 15.1±0.9^ 19.4±1.8 14.0±1.2^
Photopic ERG a-wave:
*denotes WT-HFD significantly different from WT-Normal. # denotes miR-150-/—HFD significantly different from WT-Normal.
There is a significant difference between mice with normal chow (both WT and miR-150-/-) and HFD-mice (both WT and miR-150-/-), indicating the impact of HFD on the photopic ERG a-wave.
There is a significant difference between WT (both normal chow and HFD) and miR-150-/-, indicating the impact of miR-150 null mutation on the photopic ERG a-wave.
Photopic ERG b-wave:
*denotes WT-HFD significantly different from WT-Normal. # denotes WT-HFD significantly different from miR-150-/—Normal. & denotes miR-150-/—HFD significantly different from all other 3 groups.
There is a significant difference between mice with normal chow (both WT and miR-150-/-) and HFD-mice (both WT and miR-150-/-), indicating the impact of HFD on the photopic ERG b-wave.
Photopic ERG Oscillatory Potentials:
^denotes both WT-HFD and miR-150-/--HFD significantly different from both WT-Normal and miR-150-/--Normal, indicating the impact of HFD on photopic
ERG OPs.
under chronic diabetic stress, deletion of miR-150 has a much higher pathological impact on ocular vasculature than neural retina.
In DR, intra-ocular anti-VEGF injections and anti-inflammatory therapies are the standard treatments for DR macular edema and vascular complications [1,4,5]. Several microRNAs including circulating miRNAs have been reported to play a critical role in pathological angio-genesis by targeting angiogenic factors including VEGF, FGF, PDGF, or angiopoietins. For example, under hyperglycemic conditions, miR-93 and miR-200b regulate VEGF levels in the kidney and retina, respectively [56,57]. MiR-126, miR-31, miR-150, and miR-184 are involved in ischemia-induced retinal neovascularization. MiR-126 enhances the action of VEGF and FGF by repressing the expression of Spred-1, an intracellular inhibitor of angiogenic signaling [58]. Downregulation of miR-31, miR-150, and miR-184 in ischemic retina stimulates ocular neovascularization by increasing VEGF and PDGF [32]. Among these miRNAs mentioned above, miR-150 and miR-126 are circulating miRNAs present in the plasma, platelets, erythro-cytes, and nucleated blood cells of blood [59,60]. Our data presented in this report show that miR-150, a circulating miRNA but also expressed in retinal endothelial cells [27], contributes to the pathogenesis of DR vascular complications. Our work broadens the knowledge of circu-lating miRNAs during DR pathogenesis.
In a mouse model of oxygen-induced proliferative retinopathy, miR-150 is a suppressor of pathological ocular neovascularization [33]. However, whether VEGF, the most potent angio-genic factor, is a direct target of miR-150 remains controversial [33,34,61–64]. Our results sug-gest that the suppression of angiogenesis by miR-150 is in part through VEGFR2, a principal receptor of VEGF that mediates specific intracellular signaling cascades leading to prolifera-tion, migraprolifera-tion, survival, and permeability of vascular endothelial cells [65]. One question that remained is whether VEGFR2 is a direct downstream target of miR-150. We performed a miRNA target prediction search using several on-line algorithms including Targetscan (http:// www.targetscan.org), PicTar (http://pictar.mdc-berlin.de), and miRanda (http://www. microrna.org) to determine whether miR150 could target the 3’-untranslated region (UTR) of VEGFR2. However, the gene encodingVEGFR2 (KDR)is not listed as a potential candidate for miR-150 because of a lack of compatible paired sequences. Conversely, the miRNAs predicted to target the 3’-UTR (1479 bp) of mouseVEGFR2gene do not include miR-150. Therefore, we concluded that VEGFR2 is not a direct downstream target of miR-150. The down-regulation of VEGFR2 by miR-150 could be indirect and mediated by other known miR-150 targets, such as c-Myb, Early growth response 2 (Egr2), or Glycoprotein nonmetastatic melanoma protein B (GPNMB) [10,53–55]. Among those candidates targeted directly by miR-150, c-Myb has been verified as a consensus target in several studies [10,29,66]. Our result showed that the c-Myb level was decreased in the endothelial cells transfected with miR-150. C-Myb is a
Fig 3. Deletion of miR-150 exacerbates HFD-induced DR neovascularization and microaneurysms.(A) Upper two rows: the whole mount retinal vasculature was stained with FITC-labeled isolectin-B4. The first row: the fluorescent images from 4 experimental groups were taken at 5X (scale bar = 400μm). The highlighted regions (yellow square) were magnified at 10X and displayed in the second row.
The second row: the fluorescent images from 4 experimental groups were taken at 10X (scale bar = 100μm). Lower two rows: the mouse
retinas were trypsin-digested and the retinal vasculatures were stained with hematoxylin and eosin. The third row: the whole retinal vasculature images are shown (scale bar = 400μm). The fourth row: magnified images of retinal vasculature (from the third row) are
shown (scale bar = 100μm). White arrowheads indicate the pericytes, the red arrowheads indicate the acellular capillaries, and the white
circles indicate the microaneurysm-like (vascular extrusion) structures. (B) Wild type and miR-150-/-mice fed with HFD have significantly higher (*) vasculature in central and peripheral retinal areas compared to mice fed with normal chow diet (Normal). There is a statistical significant difference in the interaction between miR-150 null mutation and HFD regimen (2-way ANOVA; #). (C) Wild type and miR-150
-/-mice fed with HFD have significantly higher (*) densities of microaneurysm-like structures (microaneurysms per 0.6 mm2retinal area) compared to mice fed with normal chow diet (Normal). There is a statistical significant difference in the interaction between miR-150 null mutation and HFD regimen (2-way ANOVA; #). WT-Normal: n = 6; WT-HFD: n = 8; miR-150-/--Normal: n = 6; miR-150-/--HFD: n = 8.
p<0.05 (denoted as*, #).
transcriptional factor that binds to a 5’-YAACKG-3’sequence in the promoter region and reg-ulates the expression of a group of genes involved in cell lineage and fate- determination in the immune system. The gene encoding VEGFR2 (Vegfr2) has four c-Myb binding sites in its pro-moter region, soVegfr2can be turned on by c-Myb [67]. Over-expression of c-Myb increases the population of hemogenic endothelial cells during embryonic development [68]. Therefore, c-Myb is the most likely downstream target of miR-150 that regulates the VEGFR2 expression in endothelial cells.
However, there are other direct targets of miR-150 that could also contribute to the regula-tion of VEGFR2 expression. Egr2 induces VEGF and VEGFR2 expression in Schwann cells and possibly upregulates expression of both during embryonic development and angiogenesis [69,70]. Therefore, downregulation of Egr2 by miR-150 inhibits VEGFR2 activation. GPNMB is a glycoprotein with the ability to induce endothelial cell migration [71]. MiR-150-/-null neo-nates display an increased capillary network, decreased inflammation, and less alveolar damage after hyperoxia-induced lung injury due to concurrent induction of GPNMB expression [55]. GPNMB increases the expression of neuropilin-1 (NRP-1) that forms a complex with VEGFR2 to enhance tumor cell-intrinsic VEGF signaling and primary breast tumor growth [72]. All of the above support the notion that even though VEGFR2 might not be a direct target of miR-150, deletion of miR-150 enhances angiogenesis under pathological conditions in part through the up-regulation of VEGFR2.
In addition to anti-VEGF therapies, anti-inflammatory treatments have also been used to treat DR [1,4,5]. The miR-150-/-mice display exacerbated obesity-associated tissue inflamma-tion and systemic insulin resistance [73], indicating that miR-150 might be involved in the chronic ocular tissue inflammation that leads to the development of DR. We previously showed that mice fed with a HFD for only 3 months display an increase of inflammation in the retina [34]. Since HFD-induced diabetes exacerbated the DR neovascularization in miR-150-/-mice more than in WT (Fig 3), and overexpression of miR-150 significantly down-regulated VEGFR2 in endothelial cells (Fig 4), we postulate that chronic obesity-induced suppression of miR-150 may lead to the inflammation in ocular tissues and further aggravate the DR neovas-cularization through up-regulating VEGF/VEGFR2. Because the pathogenesis of DR neovascu-larization is complex, and the development of DR vascular complication is chronic, it is our interest to investigate the role of miR-150 in pathological angiogenesis at different stages of DR development. Nonetheless, miR-150 might be a potential new therapeutic target to reduce the retinal vascular complications caused by DR or other retinal degenerative diseases because of its functional association with inflammation and neovascularization.
Acknowledgments
This study was supported by 1-13-JF-59 from the American Diabetes Association and
NIHR01DK098662 from the National Institute of Diabetes and Digestive and Kidney Diseases of the National Institutes of Health (NIH) to B. Zhou, and NIHR01EY017452 and NIH-R21EY023339 from the National Eye Institute of the NIH to G. Ko.
Fig 4. Overexpression of miR-150 decreased VEGFR2 protein level in endothelial cells.The HUVE cells were transfected with miR-150 (has-miR-150) or a scramble microRNA (Scramble) and cultured for an additional 60 hr. The protein levels of c-Myb and VEGFR2 are significantly lower in HUVE cells with overexpression of miR-150 compared to the scramble (student’st-test; *p<0.05). n = 4 for each group. (B) The protein level of VEGFR2 is significantly lower in HRECs transfected with has-miR-150 compared to the ones transfected with scramble (student’s t-test;*p<0.05). n = 4 for each group. (C) The retinas from WT and miR-150-/-mice under normal chow diet (Normal) or HFD were isolated and processed for Western blotting. Some retinas were
trypsin-digested to obtain the retinal vasculature followed by immunostaining with the VEGFR2 antibody conjugated with Alexa-488. The scale bar = 100μm.
Author Contributions
Conceived and designed the experiments: LS GK. Performed the experiments: LS AK RC JC WY MK. Analyzed the data: LS AK RC JC GK. Contributed reagents/materials/analysis tools: BZ GK. Wrote the paper: LS MK GK.
References
1. Antonetti DA, Klein R, Gardner TW (2012) Diabetic retinopathy. N Engl J Med 366: 1227–1239. doi:
10.1056/NEJMra1005073PMID:22455417
2. Lim A (2014) Diabetic nephropathy—complications and treatment. Int J Nephrol Renovasc Dis 7: 361– 381. doi:10.2147/IJNRD.S40172PMID:25342915
3. Said G (2007) Diabetic neuropathy—a review. Nat Clin Pract Neurol 3: 331–340. PMID:17549059
4. Alvarez Y, Chen K, Reynolds AL, Waghorne N, O'Connor JJ, Kennedy BN (2010) Predominant cone photoreceptor dysfunction in a hyperglycaemic model of non-proliferative diabetic retinopathy. Dis Model Mech 3: 236–245. doi:10.1242/dmm.003772PMID:20142328
5. Das A, McGuire PG, Rangasamy S (2015) Diabetic Macular Edema: Pathophysiology and Novel Ther-apeutic Targets. Ophthalmology 122: 1375–1394. doi:10.1016/j.ophtha.2015.03.024PMID:
25935789
6. Gallemore RP, Nguyen D (2008) When Anti-VEGF Treatment Fails. Review of Ophthalmology March:
http://www.reviewofophthalmology.com/content/d/retinal_insider/i/1230/c/23141/
7. Lux A, Llacer H, Heussen FM, Joussen AM (2007) Non-responders to bevacizumab (Avastin) therapy of choroidal neovascular lesions. Br J Ophthalmol 91: 1318–1322. PMID:17537784
8. Palejwala NV, Lauer AK (2014) Aflibercept: an update on recent milestones achieved. Drugs Today (Barc) 50: 779–790.
9. Freund KB, Mrejen S, Gallego-Pinazo R (2013) An update on the pharmacotherapy of neovascular age-related macular degeneration. Expert Opin Pharmacother 14: 1017–1028. doi:10.1517/
14656566.2013.787410PMID:23560774
10. Bousquet M, Zhuang G, Meng C, Ying W, Cheruku PS, Shie AT, et al. (2013) miR-150 blocks MLL-AF9-associated leukemia through oncogene repression. Mol Cancer Res 11: 912–922. doi:10.1158/
1541-7786.MCR-13-0002-TPMID:23604034
11. Witkin AJ, Brown GC (2011) Update on nonsurgical therapy for diabetic macular edema. Curr Opin Ophthalmol 22: 185–189. doi:10.1097/ICU.0b013e3283459724PMID:21427573
12. Binder S (2012) Loss of reactivity in intravitreal anti-VEGF therapy: tachyphylaxis or tolerance? Br J Ophthalmol 96: 1–2. doi:10.1136/bjophthalmol-2011-301236PMID:22157632
13. Eghoj MS, Sorensen TL (2012) Tachyphylaxis during treatment of exudative age-related macular degeneration with ranibizumab. Br J Ophthalmol 96: 21–23. doi:10.1136/bjo.2011.203893PMID:
21733918
14. Good TJ, Kimura AE, Mandava N, Kahook MY (2011) Sustained elevation of intraocular pressure after intravitreal injections of anti-VEGF agents. Br J Ophthalmol 95: 1111–1114. doi:10.1136/bjo.2010.
180729PMID:20702430
15. Tolentino M (2011) Systemic and ocular safety of intravitreal anti-VEGF therapies for ocular neovascu-lar disease. Surv Ophthalmol 56: 95–113. doi:10.1016/j.survophthal.2010.08.006PMID:21335144
16. Bartel DP (2004) MicroRNAs: genomics, biogenesis, mechanism, and function. Cell 116: 281–297. PMID:14744438
17. Marika Kapsimali WPK, de Bruijn Ewart, Rosa Frederic, Plasterk Ronald HA, and Wilson Stephen W (2007) MicroRNAs show a wide diversity of expression profiles in the developing and mature central nervous system. Genome Biol 8: R173. PMID:17711588
18. Schulte C, Zeller T (2015) microRNA-based diagnostics and therapy in cardiovascular disease-Sum-ming up the facts. Cardiovasc Diagn Ther 5: 17–36. doi:10.3978/j.issn.2223-3652.2014.12.03PMID:
25774345
19. Yoshino H, Seki N, Itesako T, Chiyomaru T, Nakagawa M, Enokida H (2013) Aberrant expression of microRNAs in bladder cancer. Nat Rev Urol 10: 396–404. doi:10.1038/nrurol.2013.113PMID:
23712207
21. Conte I, Hadfield KD, Barbato S, Carrella S, Pizzo M, Bhat RS, et al. (2015) MiR-204 is responsible for inherited retinal dystrophy associated with ocular coloboma. Proc Natl Acad Sci U S A 112: E3236– 3245. doi:10.1073/pnas.1401464112PMID:26056285
22. Chen GQ, Lian WJ, Wang GM, Wang S, Yang YQ, Zhao ZW (2012) Altered microRNA expression in skeletal muscle results from high-fat diet-induced insulin resistance in mice. Mol Med Rep 5: 1362– 1368. doi:10.3892/mmr.2012.824PMID:22395471
23. Park JH, Ahn J, Kim S, Kwon DY, Ha TY (2011) Murine hepatic miRNAs expression and regulation of gene expression in diet-induced obese mice. Mol Cells 31: 33–38. doi:10.1007/s10059-011-0009-7
PMID:21120623
24. Chartoumpekis DV, Zaravinos A, Ziros PG, Iskrenova RP, Psyrogiannis AI, Kyriazopoulou VE, et al. (2012) Differential expression of microRNAs in adipose tissue after long-term high-fat diet-induced obe-sity in mice. PLoS One 7: e34872. doi:10.1371/journal.pone.0034872PMID:22496873
25. Xie H, Lim B, Lodish HF (2009) MicroRNAs induced during adipogenesis that accelerate fat cell devel-opment are downregulated in obesity. Diabetes 58: 1050–1057. doi:10.2337/db08-1299PMID:
19188425
26. Xie H, Sun L, Lodish HF (2009) Targeting microRNAs in obesity. Expert Opin Ther Targets 13: 1227– 1238. doi:10.1517/14728220903190707PMID:19650761
27. Kovacs B, Lumayag S, Cowan C, Xu S (2011) MicroRNAs in early diabetic retinopathy in streptozoto-cin-induced diabetic rats. Invest Ophthalmol Vis Sci 52: 4402–4409. doi:10.1167/iovs.10-6879PMID:
21498619
28. Creemers EE, Tijsen AJ, Pinto YM (2012) Circulating microRNAs: novel biomarkers and extracellular communicators in cardiovascular disease? Circ Res 110: 483–495. doi:10.1161/CIRCRESAHA.111.
247452PMID:22302755
29. Xiao C, Calado DP, Galler G, Thai TH, Patterson HC, Wang J, et al. (2007) MiR-150 controls B cell dif-ferentiation by targeting the transcription factor c-Myb. Cell 131: 146–159. PMID:17923094
30. Zhou B, Wang S, Mayr C, Bartel DP, Lodish HF (2007) miR-150, a microRNA expressed in mature B and T cells, blocks early B cell development when expressed prematurely. Proc Natl Acad Sci U S A 104: 7080–7085. PMID:17438277
31. Zhang Y, Liu D, Chen X, Li J, Li L, Bian Z, et al. (2010) Secreted monocytic miR-150 enhances targeted endothelial cell migration. Mol Cell 39: 133–144. doi:10.1016/j.molcel.2010.06.010PMID:20603081
32. Shen J, Yang X, Xie B, Chen Y, Swaim M, Hackett SF, et al. (2008) MicroRNAs regulate ocular neovas-cularization. Mol Ther 16: 1208–1216. doi:10.1038/mt.2008.104PMID:18500251
33. Liu CH, Sun Y, Li J, Gong Y, Tian KT, Evans LP, et al. (2015) Endothelial microRNA-150 is an intrinsic suppressor of pathologic ocular neovascularization. Proc Natl Acad Sci U S A 112: 12163–12168. doi:
10.1073/pnas.1508426112PMID:26374840
34. Chang RC, Shi L, Huang CC, Kim AJ, Ko ML, Zhou B, et al. (2015) High-Fat Diet-Induced Retinal Dys-function. Invest Ophthalmol Vis Sci 56: 2367–2380. doi:10.1167/iovs.14-16143PMID:25788653
35. Winzell MS, Ahren B (2004) The high-fat diet-fed mouse: a model for studying mechanisms and treat-ment of impaired glucose tolerance and type 2 diabetes. Diabetes 53 Suppl 3: S215–219. PMID:
15561913
36. Weisberg SP, McCann D, Desai M, Rosenbaum M, Leibel RL, Ferrante AW Jr. (2003) Obesity is asso-ciated with macrophage accumulation in adipose tissue. J Clin Invest 112: 1796–1808. PMID:
14679176
37. Lumeng CN, Deyoung SM, Bodzin JL, Saltiel AR (2007) Increased inflammatory properties of adipose tissue macrophages recruited during diet-induced obesity. Diabetes 56: 16–23. PMID:17192460
38. Zhuang G, Meng C, Guo X, Cheruku PS, Shi L, Xu H, et al. (2012) A novel regulator of macrophage activation: miR-223 in obesity-associated adipose tissue inflammation. Circulation 125: 2892–2903.
doi:10.1161/CIRCULATIONAHA.111.087817PMID:22580331
39. Hotamisligil GS, Arner P, Caro JF, Atkinson RL, Spiegelman BM (1995) Increased adipose tissue expression of tumor necrosis factor-alpha in human obesity and insulin resistance. J Clin Invest 95: 2409–2415. PMID:7738205
40. Kern PA, Saghizadeh M, Ong JM, Bosch RJ, Deem R, Simsolo RB (1995) The expression of tumor necrosis factor in human adipose tissue. Regulation by obesity, weight loss, and relationship to lipopro-tein lipase. J Clin Invest 95: 2111–2119. PMID:7738178
42. Boden G, She P, Mozzoli M, Cheung P, Gumireddy K, Reddy P, et al. (2005) Free fatty acids produce insulin resistance and activate the proinflammatory nuclear factor-kappaB pathway in rat liver. Diabetes 54: 3458–3465. PMID:16306362
43. Ahren B, Simonsson E, Scheurink AJ, Mulder H, Myrsen U, Sundler F (1997) Dissociated insulinotropic sensitivity to glucose and carbachol in high-fat diet-induced insulin resistance in C57BL/6J mice. Metabolism 46: 97–106. PMID:9005977
44. Vinores SA, Campochiaro PA, May EE, Blaydes SH (1988) Progressive ultrastructural damage and thickening of the basement membrane of the retinal pigment epithelium in spontaneously diabetic BB rats. Exp Eye Res 46: 545–558. PMID:3384013
45. Rajagopal R, Bligard GW, Zhang S, Yin L, Lukasiewicz P, Semenkovich CF (2016) Functional Deficits Precede Structural Lesions in Mice with High-Fat Diet-Induced Diabetic Retinopathy. Diabetes.
46. Surwit RS, Feinglos MN, Rodin J, Sutherland A, Petro AE, Opara EC, et al. (1995) Differential effects of fat and sucrose on the development of obesity and diabetes in C57BL/6J and A/J mice. Metabolism 44: 645–651. PMID:7752914
47. Chou JC, Rollins SD, Fawzi AA (2013) Trypsin digest protocol to analyze the retinal vasculature of a mouse model. J Vis Exp: e50489. doi:10.3791/50489PMID:23793268
48. Newman EA, Odette LL (1984) Model of electroretinogram b-wave generation: a test of the K+ hypothe-sis. J Neurophysiol 51: 164–182. PMID:6319623
49. Pinto LH, Invergo B, Shimomura K, Takahashi JS, Troy JB (2007) Interpretation of the mouse electro-retinogram. Doc Ophthalmol 115: 127–136. PMID:17636411
50. Wachtmeister L (1987) Basic research and clinical aspects of the oscillatory potentials of the electroreti-nogram. Doc Ophthalmol 66: 187–194. PMID:3322748
51. Olsson AK, Dimberg A, Kreuger J, Claesson-Welsh L (2006) VEGF receptor signalling—in control of vascular function. Nat Rev Mol Cell Biol 7: 359–371. PMID:16633338
52. Aiello LP, Avery RL, Arrigg PG, Keyt BA, Jampel HD, Shah ST, et al. (1994) Vascular endothelial growth factor in ocular fluid of patients with diabetic retinopathy and other retinal disorders. N Engl J Med 331: 1480–1487. PMID:7526212
53. Luo Z, Wen G, Wang G, Pu X, Ye S, Xu Q, et al. (2013) MicroRNA-200C and -150 play an important role in endothelial cell differentiation and vasculogenesis by targeting transcription repressor ZEB1. Stem Cells 31: 1749–1762. doi:10.1002/stem.1448PMID:23765923
54. Tang Y, Wang Y, Park KM, Hu Q, Teoh JP, Broskova Z, et al. (2015) MicroRNA-150 protects the mouse heart from ischaemic injury by regulating cell death. Cardiovasc Res 106: 387–397. doi:10.
1093/cvr/cvv121PMID:25824147
55. Narasaraju T, Shukla D, More S, Huang C, Zhang L, Xiao X, et al. (2015) Role of microRNA-150 and glycoprotein nonmetastatic melanoma protein B in angiogenesis during hyperoxia-induced neonatal lung injury. Am J Respir Cell Mol Biol 52: 253–261. doi:10.1165/rcmb.2013-0021OCPMID:25054912
56. Long J, Wang Y, Wang W, Chang BH, Danesh FR (2010) Identification of microRNA-93 as a novel reg-ulator of vascular endothelial growth factor in hyperglycemic conditions. J Biol Chem 285: 23457– 23465. doi:10.1074/jbc.M110.136168PMID:20501654
57. McArthur K, Feng B, Wu Y, Chen S, Chakrabarti S (2011) MicroRNA-200b regulates vascular endothe-lial growth factor-mediated alterations in diabetic retinopathy. Diabetes 60: 1314–1323. doi:10.2337/
db10-1557PMID:21357793
58. Fish JE, Santoro MM, Morton SU, Yu S, Yeh RF, Wythe JD, et al. (2008) miR-126 regulates angiogenic signaling and vascular integrity. Dev Cell 15: 272–284. doi:10.1016/j.devcel.2008.07.008PMID:
18694566
59. Mitchell PS, Parkin RK, Kroh EM, Fritz BR, Wyman SK, Pogosova-Agadjanyan EL, et al. (2008) Circu-lating microRNAs as stable blood-based markers for cancer detection. Proc Natl Acad Sci U S A 105: 10513–10518. doi:10.1073/pnas.0804549105PMID:18663219
60. Lawrie CH, Gal S, Dunlop HM, Pushkaran B, Liggins AP, Pulford K, et al. (2008) Detection of elevated levels of tumour-associated microRNAs in serum of patients with diffuse large B-cell lymphoma. Br J Haematol 141: 672–675. doi:10.1111/j.1365-2141.2008.07077.xPMID:18318758
61. Liu Y, Zhao L, Li D, Yin Y, Zhang CY, Li J, et al. (2013) Microvesicle-delivery miR-150 promotes tumori-genesis by up-regulating VEGF, and the neutralization of miR-150 attenuate tumor development. Pro-tein Cell 4: 932–941. doi:10.1007/s13238-013-3092-zPMID:24203759
62. Prakhar P, Holla S, Ghorpade DS, Gilleron M, Puzo G, Udupa V, et al. (2015) Ac2PIM-responsive miR-150 and miR-143 target receptor-interacting protein kinase 2 and transforming growth factor beta-acti-vated kinase 1 to suppress NOD2-induced immunomodulators. J Biol Chem 290: 26576–26586. doi:
63. Rodriguez-Lebron E, Liu G, Keiser M, Behlke MA, Davidson BL (2013) Altered Purkinje cell miRNA expression and SCA1 pathogenesis. Neurobiol Dis 54: 456–463. doi:10.1016/j.nbd.2013.01.019
PMID:23376683
64. Ito M, Teshima K, Ikeda S, Kitadate A, Watanabe A, Nara M, et al. (2014) MicroRNA-150 inhibits tumor invasion and metastasis by targeting the chemokine receptor CCR6, in advanced cutaneous T-cell lym-phoma. Blood 123: 1499–1511. doi:10.1182/blood-2013-09-527739PMID:24385540
65. Koch S, Claesson-Welsh L (2012) Signal transduction by vascular endothelial growth factor receptors. Cold Spring Harb Perspect Med 2: a006502. doi:10.1101/cshperspect.a006502PMID:22762016
66. Lu J, Guo S, Ebert BL, Zhang H, Peng X, Bosco J, et al. (2008) MicroRNA-mediated control of cell fate in megakaryocyte-erythrocyte progenitors. Dev Cell 14: 843–853. doi:10.1016/j.devcel.2008.03.012
PMID:18539114
67. Ishida M, El-Mounayri O, Kattman S, Zandstra P, Sakamoto H, Ogawa M, et al. (2012) Regulated expression and role of c-Myb in the cardiovascular-directed differentiation of mouse embryonic stem cells. Circ Res 110: 253–264. doi:10.1161/CIRCRESAHA.111.259499PMID:22116818
68. Dai G, Sakamoto H, Shimoda Y, Fujimoto T, Nishikawa S, Ogawa M (2006) Over-expression of c-Myb increases the frequency of hemogenic precursors in the endothelial cell population. Genes Cells 11: 859–870. PMID:16866870
69. Joseph LJ, Le Beau MM, Jamieson GA Jr., Acharya S, Shows TB, Rowley JD, et al. (1988) Molecular cloning, sequencing, and mapping of EGR2, a human early growth response gene encoding a protein with "zinc-binding finger" structure. Proc Natl Acad Sci U S A 85: 7164–7168. PMID:3140236
70. Nagarajan R, Svaren J, Le N, Araki T, Watson M, Milbrandt J (2001) EGR2 mutations in inherited neu-ropathies dominant-negatively inhibit myelin gene expression. Neuron 30: 355–368. PMID:11394999
71. Maric G, Rose AA, Annis MG, Siegel PM (2013) Glycoprotein non-metastatic b (GPNMB): A metastatic mediator and emerging therapeutic target in cancer. Onco Targets Ther 6: 839–852. doi:10.2147/
OTT.S44906PMID:23874106
72. Becker PM, Waltenberger J, Yachechko R, Mirzapoiazova T, Sham JS, Lee CG, et al. (2005) Neuropi-lin-1 regulates vascular endothelial growth factor-mediated endothelial permeability. Circ Res 96: 1257–1265. PMID:15920019
73. Ying W, Tseng A, Chang RC, Wang H, Lin YL, Kanameni S, et al. (2016) miR-150 regulates obesity-associated insulin resistance by controlling B cell functions. Sci Rep 6: 20176. doi:10.1038/srep20176