A Systematic Review of Mapping Strategies for the
Sonification of Physical Quantities
Gae¨l Dubus*, Roberto Bresin
Department of Speech, Music and Hearing, School of Computer Science and Communication, KTH Royal Institute of Technology, Stockholm, Sweden
Abstract
The field of sonification has progressed greatly over the past twenty years and currently constitutes an established area of research. This article aims at exploiting and organizing the knowledge accumulated in previous experimental studies to build a foundation for future sonification works. A systematic review of these studies may reveal trends in sonification design, and therefore support the development of design guidelines. To this end, we have reviewed and analyzed 179 scientific publications related to sonification of physical quantities. Using a bottom-up approach, we set up a list of conceptual dimensions belonging to both physical and auditory domains. Mappings used in the reviewed works were identified, forming a database of 495 entries. Frequency of use was analyzed among these conceptual dimensions as well as higher-level categories. Results confirm two hypotheses formulated in a preliminary study: pitch is by far the most used auditory dimension in sonification applications, and spatial auditory dimensions are almost exclusively used to sonify kinematic quantities. To detect successful as well as unsuccessful sonification strategies, assessment of mapping efficiency conducted in the reviewed works was considered. Results show that a proper evaluation of sonification mappings is performed only in a marginal proportion of publications. Additional aspects of the publication database were investigated: historical distribution of sonification works is presented, projects are classified according to their primary function, and the sonic material used in the auditory display is discussed. Finally, a mapping-based approach for characterizing sonification is proposed.
Citation:Dubus G, Bresin R (2013) A Systematic Review of Mapping Strategies for the Sonification of Physical Quantities. PLoS ONE 8(12): e82491. doi:10.1371/ journal.pone.0082491
Editor:Michael J. Proulx, University of Bath, United Kingdom
ReceivedMay 30, 2013;AcceptedOctober 24, 2013;PublishedDecember 17, 2013
Copyright:ß2013 Dubus, Bresin. This is an open-access article distributed under the terms of the Creative Commons Attribution License, which permits unrestricted use, distribution, and reproduction in any medium, provided the original author and source are credited.
Funding:This work was supported by the Swedish Research Council, Grant Nr. 2010-4654. The funders had no role in study design, data collection and analysis, decision to publish, or preparation of the manuscript.
Competing Interests:The authors have declared that no competing interests exist. * E-mail: [email protected]
Introduction
In this article we present a systematic review of results from studies in the field of sonification documented in 179 scientific publications representing 60 projects. The main idea is to draw an overview of a specific area of the relatively new research field of sonification in order to identify established methods and techniques. To this end, we have built up a database of sonification works currently comprising 734 entries. We set a particular focus on mappings of physical dimensions of sonified data to psycho-physical and psycho-physical dimensions of the resulting sound, which we call auditory dimensions. We first present the concept of sonification: its nature, existing techniques, and a brief historical overview. In Section 2 we introduce our systematic review by presenting its objectives and restrictions. The method used for building the publication database and extracting the data is described in detail in Section 3. In Section 4 we present the sixty projects analyzed for this study by providing a brief description, mentioning the sonic material that was used, and listing the mappings. These data are analyzed and discussed in Section 5. The article ends with conclusions, suggestions for future work and the proposition of a mapping-based approach for characterizing sonification.
1.1 Nature of sonification
Several successive definitions of sonification have appeared since the concept was formally introduced in the 1990s. Although some earlier scientific works could qualify as genuine sonification (some are presented in Section 1.3), it seems that the term was first coined by William Buxton at a tutorial of the CHI conference in 1989, as:
‘‘The use of sound for data representation [, being] the auditory counterpart of data visualization.’’ [1]
At first defined by analogy to scientific visualization, sonification rapidly gained significance as a research topic in itself, and the first conference dedicated to auditory display (International Confer-ence on Auditory Display – ICAD) was founded in 1992 by Gregory Kramer. The numerous thoughts and findings resulting from this conference were summarized in Auditory display [2], published in 1994, where other definitions were proposed, the most elaborated being Scaletti’s ‘‘working definition’’:
‘‘A mapping of numerically represented relations in some domain under study to relations in an acoustic domain for the purposes of interpreting, understanding, or communicating relations in the domain under study.’’ [3]
Sonification researchers gathered again at ICAD 1997 in order to report about the state-of-the-art of the field at that time and their ideas about future challenges. This led to the publication of the NSF Sonification report [4], where a new definition was formulated:
‘‘Sonification is defined as the use of nonspeech audio to convey information. More specifically, sonification is the transformation of data relations into perceived relations in an acoustic signal for the purposes of facilitating communication or interpretation.’’
The research community seems to have accepted this definition, as mentioned by Walker and Nees in theSonification handbook[5] — the most recent effort to provide an exhaustive overview of the field.
Nevertheless, defining the boundaries of sonification is still a hot topic, with some researchers expressing the need of having a somewhat stricter, systematic definition [6,7], whereas others are willing to step over the border to data-driven music [8]. This ambivalence is reflected in the ICAD program, where an increasing significance is attached to artistic works: a concert centered around sonification was included as a social event since 2000, a sonification contest has been organized since 2009, and topics of interest listed in the ICAD call for papers electively include references to art — ‘‘auditory display and art’’ in 2002, ‘‘sound as art’’ in 2010 and finally ‘‘sonification as art’’ in 2012 and 2013. Supper, in a sociological study of the ICAD community [9], reported the controversy created by Hermann’s attempt to ‘‘narrow down the boundaries of the field’’. Altogether, this janiform evolution indicates that a full consensus has not been adopted yet on the nature of sonification.
When comparing the successive definitions, it appears that qualifying a work as sonification is fundamentally related to its purpose: indeed, one could not determine if a sound is an emanation of sonification just by listening to it. This claim is in line with Scaletti’s own reflexions on her early definition: ‘‘That the sound be data-driven is necessary but not sufficient justification for calling it sonification; it must also have been done with the intent of understanding or communicating something about the original domain’’ [3]. The significance of this aspect was recently supported by Varni et al. who claimed that, although not fitting into Hermann’s definition, mapping to high-level auditory dimensions using music material should be allowed in sonification, provided that the main goal was ‘‘to optimise efficiency of information communication’’ and not ‘‘o be pleasant to hear or to arouse particular feelings for the participants’’[10].
1.2 Character of sonification
The field of sonification is interdisciplinary by nature. Like visualization, it can be applied to any kind of data, interactively or not, making it potentially useful for a large set of different domains. Sonification as a research topic is itself at the junction of numerous scientific disciplines including human-computer interaction, psy-choacoustics, engineering design, human factors and ergonomics, assistive technology, and cognitive sciences. This is nicely illustrated by the ‘‘nterdisciplinary circle of sonification and auditory display’’in the introduction to the Sonification handbook [11].
As for any sort of auditory display, the use of sound as a medium for communicating information in sonification makes it particu-larly well suited for time-related tasks such as monitoring or synchronization. Taking advantage of the strong relationship between auditory perception and motor control [12], sonification can also be a valuable assistance to the perception of movements,
and more specifically to the perception of one’s own body motion, i.e. kinesthesia. Combining these two aspects makes sonification an ideal candidate to support the design of applications related to physical training and rehabilitation, e.g. in sport [13–16]. Other popular applications are in the fields of data exploration (e.g. [17]), data mining (e.g. [18]), and sensory substitution, e.g. for assisting visually impaired people [19,20]. All in all, sonification represents a good complement to visualization insofar as the strengths of hearing and vision lie in different areas.
Various sonification techniques have been elaborated and formalized since the 1990s. The most widely accepted of these among the research community are described in detail in the Sonification handbook: audification [21], auditory icons [22], earcons [23], parameter mapping sonification [24], and model-based sonification [25].Audificationis the direct playback of data streams as sound waves, allowing only some minor processing for the signal to become audible. Auditory icons are based on an ecological approach to auditory perception, associating short environmental sounds with discrete events in the data in order to create metaphorical perceptual relationships, e.g. the mechanical ‘‘click’’ sound in digital cameras. Earcons are similar to auditory icons regarding how data are considered and with respect to brevity, but using entirely synthetic sounds with no prior metaphorical value, e.g. a melody indicating the battery level in mobile phones. Earcons create perceptual relationships that have to be learned from scratch, but can be easily parameterized and combined with each other to form hierarchical patterns of information.
Parameter mapping sonificationconsists in defining a set of mappings — the nature of which is discussed in Section 2.2 — between data dimensions and auditory dimensions. While simple to design, this technique has the potential to communicate information in a continuous manner, therefore being the most widely used sonification technique. Whereas it allows for a much greater flexibility than the previous techniques, the design of each mapping should, in return, be considered very carefully: an unfortunate choice can dramatically affect the usability of the whole system.
Model-based sonification was introduced by Hermann and Ritter [26] in an attempt to move away from the simplicity of parameter mapping sonification. Specifically designed for interactive con-texts, model-based sonification aims at benefiting from the learning abilities pertaining to everyday listening [27,28]. This technique is grounded in the human ability to associate a perceived sound and its characteristics with the source that generated it and its properties. For example we can distinguish between a broken table tennis ball and a new one by the different spectral characteristics of their impact sound, the sound of a broken ball having usually a higher centroid. Model-based sonification consists in defining a dynamic model representing a system that can evolve in time following a set of abstract laws, resulting in the creation of a virtual sounding object when data are injected into it. The sound is triggered when the user interacts with the system to activate the corresponding sounding object. The same model can be used with data coming from different domains, structurally different, and independently of their dimensionality. By analogy to the practice of a musical instrument, the model can be seen as a set of physical laws governing sound production and propagation, and the data as an instrument sounding only when manipulated by a player. Data from different domains could sound like different instruments, whereas structurally similar datasets would represent the same instrument with different qualities. To summarize, this approach allows the user to uncover relationships in the data in the same way that a musician would learn how to master an instrument.
Systematic Review Physical Sonification Mappings
1.3 Sonification in a historical perspective
History is rich with examples of use of the auditory modality to represent phenomena from the physical world. The use of auditing in Mesopotamia as early as 3500 BCE to detect anomalies in accounts of commodities is currently regarded as one of the first known implementations of data sonification [29]. Auditory displays have been exploited to perceive various physical dimensions such as temporal, physiological or kinematic variables long before sonification techniques were formalized: automatic alarm signals and striking clocks were used in ancient Greece (e.g. by combining a clepsydra with a water organ [30]) and medieval China to provide information about elapsed time. Pythagoreans reportedly defined a musical scale by associating different tones with various heavenly bodies according to their apparent velocity as seen from the Earth. Inspired by this approach in his treatise Harmonices Mundi (1619), Kepler transposed the Pythagorean concept of (harmony of the spheres) onto a heliocentric model. He assigned to each planet a fundamental tone depending on its aphelion (maximum distance to the sun), which was then changed in pitch depending on the angular displacement of the planet as seen from the sun, thus covering a specific interval as the planet moved around its orbit. This led him to focus on a harmonic relationship between the mean distance and the orbital period of a celestial body, which he finally discovered and exposed in his third law of planetary motion [31].
The stethoscope, a device performing the audification of heart rate, breath and blood pressure among others, was invented by Lae¨nnec in 1816. Its design from the 1940s is still the one in use in everyday medical practice.
Probably one of the most well-known devices to integrate an auditory display system — popular among the public and emblematic for sonification researchers — is the Geiger counter, which translates ionizing radiation into clicks with a pulse depending on the level of radiation. But what made it so popular? This particular auditory feedback was originally designed as a complement to the visualization performed on the earliest devices by an electrometer, since this tedious method of measurement was not entirely satisfying. The first use of an auditory Geiger counter was reported in 1917, when a sensitive telephone was incorporated in the electrical circuit in order to listen to the audification of electrical impulses due to the ionization of the gas in the tube of the counter [32]. Already used nearly 40 years before for audifying a magnetically induced current in the nerves of frog legs [33] and in conducting wires subject to changes of molecular structure [34], this setup later evolved to include more advanced components for amplification and recording, loudspeakers, or headphones. By taking a step back and considering the Geiger counter as a device performing sonification of the level of ionizing radiation (instead of audification of electrical current), the issue of the mapping strategy emerges. Therein may lie the veritable key to its success: to transpose a physical quantity that is essentially non-visual — and pictured in everyone’s imagination as very important because life-threatening — to the auditory modality through clicks with a varying pulse.
More recent applications of auditory displays were sparsely introduced during the twentieth century (e.g. Pollack and Ficks [35] in 1954, Speeth [36] in 1961, Kay [19] in 1974, Yeung [37] in 1980) but the starting point of the outburst of research in this field was the first ICAD conference in 1992 and the subsequent seminal work reported in the proceedings edited by Kramer [2]. Sonification, a particular case of auditory display, is therefore a relatively recent matter of concern for scientists, yet it has gained a certain maturity in about twenty years of research. Even if sonification is a narrow niche of interdisciplinary applied sciences
— e.g. as compared to scientific visualization — the community of researchers has grown significantly and is now producing burgeoning examples of practical applications.
Motivations
2.1 Why a systematic review?
We see the need for drawing an overview of the field of sonification in order to understand what the most successful and promising strategies are when sonifying data, and provide researchers, designers, and practitioners in the field with a starting point with strong foundations that will allow the field of sonification to make a leap forward. Our aim is to provide answers to questions such as: ‘‘What are the domains of application of sonification?’’, ‘‘What is the historical distribution?’’, ‘‘What kind of sound is used?’’, and ‘‘What are the most popular mappings?’’
More in detail, we want to organize the knowledge accumulated in nearly 20 years of research, learn from previous research which mappings are natural, popular, successful, or unsuccessful, and build a foundation for future sonification works. The aim of our study is to look at previous sonification designs in order to perform a systematic review of the mappings between physical and auditory dimensions present in the literature. We should be able to identify whether some particular associations between physical quantities and sound parameters are more used than others. This would not imply that these associations are the most successful ones, but it will suggest which should be investigated first, for example when designing new sonification-based applications.
We have therefore decided to focus on publications dealing with sonification, by combining results of a large number of indepen-dent studies. This will enable the iindepen-dentification of patterns in the published results, common trends, and critical sticking points. We developed a method for identifying potentially interesting papers, for extracting scientific information from them, and at the same time avoiding bias between articles providing very detailed descriptions and more concise ones (see Section 3). This resulted in a large pool of papers (about 700) that we organized into a database, from which we randomly selected sixty sonification projects for the systematic review introduced in Section 4. These projects correspond to a total of 179 scientific publications, and constitute a sample of typical sonification works.
There have been previous overview works in the field of sonification. The closest work to that described in the present study was documented in the pioneering work by Walker and Lane [38] who proposed the design of a database for providing ‘‘a searchable online record of sonification mappings and auditory display techniques’’. Other overview works include a review of electronic aids for blind people [39], an overview of auditory display of molecular information [40], a review of biofeedback technologies for neuromotor rehabilitation [41], a study of evaluation methods for sonification [42], a study of sound synthesis tools used for sonification applications [43], a review of methods for image sonification [44], a historical review of the use of sonification in a database of networked music and sound art [45], a review of aesthetic strategies in sonification [46], a recent large review of visual, haptic, auditory and multimodal display [47], and overviews of the whole field of sonification (e.g. by Worrall [29] and in theSonification Handbook[48]).
2.2 Mapping information to the auditory domain In our study we define mapping in sonification as a functionf from a subspaceX of the data domain to a subspace Y of the auditory domain. No condition is required onf, which can be Systematic Review Physical Sonification Mappings
non-linear, or even discontinuous. However, Scaletti [3] indicates that, in order to qualify as sonification, the mapping should not be completely arbitrary nor excessively complex (so that data relations are decipherable). The domain of f, i.e. the data subspaceX, can be multidimensional, making f multivariate. In the case where elements ofXandYcan be ordered, the mapping is said to have a polarity iff is monotonic.
Among the sonification techniques presented in the section 1.2, parameter mapping sonification is the most widely used for representing multidimensional data as sound. It is indeed the simplest way to continuously map data to sound. Using parameter mapping sonification forces the quantification of both the data subspace X in input and the auditory domain subspace Y in output. Many dimensions can be displayed in parallel, and the mappings can be changed in real-time, making this method suitable for example in interactive sonification applications. Whereas they constitute the bulk of the design of a sonification system in the case of parameter mapping sonification, mappings can also be identified while using other sonification techniques.
As mentioned above, previous work on sonification mappings has been initiated by Walker et al., and is summarized in Walker’s doctoral dissertation [49]. Walker and Lane’s mapping database [38] was meant to organize sonification mappings according to three design components: nature, polarity, and scaling of the mapping (as documented in [50]). In doing so, they split up the design process of parameter mapping sonification into three stages: choice of the mapping strategy (i.e., which auditory dimension to use to represent a specific data dimension), choice of polarity, and psychophysical scaling. This work was based on perceptual studies to guide the design process following these three successive stages, and dealt with a limited number of generic data dimensions (e.g. ‘‘Temperature’’, ‘‘Pressure’’, ‘‘Velocity’’).
2.3 Restriction to physical quantities
In the present work, we restrict our investigation to mappings between physical and auditory dimensions. We believe that we will come up with a list of mappings that could be easily implemented using physics-based sound models such as those provided in the Sound Design Toolkit [51]. This will allow for the design of a test bed for psychophysical experiments for the validation of the mappings and their properties, extending the pioneering study by Walker et al. [50].
We expect to extract a large variety of data from our database concerning domains, scales, and vocabulary. We will need to gather them into different categories at several levels, as presented in the next section. In this scope, the fact that physical quantities often correspond to concrete measures represents an advantage, the resulting categories being less subject to ambiguity than in the case of abstract data. Domains of mappings (Xin Section 2.2) are subspaces of the considered data domain. Choosing the physical domain as data domain implies that the domains of mappings that we consider can most of the time be ordered (as these measures can be compared in the physical world). As a consequence, a polarity may be defined on this category of mappings.
Methods
3.1 Building up the publication database
3.1.1 Creating the publication database. We started our study by collecting a large pool of scientific publications in order to initiate the filling of the publication database.
Any type of work about sonification may include descriptions of mappings and may therefore be included in the publication database, provided that some part of the sonified data can be
qualified asphysical quantitiesas described previously. In practice, sonification projects are most often described with an acceptable depth in articles from peer-reviewed journals and conference proceedings, doctoral theses, and patent applications. Articles correspond to the most suitable format for our study: they are relatively short and describe often a single research project in a concise manner. We chose therefore to initiate the publication database by creating a pool of articles obtained by browsing several online journal databases (Springer Link [52], IEEE Xplore [53], ScienceDirect [54], PubMed [55], ACM Digital Library [56], ASA Digital Library [57], Ingentaconnect [58]), as well as proceedings from specialized conferences (ICAD [59], ISon [60], CHI [61], SMC [62], NIME [63], Audio Mostly [64]), and Google Scholar [65]. We do not, however, limit entries of the publication database to research articles, and other types of documents have been inserted following the expansion process presented in the next subsection. Doctoral theses can include unpublished project developments. Patents are by necessity technically more comprehensive than research articles, and can be helpful whenever the description in a related article is sparse or ambiguous. Some interesting information could also be extracted from book chapters, technical reports, master theses, artistic project descriptions, and websites, though those do not represent the majority of the target documents.
The first step of the article selection was performed by filtering the online databases listed above using the only keyword ‘‘sonification’’, which typically gave a few hundred results in one go. Articles employing this term in the sense commonly used in biochemistry — i.e. sonic stimulation or irradiation by sound or ultrasound waves — were immediately discarded. We were aware that this process alone would not allow us to include projects published earlier than the formalization of auditory display techniques in the beginning of the 1990s, but this issue was later resolved by the process of expanding the publication database, as presented in the next subsection. For each search result, the criterion for inclusion in the publication database was the following: the title or the abstract of the article had to foreshadow the implementation of a practical application of sonification. It should not be too general like the presentation of a new software platform for sonification, nor too theoretical like the introduction of a taxonomy or a design framework. Sonification of abstract data such as stock market data or web traffic was left aside since we were only interested in physical quantities.
3.1.2 Reading and expanding the publication database. With the method described in the previous subsec-tion, we created an initial pool of articles, from which we could start our analysis. Interestingworks cited in the articles from this initial pool were progressively included into our publication database. A given work was considered ‘‘interesting’’ whenever it matched the criterion for article inclusion defined in the previous subsection, i.e. the implementation of a practical application of sonification of physical quantities. This could be deduced either from the title and abstract as previously, or from the description in the citing article. In this way, the publication database could be expanded by including significant works published before the 1990s (i.e. before the term ‘‘sonification’’ appeared).
It appeared soon that reading and analyzing all the articles collected in the publication database would take a considerable amount of time, given that the number of entries seemed to grow exponentially, at least in a first phase. A shell script for the random selection of the next article to read was implemented in order to keep an even distribution of topics, research groups and time frame among the articles considered for the systematic review.
Systematic Review Physical Sonification Mappings
The systematic review is conducted on data extracted from projects, not from single articles. When an article is picked up from the publication database, we first look forsimilararticles stored in the publication database in order to group them into a project. Two articles are considered ‘‘similar’’ when they share the same objective, e.g. when the same data are used, or when new data are collected in a resembling experiment, using a resembling sonification algorithm. Similar articles are most of the time written by the same research group, have often the same funding source, and are usually published within a relatively short and homoge-neous time frame. An article can form a project in itself when no similar articles can be found. More rarely, several projects can be tackled within a single article.
We tried to organize the reading of papers associated with a given project chronologically in order to follow and better understand developments and strategic choices. However, because of the backward-looking character of our searching strategy, we often found earlier references to be read at a later stage. These were either added to the group of articles associated with the project currently undergoing the reading process, or simply inserted into the publication database in case they belonged to another project.
The publication database was created according to the process described in the previous subsection in January 2011, encompass-ing therefore articles published in 2010 and before. In order to include more recent projects in the analysis, we repeated the creation process in January 2013 for articles published during the limited period 2011–2012. A total of 8 projects including one work from this period were included in the systematic review, representing 13.3% of the 60 projects. For future updates of the publication database, this operation can be reiterated for any period of interest.
Finally, review articles such as the ones mentioned in Section 2.1 allow both to include additional interesting references and to evaluate the progress state of the publication database.
3.2 Identifying mappings
3.2.1 Criteria for mapping inclusion. Once the publica-tion database was created according to the process presented above, all mappings of physical quantities to sound parameters were identified and considered for future analysis. However, some particular types of mappings were excluded from the analysis a priori.
In the beginning of the systematic review, we chose to consider audification as an absence of mapping, i.e. an absence of design strategy for the sonification system. Therefore we did not include works using audification in our publication database, and we did not count audification among the mappings to extract. This point of view was altered thereafter and we now believe that audification of data can be considered as a direct mapping of any data dimension to an elementary sound pressure level contributing to the creation of a waveform. Auditory graphs [66] were considered too abstract to be included in the analysis, as long as they did not correspond to a concrete sonification example (i.e. explicitly representing a given physical dimension). Although incorporating some data that can be classified as an objective physical dimension, e.g. the position of a cursor on a screen, auditory menus [67] were also judged too abstract to be included in this study.
Since the focus of the analysis was set on the design process of sonification systems, observations posterior to design (i.e. associ-ations between physical and auditory dimensions that had not been consciously planned as part of the design but emerged from the use of the system as unexpected side-effects) were not considered as proper mappings. As an example inspired by a
model-based sonification implemented by Sturm [68], one can consider a set of particles moving in a space subject to given physical laws of motion, each particle producing a pure tone of frequency depending on its velocity. An increase of temperature of the whole system would give rise to a higher perceived pitch of the sound feedback due to an increased overall velocity, but if the sonification design is not specifically mentioning the mapping Temperature?Pitch, the only one to be retained is Velocity? Pitch. Conversely, both should be taken into account if the intention of the sonification designer to make use of this particular behavior of the system is explicitly expressed at the design stage, even if the mapping is indirect. This example shows that this criterion is particularly relevant for model-based sonification, where the ‘‘sound-link variables’’ [69] (the dimensions of the model being directly sonified) are often acting on the sonic result at a low level.
3.2.2 Mapping labels. An interesting aspect of the system-atic review is the possibility to determine which mappings have been assessed as successful, or unsuccessful respectively. In order to track mapping evaluations performed in the considered different projects analyzed, we defined two corresponding labels: ‘‘assessed as good’’ (G) and ‘‘assessed as bad’’ (B). The label G was assigned to a given mapping whose efficiency was found to be significantly better when tested in comparison to other mappings correspond-ing to the sonification of the same physical dimension. The label B was assigned similarly when its efficiency was tested and found to be significantly worse than other mappings, or whenever a given mapping was reported inefficient for performing a given task. It is important to note here that we do not count the ability to perform a task as validation of the efficiency of a mapping if it has not been compared to another mapping. On the other hand, it seems reasonable to consider the inability to perform a task as a proof of its inefficiency.
Another label (F) was used to characterize mappings mentioned as interesting for a future application, but not implemented at the time the work was published.
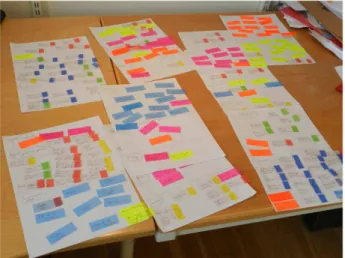
3.2.3 Classification process. Due to the interdisciplinary nature of sonification, we expect many different types of physical quantities to be sonified. We conducted a classification process aimed at gathering similar data under intermediate-level concep-tual dimensions. This process could be described as organizing chaotic information to form categories based on similarity and natural relationships. To this end, we used affinity diagrams, also known as the KJ method, a popular tool used in management and planning since the 1960s [70]. Physical dimensions directly extracted from the projects were written on post-it notes that were grouped by similarity on blank pages (Figure 1). Several clusters emerged and were assigned a label representing an intermediate-level conceptual dimension. For instance, the inter-mediate-level dimension Density encompasses the following lower-level variables: bulk density, population density, density of footsteps, number of people, local blood flow density level, oxygen saturation in arterial blood, water or forest density on a map, local data density, end tidal carbon dioxide concentration measured in respiration, density of He++ ions, neutron density reflecting
material porosity, and spatial period of period-based textured images. The resulting classification, presented in Section 4, is inevitably based on the authors’ interpretation of the data, and therefore incorporates elements of subjectivity. The intermediate-level dimensions were gathered into five high-intermediate-level categories in order to reduce the dependency of the results to this subjectivity. A similar issue occurs with auditory dimensions due to variations in the terminology. We used the same process in the auditory domain as for classifying the physical dimensions, Systematic Review Physical Sonification Mappings
gathering several words corresponding to the same notion in intermediate-level conceptual dimensions, which we grouped subsequently in five higher-level categories.
Arfib et al. [71], defining a theoretical framework for mapping gesture data to sound, make a clear distinction between dimensions corresponding to the perceptual effect on the listener (belonging to the ‘‘sound perceptual space’’) and dimensions relative to ‘‘synthesis model parameters’’. As mentioned in Section 1.1, sonification is indivisible from its purpose, which is to communicate information to a human user. We chose therefore to align our classification with the sound perceptual space, focusing on perceptual effects rather than on sound synthesis techniques. A simple illustration is the distinction between Frequencyand Pitch. Whereas it is well-known that the two are directly related to each other [72], they belong to different spaces in the classification of Arfib et al., being respectively a synthesis model parameter and a dimension of the sound perceptual space. Sonification designers often employ the two terms alternately to describe a given mapping, as if interchangeable. According to our interpretation of those design descriptions, the resulting perceptual effect corre-sponding to the use of either word is most of the time identical. Following our perceptual approach, all the mappings concerned are classified as associating a specific physical dimension with Pitch. In some other cases, however, the distinction is clearly made by the sonification designer and is a well thought-out part of the design. For example, Grond and Dall’Antonia [73] map the distance between two atoms of a molecule to the center frequency of several superimposed resonant filters, which has the effect of modifying the timbre of an earcon rather than its pitch.
Various levels of description are expected to be found in the publication database, depending on the background and interests of the researchers designing the sonification system. For instance, the same mapping effect in the auditory dimension could be described rather approximately as a change in Timbre, more precisely as a change ofBrightness, more specifically as an increase of theFrequency of the spectral centroid, more technically as an increase of theCutoff frequency of a bandpass filterused to synthesize the sound, and so on. That being said, different levels of description can also reflect objective differences in the mapping design. To address this
problem, the classification was built with enough flexibility to incorporate a multi-level hierarchy, taking into account the most detailed level of description available in the projects, for both physical and auditory dimensions.
Another source of disparity is the use of data sharing the same physical nature but on different scales. Gathering the dimensions according to their nature results in physical homogeneity, but also in having extremely different scales stirred together in the same dimension. One can wonder if it is pertinent to consider, for instance, temperature measurements in daily weather records as having the same significance as temperature measured inside a nuclear reactor, or core temperature of a star. The three variables described above belong to the same category of the current classification (Temperature) but could be distinguished at a lower level if the need for a finer distinction emerges in the future.
In light of the foregoing, it appears that the best solution is probably to have a multi-level and multi-scale structure for the classification of both physical and auditory dimensions. We provide an example of each in our current classification of auditory dimensions, further developed in Section 4.3: Spatializa-tion incorporates a detailed multi-level set of subcategories, whereas Duration includes several scales. It should be noted that the aim of the present article is not to present a kind of ultimate classification, if that is ever possible. We shaped our classification by ensuring plasticity, i.e. the possibility to evolve dynamically to adapt to context changes. Context change here can correspond to the apparition of new data categories, or to a hitherto unprecedented discrimination of a data dimension according to different subgroups (e.g. scales). As it turned out, getting a better hindsight of the data resulted in the emergence of more stable categories. We believe that we have reached a relatively steady classification for auditory dimensions and high-level categories in the physical domain. Future developments of the classification could be validated by confrontation with the opinion of researchers from diverse fields, for example using a distributed and cooperative version of the KJ method [74] over the World Wide Web, or by using coding schemes [75]. The latter, combined with inter-coder reliability tests, could yield a more robust validation of current and future classifications.
Presentation of the Data
4.1 Publication database
The publication database currently comprises 739 entries [76]. Sixty projects were analyzed, corresponding to 179 publications referenced in the present article, and are presented in Section 4.4. The remaining 560 entries of the database, selected as potentially interesting but not analyzed yet, can be browsed online.
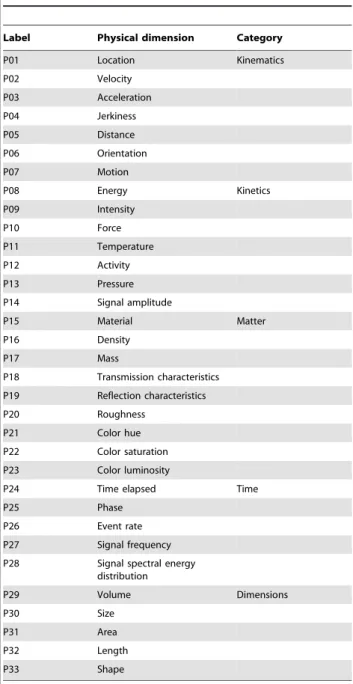
4.2 Sonified physical dimensions
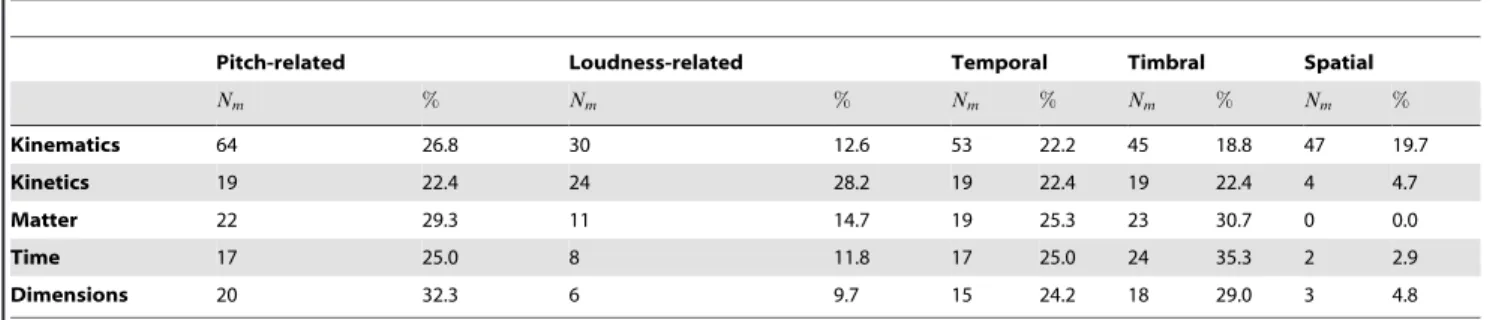
In the domain of sonification mappings, i.e. sonified physical quantities, 33 dimensions emerged from the classification process and are presented in Table 1 along with a label (from P01 to P33) for reference in the remainder of the article. These dimensions, whose names are self-explanatory, are distributed over five high-level categories: kinematics, kinetics, matter, time, and dimensions. Kinematics refers to quantities used to characterize motion and position.Kineticsrefers to quantities linked to the causes of motion, and by extension those related to energy.Matterrefers to properties of the matter.Timerefers to characteristics of a signal in the time-frequency domain. Dimensions refers to geometry of objects and spaces.
Figure 1. The classification was elaborated through a brain-storming using affinity diagrams. Each low-level dimension was written on a post-it note. The notes were then moved to form clusters based on their degree of similarity, constituting the intermediate-level dimensions used to reference mappings in this systematic review for both physical and auditory domains.
doi:10.1371/journal.pone.0082491.g001
Systematic Review Physical Sonification Mappings
4.3 Auditory dimensions used in sonification
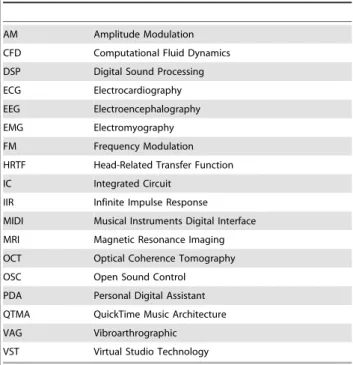
In the codomain of sonification mappings, i.e. sound parame-ters, 30 dimensions emerged from the classification process and are presented in Table 2 along with a label (from A01 to A30) for reference in the remainder of the article. These dimensions are distributed over five high-level categories: Pitch-related, Timbral, Loudness-related,Spatial, andTemporal. Six dimensions belong to at least two high-level categories. Most of the names of the dimensions are self-explanatory. In the following we describe those requiring further clarification.
Timbre is usually defined as comprising all the characteristics allowing us to distinguish between two sounds having identical pitch and loudness. Because this is a negative definition, it often appears judicious to describe a mapping more specifically than
Table 1.Intermediate-level conceptual dimensions in the physical domain.
Label Physical dimension Category
P01 Location Kinematics
P02 Velocity
P03 Acceleration
P04 Jerkiness
P05 Distance
P06 Orientation
P07 Motion
P08 Energy Kinetics
P09 Intensity
P10 Force
P11 Temperature
P12 Activity
P13 Pressure
P14 Signal amplitude
P15 Material Matter
P16 Density
P17 Mass
P18 Transmission characteristics P19 Reflection characteristics
P20 Roughness
P21 Color hue
P22 Color saturation
P23 Color luminosity
P24 Time elapsed Time
P25 Phase
P26 Event rate
P27 Signal frequency
P28 Signal spectral energy
distribution
P29 Volume Dimensions
P30 Size
P31 Area
P32 Length
P33 Shape
List of physical dimensions sonified in the articles from the publication database, arranged according to their corresponding high-level category. doi:10.1371/journal.pone.0082491.t001
Table 2.Intermediate-level conceptual dimensions in the auditory domain.
Label Auditory dimension Category
A01 Pitch Pitch-related
A02 Pitch range
A03 Timbre Timbral
A04 Instrumentation
A05 Polyphonic content
A06 Voice gender
A07 Allophone
A08 Spectral power
A09 Amplitude of harmonic A10 Frequency of harmonic
A11 Roughness
A12 Brightness
A13 Center frequency of filter
A14 Saliency
A15 Loudness Loudness-related
A16 Dynamic loudness
A17 Spatialization Spatial
?A17?1 Stereo panning
?A17?2 Multichannel panning
?A17?3 Vector base amplitude panning
?A17?4 Head-related transfer function
?A17?5 Ambisonics
?A17?6 Interaural time difference
?A17?7 Interaural amplitude difference
?A17?8 Interaural frequency difference
?A17?9 Non-specified spatialization method
A18 Doppler effect
A19 Tempo Temporal
A20 Duration
?A201 Rhythmic duration ?A202 Event duration ?A203 Ambient duration ?A204 Non-specified duration scale A21 Sequential position
A22 Melody lead
A23 Articulation
A24 Decay time
A25 Melody Pitch-related, Temporal
A26 Harmony Pitch-related, Timbral
A27 Chord progression Pitch-related, Timbral,
Temporal
A28 Spectral duration Timbral, Temporal
A29 Reverberation time Spatial, Temporal
A30 Performance activity level Loudness-related, Temporal
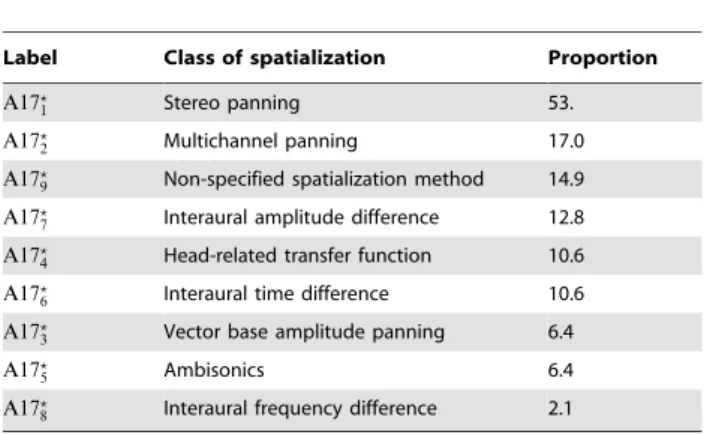
List of auditory dimensions used for sonification in the articles from the publication database, arranged according to their corresponding high-level category. Dimensions belonging to more than one high-level category are displayed at the bottom of the table. The multi-class dimension Spatialization is distinguished from the others using a star (?) in its label, which also incorporates an index
differentiating the different subclasses. Similarly, the label of the multi-scale dimension Duration incorporates an index differenciating the different scales. doi:10.1371/journal.pone.0082491.t002
Systematic Review Physical Sonification Mappings
using the term ‘‘timbre’’. The role of the high-level category Timbral (labels A03 to A14) is to cover this usual definition of timbre, whereas the intermediate-level dimension called Timbre (A03) in our classification corresponds to all the cases where no further precision on the mapping was given. Instrumentation (A04) refers to cases where musical instruments change depending on the sonified data, whereas Polyphonic content (A05) refers to the number of parts in a polyphonic piece, i.e. the number of instruments rendered in the playback of the piece. Spectral power (A08) encompasses operations performed on the sound spectrum that are not covered by the remaining dimensions listed in the high-level categoryTimbral.
Spatialization (A17) corresponds to the position of a sound source in space and time. Since it is often described through several interrelated aspects, it constitutes a good illustration of multi-level classification. These aspects include equipment (e.g. binaural earphones, stereo loudspeakers, array of loudspeakers), technique (e.g. Ambisonics, Vector Base Amplitude Panning, Wave Field Synthesis), as well as quantities centered on the perceptual effect on the listener (e.g. Interaural amplitude difference, Interaural time difference, Interaural frequency differ-ence), or involving both technical and perceptual aspects (e.g. Head-related transfer function). While enumerated in Table 3, the different aspects are considered as a single mapping of the particular physical dimension to Spatialization. This applies even to cases where different aspects result in divergent assessments of efficiency, materialized by different mapping labels as described in Section 3.2.2. For instance, one could map the orientation of the listener towards a sounding object either to Interaural Time Difference (A17?
6) or Interaural Amplitude Difference (A17?7) with
varying success. However, from the point of view of the sonification designer, the goal remains unchanged: it is to map Orientation (P06) to Spatialization (A17).
Tempo (A19) should be understood in accordance with its definition for the MIDI format: it represents a high-level control on the playback speed independent of the density of sound events. Duration (A20) corresponds to distance on the time axis, i.e. the time elapsed between two events. The quantity usually referred to as ‘‘tone duration’’ corresponds to the time elapsed between a tone onset and its offset. Another quantity commonly used in the study of music performance is Inter-Onset Interval (IOI), defined as the time elapsed between two successive tone onsets. Tone duration and IOI are therefore included in the same category. The reason for not distinguishing between these two quantities in our classification originates in the lack of precision found in many publications describing mappings, often mentioning the ‘‘dura-tion’’ of sound stimuli without specifying clearly if it corresponds to tone duration or IOI.
Duration was chosen to illustrate the multi-scale classification due to the dependency of the perception of duration to time scale. According to Sethares [77], sonic events occurring at different time scales activate different cognitive structures calling on different types of memory (echoic, short-term, or long-term memory). This disparity of perceptual impressions was taken into account by Saue [78], who selected four time scales to be used in the context of sonification of large datasets: spectral, rhythmic, event, and ambient. These time scales were used to derive four elements of our classification.
The first element based on time scale is Spectral duration, corresponding to the smallest time scale (less than 50 ms). Sethares describes how echoic memory operates at this scale, performing the ‘‘fusion’’ of sonic events into coherent cognitive structures such as pitch and timbre. For his part, Saue explains that these sonic events are perceived as ‘‘variations in timbre and localization’’. For
reasons exposed above, in our bottom-up approach to classify auditory dimensions, timbre is often presented indirectly by sonification designers. Timbre variations are often described through performing low-level manipulation of the signal, or assembling temporal elements belonging to the spectral time scale (e.g. grain duration in granular synthesis). On the other hand, both spatialization and pitch were found to be described more explicitly by sonification designers. As a consequence, Spectral duration was represented by an auditory dimension in itself (A28) belonging to the high-level categories Temporal (by essence) and Timbral (by design).
The three other elements based on time scale constitute the multi-scale dimension Duration (A20): Rhythmic duration (A201)
corresponds to a duration comprised between 100 ms and 2 s, calling on short-term memory, and described by Saue as ‘‘perceived as relative changes to events inside auditory streams’’. Event duration (A202) corresponds to a duration over 2 s, calling on long-term
memory, and described by Saue as ‘‘perceived as irregularly spaced singular events’’ and by Sethares as ‘‘disconnected events’’. Ambient duration (A203) refers to dynamic continuous auditory streams
that are not perceived as events but, according to Saue, ‘‘as always present (or not perceived at all); a state of no-change or slow change’’. Finally, similarly to the case of a multi-class dimension, a last element has to be added to handle cases where no specific scale is mentioned (A204).
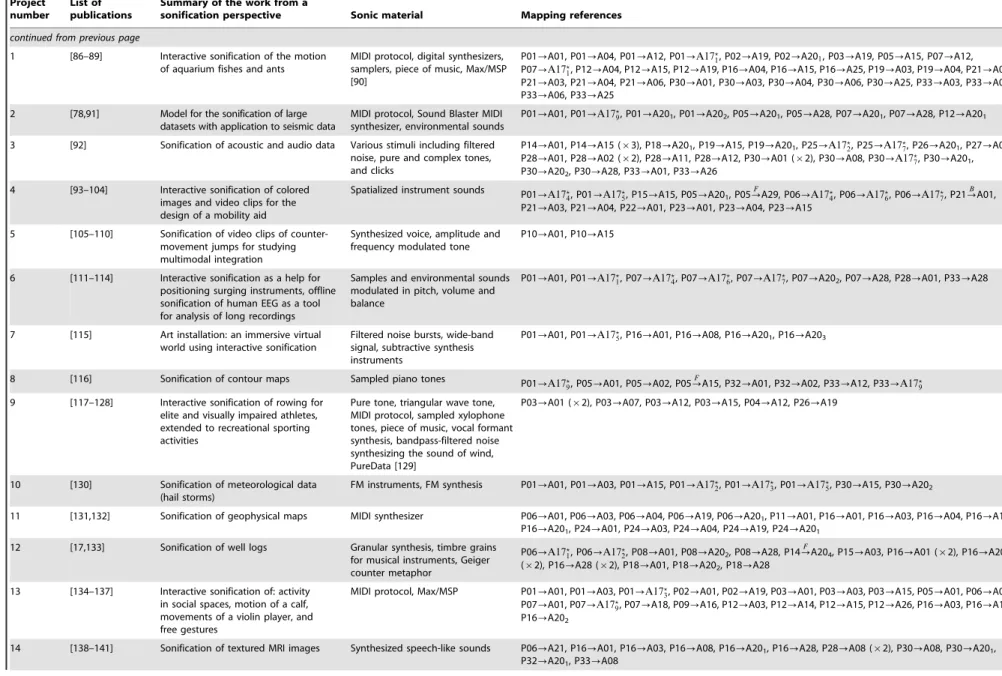
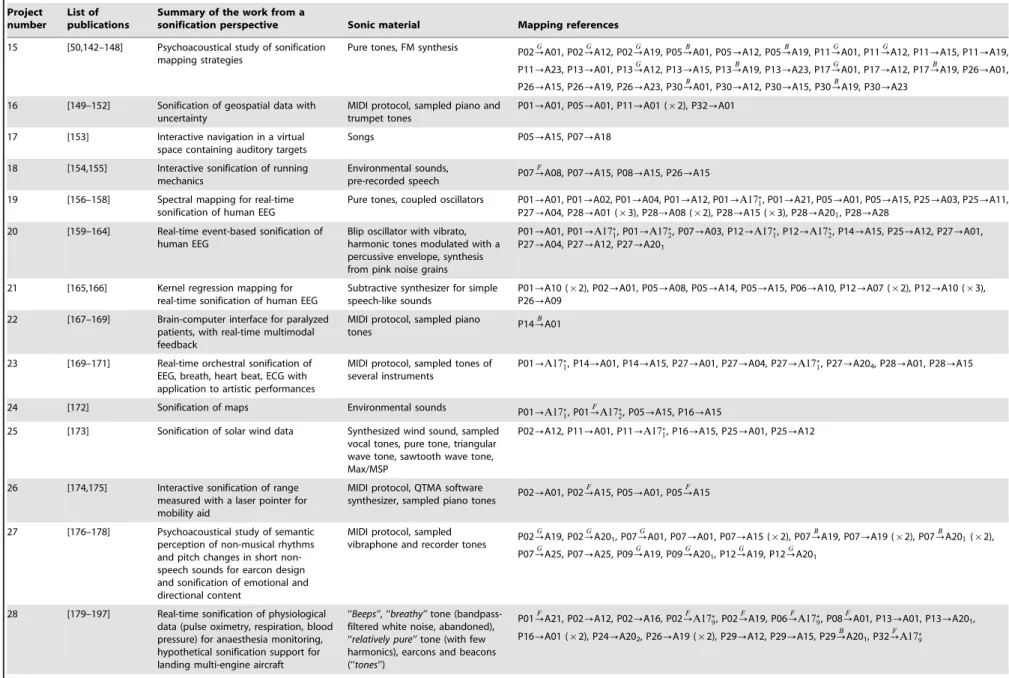
4.4 Description of the projects
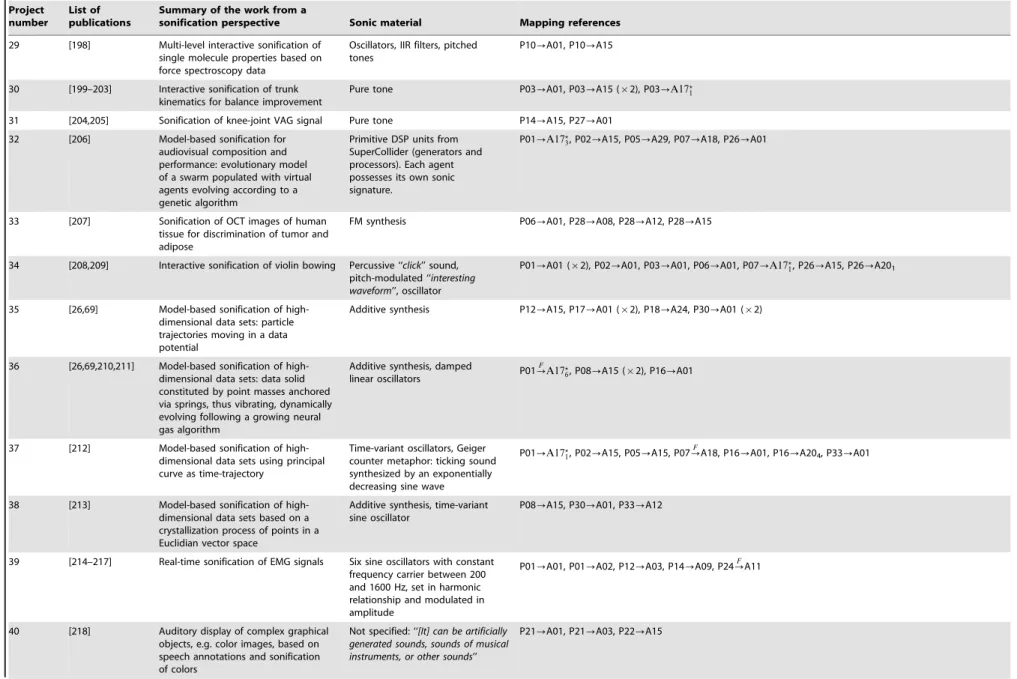
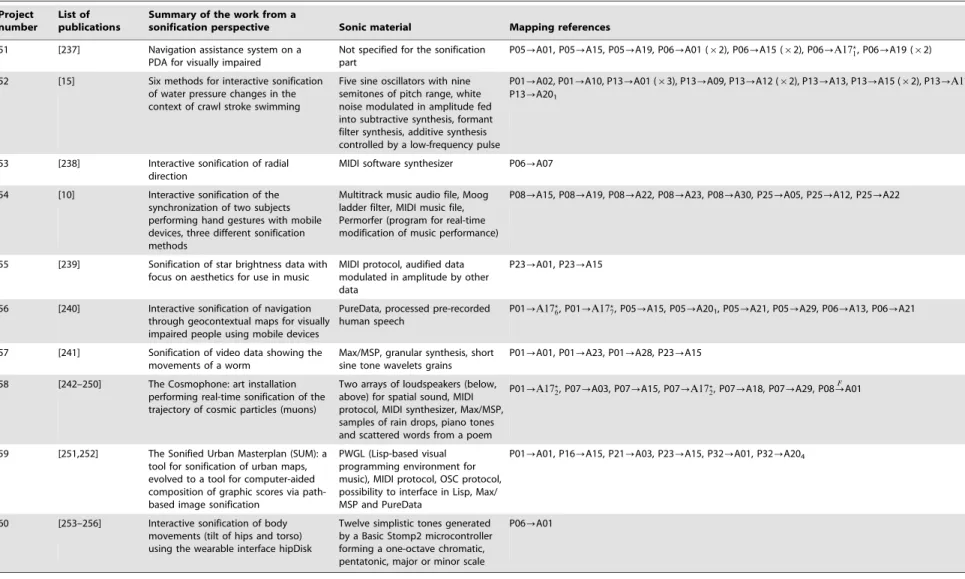
The sixty projects analyzed in this systematic review are presented in Table 3. For each project, we provide a brief description of the work through the prism of sonification, focusing on this particular aspect rather than on the own research questions of the researchers. Interactivity, an important characteristic of a sonification system that has been highlighted by Hunt and Hermann [79], was characterized by the use of the words ‘‘interactive’’ and ‘‘real-time’’ in the description. We also describe the sonic material that was used, ranging from detailed descrip-tions of the sound synthesis to software and hardware platforms, in order to get a sense of the tools used by sonification researchers, a concern that was shared by Bearman and Brown in their recent review study [43]. Finally, the list of mappings identified according to the process described in Section 3.2 is displayed. The list of abbreviations used in Table 3 is presented in Table 4.
Results and Discussion
5.1 Mapping frequencies
5.1.1 Expectations. The principal measure considered in the systematic review is the frequency of use of mappings. In a preliminary study [80], we formulated three assumptions to be verified for a larger number of sonification projects. These assumptions, based on 54 publications representing 21 projects, constitute our preliminary hypotheses concerning sonification mappings and are summarized hereunder.
Hypothesis 1. A large proportion of sonification mappings follow the logic of ecological perception. Mappings are often performing a sort of simulation of underlying physical phenomena, which can be implemented either directly or metaphorically. These natural associations between sound and its meaning regarding physics were called ‘‘universal relationships’’ by Hermann and Ritter [69] and depicted as ‘‘deeply engrained in the way we— usually subconsciously—pick up meaning from sound events’’.
Hypothesis 2. Pitch is by far the most used auditory
dimension in sonification mappings. Typically, the design process for a sonification system often starts by mapping the most Systematic Review Physical Sonification Mappings
Table 3.Description of the projects analyzed in this study.
Project number
List of publications
Summary of the work from a
sonification perspective Sonic material Mapping references
continued from previous page
1 [86–89] Interactive sonification of the motion of aquarium fishes and ants
MIDI protocol, digital synthesizers, samplers, piece of music, Max/MSP [90]
P01?A01, P01?A04, P01?A12, P01?A17?1, P02?A19, P02?A201, P03?A19, P05?A15, P07?A12,
P07?A17?1, P12?A04, P12?A15, P12?A19, P16?A04, P16?A15, P16?A25, P19?A03, P19?A04, P21?A01, P21?A03, P21?A04, P21?A06, P30?A01, P30?A03, P30?A04, P30?A06, P30?A25, P33?A03, P33?A04, P33?A06, P33?A25
2 [78,91] Model for the sonification of large datasets with application to seismic data
MIDI protocol, Sound Blaster MIDI synthesizer, environmental sounds
P01?A01, P01?A17?9, P01?A201, P01?A202, P05?A201, P05?A28, P07?A201, P07?A28, P12?A201
3 [92] Sonification of acoustic and audio data Various stimuli including filtered noise, pure and complex tones, and clicks
P14?A01, P14?A15 (|3), P18?A201, P19?A15, P19?A201, P25?A17?2, P25?A17?7, P26?A201, P27?A01, P28?A01, P28?A02 (|2), P28?A11, P28?A12, P30?A01 (|2), P30?A08, P30?A17?7, P30?A201,
P30?A202, P30?A28, P33?A01, P33?A26
4 [93–104] Interactive sonification of colored images and video clips for the design of a mobility aid
Spatialized instrument sounds P01
?A17?4, P01?A17?5, P15?A15, P05?A201, P05?FA29, P06?A17?4, P06?A17?6, P06?A17?7, P21?BA01, P21?A03, P21?A04, P22?A01, P23?A01, P23?A04, P23?A15
5 [105–110] Sonification of video clips of counter-movement jumps for studying multimodal integration
Synthesized voice, amplitude and frequency modulated tone
P10?A01, P10?A15
6 [111–114] Interactive sonification as a help for positioning surging instruments, offline sonification of human EEG as a tool for analysis of long recordings
Samples and environmental sounds modulated in pitch, volume and balance
P01?A01, P01?A17?1, P07?A17?4, P07?A176?, P07?A17?7, P07?A202, P07?A28, P28?A01, P33?A28
7 [115] Art installation: an immersive virtual world using interactive sonification
Filtered noise bursts, wide-band signal, subtractive synthesis instruments
P01?A01, P01?A17?5, P16?A01, P16?A08, P16?A201, P16?A203
8 [116] Sonification of contour maps Sampled piano tones P01
?A17?9, P05?A01, P05?A02, P05?FA15, P32?A01, P32?A02, P33?A12, P33?A17?9
9 [117–128] Interactive sonification of rowing for elite and visually impaired athletes, extended to recreational sporting activities
Pure tone, triangular wave tone, MIDI protocol, sampled xylophone tones, piece of music, vocal formant synthesis, bandpass-filtered noise synthesizing the sound of wind, PureData [129]
P03?A01 (|2), P03?A07, P03?A12, P03?A15, P04?A12, P26?A19
10 [130] Sonification of meteorological data (hail storms)
FM instruments, FM synthesis P01?A01, P01?A03, P01?A15, P01?A17?2, P01?A17?3, P01?A17?5, P30?A15, P30?A202
11 [131,132] Sonification of geophysical maps MIDI synthesizer P06?A01, P06?A03, P06?A04, P06?A19, P06?A201, P11?A01, P16?A01, P16?A03, P16?A04, P16?A19, P16?A201, P24?A01, P24?A03, P24?A04, P24?A19, P24?A201
12 [17,133] Sonification of well logs Granular synthesis, timbre grains for musical instruments, Geiger counter metaphor
P06?A17?1, P06?A17?2, P08?A01, P08?A202, P08?A28, P14?
F
A204, P15?A03, P16?A01 (|2), P16?A202
(|2), P16?A28 (|2), P18?A01, P18?A202, P18?A28
13 [134–137] Interactive sonification of: activity in social spaces, motion of a calf, movements of a violin player, and free gestures
MIDI protocol, Max/MSP P01?A01, P01?A03, P01?A17?3, P02?A01, P02?A19, P03?A01, P03?A03, P03?A15, P05?A01, P06?A01, P07?A01, P07?A17?9, P07?A18, P09?A16, P12?A03, P12?A14, P12?A15, P12?A26, P16?A03, P16?A16,
P16?A202
14 [138–141] Sonification of textured MRI images Synthesized speech-like sounds P06?A21, P16?A01, P16?A03, P16?A08, P16?A201, P16?A28, P28?A08 (|2), P30?A08, P30?A201,
P32?A201, P33?A08
Systematic
Review
Physical
Sonificatio
n
Mappin
gs
PLOS
ONE
|
www.ploson
e.org
9
December
2013
|
Volume
8
|
Issue
12
|
Table 3.Cont.
Project number
List of publications
Summary of the work from a
sonification perspective Sonic material Mapping references
15 [50,142–148] Psychoacoustical study of sonification mapping strategies
Pure tones, FM synthesis P02 ?
G
A01, P02?
G
A12, P02?
G
A19, P05?
B
A01, P05?A12, P05?
B
A19, P11?
G
A01, P11?
G
A12, P11?A15, P11?A19,
P11?A23, P13?A01, P13?GA12, P13?A15, P13?BA19, P13?A23, P17?GA01, P17?A12, P17?BA19, P26?A01,
P26?A15, P26?A19, P26?A23, P30?
B
A01, P30?A12, P30?A15, P30?
B
A19, P30?A23
16 [149–152] Sonification of geospatial data with uncertainty
MIDI protocol, sampled piano and trumpet tones
P01?A01, P05?A01, P11?A01 (|2), P32?A01
17 [153] Interactive navigation in a virtual space containing auditory targets
Songs P05?A15, P07?A18
18 [154,155] Interactive sonification of running mechanics
Environmental sounds,
pre-recorded speech P07?
F
A08, P07?A15, P08?A15, P26?A15
19 [156–158] Spectral mapping for real-time sonification of human EEG
Pure tones, coupled oscillators P01?A01, P01?A02, P01?A04, P01?A12, P01?A17?
1, P01?A21, P05?A01, P05?A15, P25?A03, P25?A11,
P27?A04, P28?A01 (|3), P28?A08 (|2), P28?A15 (|3), P28?A201, P28?A28
20 [159–164] Real-time event-based sonification of human EEG
Blip oscillator with vibrato, harmonic tones modulated with a percussive envelope, synthesis from pink noise grains
P01?A01, P01?A17?1, P01?A17?2, P07?A03, P12?A17?1, P12?A17?2, P14?A15, P25?A12, P27?A01, P27?A04, P27?A12, P27?A201
21 [165,166] Kernel regression mapping for real-time sonification of human EEG
Subtractive synthesizer for simple speech-like sounds
P01?A10 (|2), P02?A01, P05?A08, P05?A14, P05?A15, P06?A10, P12?A07 (|2), P12?A10 (|3), P26?A09
22 [167–169] Brain-computer interface for paralyzed patients, with real-time multimodal feedback
MIDI protocol, sampled piano
tones P14?
B
A01
23 [169–171] Real-time orchestral sonification of EEG, breath, heart beat, ECG with application to artistic performances
MIDI protocol, sampled tones of several instruments
P01?A17?
1, P14?A01, P14?A15, P27?A01, P27?A04, P27?A17?1, P27?A204, P28?A01, P28?A15
24 [172] Sonification of maps Environmental sounds P01
?A17?1, P01?FA17?2, P05?A15, P16?A15 25 [173] Sonification of solar wind data Synthesized wind sound, sampled
vocal tones, pure tone, triangular wave tone, sawtooth wave tone, Max/MSP
P02?A12, P11?A01, P11?A17?1, P16?A15, P25?A01, P25?A12
26 [174,175] Interactive sonification of range measured with a laser pointer for mobility aid
MIDI protocol, QTMA software
synthesizer, sampled piano tones P02?A01, P02?
F
A15, P05?A01, P05?
F
A15
27 [176–178] Psychoacoustical study of semantic perception of non-musical rhythms and pitch changes in short non-speech sounds for earcon design and sonification of emotional and directional content
MIDI protocol, sampled
vibraphone and recorder tones P02?
G
A19, P02?
G
A201, P07?
G
A01, P07?A01, P07?A15 (|2), P07?
B
A19, P07?A19 (|2), P07?
B
A201(|2),
P07?GA25, P07?A25, P09?GA19, P09?GA201, P12?GA19, P12?GA201
28 [179–197] Real-time sonification of physiological data (pulse oximetry, respiration, blood pressure) for anaesthesia monitoring, hypothetical sonification support for landing multi-engine aircraft
‘‘Beeps’’, ‘‘breathy’’tone (bandpass-filtered white noise, abandoned), ‘‘relatively pure’’tone (with few harmonics), earcons and beacons (‘‘tones’’)
P01?FA21, P02?A12, P02?A16, P02?FA17?9, P02?FA19, P06?FA17?9, P08?FA01, P13?A01, P13?A201,
P16?A01 (|2), P24?A202, P26?A19 (|2), P29?A12, P29?A15, P29?
B
A201, P32?
F
A17?
9
Systematic
Review
Physical
Sonificatio
n
Mappin
gs
PLOS
ONE
|
www.ploson
e.org
10
December
2013
|
Volume
8
|
Issue
12
|
Table 3.Cont.
Project number
List of publications
Summary of the work from a
sonification perspective Sonic material Mapping references
29 [198] Multi-level interactive sonification of single molecule properties based on force spectroscopy data
Oscillators, IIR filters, pitched tones
P10?A01, P10?A15
30 [199–203] Interactive sonification of trunk kinematics for balance improvement
Pure tone P03?A01, P03?A15 (|2), P03?A17?1
31 [204,205] Sonification of knee-joint VAG signal Pure tone P14?A15, P27?A01
32 [206] Model-based sonification for audiovisual composition and performance: evolutionary model of a swarm populated with virtual agents evolving according to a genetic algorithm
Primitive DSP units from SuperCollider (generators and processors). Each agent possesses its own sonic signature.
P01?A17?3, P02?A15, P05?A29, P07?A18, P26?A01
33 [207] Sonification of OCT images of human tissue for discrimination of tumor and adipose
FM synthesis P06?A01, P28?A08, P28?A12, P28?A15
34 [208,209] Interactive sonification of violin bowing Percussive ‘‘click’’ sound, pitch-modulated ‘‘interesting waveform’’, oscillator
P01?A01 (|2), P02?A01, P03?A01, P06?A01, P07?A17?
1, P26?A15, P26?A201
35 [26,69] Model-based sonification of high-dimensional data sets: particle trajectories moving in a data potential
Additive synthesis P12?A15, P17?A01 (|2), P18?A24, P30?A01 (|2)
36 [26,69,210,211] Model-based sonification of high-dimensional data sets: data solid constituted by point masses anchored via springs, thus vibrating, dynamically evolving following a growing neural gas algorithm
Additive synthesis, damped
linear oscillators P01?
F
A17?
6, P08?A15 (|2), P16?A01
37 [212] Model-based sonification of high-dimensional data sets using principal curve as time-trajectory
Time-variant oscillators, Geiger counter metaphor: ticking sound synthesized by an exponentially decreasing sine wave
P01?A17?1, P02?A15, P05?A15, P07?FA18, P16?A01, P16?A204, P33?A01
38 [213] Model-based sonification of high-dimensional data sets based on a crystallization process of points in a Euclidian vector space
Additive synthesis, time-variant sine oscillator
P08?A15, P30?A01, P33?A12
39 [214–217] Real-time sonification of EMG signals Six sine oscillators with constant frequency carrier between 200 and 1600 Hz, set in harmonic relationship and modulated in amplitude
P01?A01, P01?A02, P12?A03, P14?A09, P24?
F
A11
40 [218] Auditory display of complex graphical objects, e.g. color images, based on speech annotations and sonification of colors
Not specified: ‘‘[It] can be artificially generated sounds, sounds of musical instruments, or other sounds’’
P21?A01, P21?A03, P22?A15
Systematic
Review
Physical
Sonificatio
n
Mappin
gs
PLOS
ONE
|
www.ploson
e.org
11
December
2013
|
Volume
8
|
Issue
12
|
Table 3.Cont.
Project number
List of publications
Summary of the work from a
sonification perspective Sonic material Mapping references
41 [219] Interactive sonification of segmented two-dimensional images for the purpose of gaining spatial awareness of the image structure
VST instruments (abandoned), FM synthesis, AM synthesis, filters, square wave tone
P01?A01, P01?A17?1, P05?A13, P05?A204, P07?A01, P07?A17?1, P07?A25, P24?A13, P31?A01, P32?A11, P32?A15, P33?A02, P33?A19, P33?A25
42 [220–222] Interactive audiovisual biofeedback system for stroke rehabilitation
Musical sounds, MIDI protocol, sampler, Max/MSP
P01?A01, P01?A02 (|2), P01?A03, P01?A04 (|2), P01?A08, P01?A15, P01?A201(|2), P01?A26, P02?A201, P04?A201, P05?A27, P07?A27, P25?A27
43 [19,223–227] Mobility aid for the blind using ultrasonic echolocation, first monaural (Sonic Torch) then binaural (Sonic Glasses), enabling the detection of objects and their perceptualization within a range of 0 to 6 m
Echo of an ultrasonic sinusoidal wave modulated in frequency by a sawtooth wave, heterodyned with the original signal and rescaled to audible frequency (resulting in practice in a pitched tone) interrupted by short silences (10% of the time). This method was first implemented with pulses instead of frequency modulation, and was found to be much less successful.
P05?A01, P06?
B
A17?
6, P06?A17?7, P06?
B
A17?
8, P20?A08
44 [228] Device converting words on a computer to phonemes via brightness level in order to translate contemporary news headlines to dadaist poems
Phonemes from SpeakJet synthesizer IC
P23?A08
45 [229] Interactive sonification of three physiological quantities for artistic performance (‘‘biomusic’’)
Max/MSP, OSC protocol, filter-enhanced audification, unvoiced subtractive synthesis (filtered noise, flange effect), voiced subtractive synthesis (sawtooth band-limited signal)
P11?A13, P11?A15, P29?A01, P29?A13 (|2), P29?A15 (|2)
46 [230] Interactive sonification of facial movements and expressions
PureData, cosine wave oscillator, sweeping filter, sampled sounds, additive synthesis
P07?A01 (|2), P07?A12
47 [73] Sonification utility for molecules (SUMO) illustrated by the case of amino acids and B-factors
SuperCollider, OSC protocol, resonant filters (Klank, Formlet) implementing earcons
P01?A01, P01?A13, P01?A17?1, P01?A21, P05?A13, P05?A17?1, P05?A21
48 [231] Interactive sonification of diverse information related to a mobile device (smartphone), including a model of virtual balls anchored via springs, bouncing inside a box
Sample banks of different impact sounds between various materials
P01?A17?1, P08?A15, P17?A01
49 [232,233] Interactive sonification of CFD simulations for computational steering
Max/MSP, filtered white and pink noise to simulate the sound of wind, combinations of pure tones
P01?A17?1(|2), P02?A01, P02?A12, P02?A13, P02?A15, P05?A01, P05?A15, P06?A15, P06?A26
50 [20,234–236] iSonic: a tool for interactive sonification of georeferenced data on choropleth maps for visually impaired users
Java MIDI sounds: instruments (strings, piano) playing scales, spatial sound server for use of generic HRTF, prerecorded samples
P01?BA01, P01?A17?1, P01?A17?4, P01?BA17?4, P01?A21, P16?A01, P26?A204
Systematic
Review
Physical
Sonificatio
n
Mappin
gs
PLOS
ONE
|
www.ploson
e.org
12
December
2013
|
Volume
8
|
Issue
12
|
Table 3.Cont.
Project number
List of publications
Summary of the work from a
sonification perspective Sonic material Mapping references
51 [237] Navigation assistance system on a PDA for visually impaired
Not specified for the sonification part
P05?A01, P05?A15, P05?A19, P06?A01 (|2), P06?A15 (|2), P06?A17?1, P06?A19 (|2)
52 [15] Six methods for interactive sonification of water pressure changes in the context of crawl stroke swimming
Five sine oscillators with nine semitones of pitch range, white noise modulated in amplitude fed into subtractive synthesis, formant filter synthesis, additive synthesis controlled by a low-frequency pulse
P01?A02, P01?A10, P13?A01 (|3), P13?A09, P13?A12 (|2), P13?A13, P13?A15 (|2), P13?A17?1(|2),
P13?A201
53 [238] Interactive sonification of radial direction
MIDI software synthesizer P06?A07
54 [10] Interactive sonification of the synchronization of two subjects performing hand gestures with mobile devices, three different sonification methods
Multitrack music audio file, Moog ladder filter, MIDI music file, Permorfer (program for real-time modification of music performance)
P08?A15, P08?A19, P08?A22, P08?A23, P08?A30, P25?A05, P25?A12, P25?A22
55 [239] Sonification of star brightness data with focus on aesthetics for use in music
MIDI protocol, audified data modulated in amplitude by other data
P23?A01, P23?A15
56 [240] Interactive sonification of navigation through geocontextual maps for visually impaired people using mobile devices
PureData, processed pre-recorded human speech
P01?A17?6, P01?A17?7, P05?A15, P05?A201, P05?A21, P05?A29, P06?A13, P06?A21
57 [241] Sonification of video data showing the movements of a worm
Max/MSP, granular synthesis, short sine tone wavelets grains
P01?A01, P01?A23, P01?A28, P23?A15
58 [242–250] The Cosmophone: art installation performing real-time sonification of the trajectory of cosmic particles (muons)
Two arrays of loudspeakers (below, above) for spatial sound, MIDI protocol, MIDI synthesizer, Max/MSP, samples of rain drops, piano tones and scattered words from a poem
P01?A17?2, P07?A03, P07?A15, P07?A17?2, P07?A18, P07?A29, P08?
F
A01
59 [251,252] The Sonified Urban Masterplan (SUM): a tool for sonification of urban maps, evolved to a tool for computer-aided composition of graphic scores via path-based image sonification
PWGL (Lisp-based visual programming environment for music), MIDI protocol, OSC protocol, possibility to interface in Lisp, Max/ MSP and PureData
P01?A01, P16?A15, P21?A03, P23?A15, P32?A01, P32?A204
60 [253–256] Interactive sonification of body movements (tilt of hips and torso) using the wearable interface hipDisk
Twelve simplistic tones generated by a Basic Stomp2 microcontroller forming a one-octave chromatic, pentatonic, major or minor scale
P06?A01
Description of the projects analyzed in this study including their corresponding list of publications, sonic material used, and identified mappings between physical (P) and auditory (A) dimensions. Mappings are referenced using the labels defined in Tables 1 and 2. Mapping labels (G, B, F) described in Section 3.2.2 are displayed over the mapping arrows. Multiple occurrences of the same mapping identified within the same project are indicated in parenthesis following the concerned mapping reference. Abbreviations used in this table are listed in Table 4.
doi:10.1371/journal.pone.0082491.t003
Systematic
Review
Physical
Sonificatio
n
Mappin
gs
PLOS
ONE
|
www.ploson
e.org
13
December
2013
|
Volume
8
|
Issue
12
|