www.atmos-chem-phys.net/16/6609/2016/ doi:10.5194/acp-16-6609-2016
© Author(s) 2016. CC Attribution 3.0 License.
Effectiveness of replacing catalytic converters in LPG-fueled
vehicles in Hong Kong
Xiaopu Lyu1, Hai Guo1, Isobel J. Simpson2, Simone Meinardi2, Peter K. K. Louie3, Zhenhao Ling4, Yu Wang1, Ming Liu1, Connie W. Y. Luk3, Nan Wang5, and Donald R. Blake2
1Department of Civil and Environmental Engineering, The Hong Kong Polytechnic University, Hong Kong 2Department of Chemistry, University of California at Irvine, Irvine, CA, USA
3Environmental Protection Department, Hong Kong Special Administrative Region, Hong Kong 4School of Atmospheric Sciences, Sun Yat-sen University, Guangzhou, China
5Guangdong Provincial Key Laboratory of Regional Numerical Weather Prediction,
Institute of Tropical and Marine Meteorology, Guangzhou, China Correspondence to:Hai Guo ([email protected])
Received: 6 October 2015 – Published in Atmos. Chem. Phys. Discuss.: 21 December 2015 Revised: 29 March 2016 – Accepted: 11 May 2016 – Published: 31 May 2016
Abstract. Many taxis and public buses are powered by liq-uefied petroleum gas (LPG) in Hong Kong. With more ve-hicles using LPG, they have become the major contribu-tor to ambient volatile organic compounds (VOCs) in Hong Kong. An intervention program which aimed to reduce the emissions of VOCs and nitrogen oxides (NOx)from LPG-fueled vehicles was implemented by the Hong Kong govern-ment in September 2013. Long-term real-time measuregovern-ments indicated that the program was remarkably effective in re-ducing LPG-related VOCs, NOx and nitric oxide (NO) in the atmosphere. Receptor modeling results further revealed that propane, propene, i-butane, n-butane and NO in LPG-fueled vehicle exhaust emissions decreased by 40.8±0.1, 45.7±0.2, 35.7±0.1, 47.8±0.1 and 88.6±0.7 %, respec-tively, during the implementation of the program. In contrast, despite the reduction of VOCs and NOx, O3 following the
program increased by 0.40±0.03 ppbv (∼5.6 %). The LPG-fueled vehicle exhaust was generally destructive to OH and HO2. However, the destruction effect weakened for OH and
it even turned to positive contribution to HO2during the
pro-gram. These changes led to the increases of OH, HO2and
HO2/OH ratio, which might explain the positive O3
incre-ment. Analysis of O3–VOCs–NOxsensitivity in ambient air indicated VOC-limited regimes in the O3 formation before
and during the program. Moreover, a maximum reduction percentage of NOx(i.e., 69 %) and the lowest reduction ra-tio of VOCs/NOx(i.e., 1.1) in LPG-fueled vehicle exhaust
were determined to give a zero O3increment. The findings
are of great help to future formulation and implementation of control strategies on vehicle emissions in Hong Kong, and could be extended to other regions in China and around the world.
1 Introduction
Vehicular exhaust is a major source of air pollutants such as particulate matter (PM), volatile organic compounds (VOCs) and trace gases including carbon monoxide (CO), carbon dioxide (CO2), sulfur dioxide (SO2) and nitrogen oxides
(NOx)(Xie et al., 2003; Barletta et al., 2002; Ruellan and Cachier, 2001). Apart from primary pollutants, secondary pollutants formed from vehicular exhausts, i.e., ozone (O3)
and secondary organic aerosols (SOAs), are of high concern due to their detrimental effects on atmospheric environment and human health (Ciccone et al., 1998).
Fuel substitution is a universal and effective method to constrain vehicular emissions. As relatively clean energy, liquefied petroleum gas (LPG), has been widely used ei-ther alone or combined with petrol and diesel (Lau et al., 2011; Lai et al., 2009; Gamas et al., 1999), for the benefit of emission reduction of CO2, fine PM and VOCs (Chikhi
composi-tion and driving speed all influence the emissions of air pol-lutants (Schifter et al., 2000; Gamas et al., 1999). Therefore, regular on-site measurements are necessary to monitor traf-fic emission profiles and rates. Although LPG is a relatively clean fuel, the emission of LPG-related VOCs (i.e., propane, propene andn- andi-butanes) from evaporation and incom-plete combustion cannot be neglected. For example, source apportionment analysis indicated that LPG accounted for a considerable percentage of ambient VOCs in Guangzhou (8–16 %) (Liu et al., 2008) and Hong Kong (32.6±5.8 %) (Ou et al., 2015). Furthermore, the LPG-related VOCs can contribute to O3formation and cause photochemical smog.
Blake and Rowland (1995) emphasized the importance of LPG leakage in OH reactivity and O3 formation in urban
Mexico. Farmer et al. (2011) reported that the increase of LPG-related VOCs led to O3 increments even though the
total VOCs (TVOCs) were reduced, as the peroxyl radicals (RO2)generated from VOCs with low vapor pressure had a
higher branching ratio leading to NO2 formation from NO,
rather than reserving nitrogen in the form of organic nitrates. On the other hand, NO emitted from LPG combustion may titrate O3. Therefore, it still remains undecided as to whether
the LPG usage is contributive or destructive to O3formation,
especially in Hong Kong.
Hong Kong has experienced rapid development during the past decades, and increasingly suffers from crowded traffic and population, with nearly 0.7 million vehicles traveling on the total road length of 2.1×10³km and 7.2 million people living in a territory 1.1×10³km2in size. The road usage rate in Hong Kong is among the highest in the world, transporting approximately 1.2 million passengers per day. As such, traf-fic emissions signitraf-ficantly influence the air quality in Hong Kong. Apart from local emissions, air quality in Hong Kong is also affected by regional transport. In autumn and winter, prevailing northerly and northeasterly winds bring anthro-pogenic emissions from mainland China to Hong Kong, en-hancing local pollution burden. In summer, clean oceanic air masses dilute the levels of air pollutants under the influence of southerly winds (Ling et al., 2013; Guo et al., 2009; Wang et al., 2005; So and Wang, 2003; Chan and Chan, 2000). Ling et al. (2013) quantified the contribution of regional transport as 0–61 % for summer O3 and 0–56 % for autumn O3 on
high O3 days in Hong Kong. Guo et al. (2006) found that
over 45 % of VOC samples collected from August 2001 to December 2002 at Tai O, Hong Kong, were influenced by re-gional transport from inland China. Based on numerical sim-ulations, Wang et al. (2006) quantified regional contributions of 40–90 % to O3 formation in Hong Kong, and Huang et
al. (2006) indicated that the regional contribution was<50 % when a trough was over the South China Sea (SCS), and it increased to >50 % in the presence of an anticyclone over mainland China and/or a tropical cyclone over SCS. Further-more, Wang et al. (2006) revealed that the regional contri-bution was lower during daytime than that at night, while Lam et al. (2005) found that the contribution decreased from
>50 % during an O3episode to 30–50 % after the episode. In
addition, Jiang et al. (2008) reported that the contribution of horizontal transport to surface O3in Hong Kong was
negli-gible during a typhoon-induced O3episode. However, all the
studies focused on the regional contribution at non-roadside sites, and the O3 chemistry at roadside sites in Hong Kong
was seldom reported. Given high NOx levels, tall buildings and low wind speeds along the main roads in Hong Kong, it is expected that the regional impact on air pollutants in a roadside environment is relatively minor, especially during daytime hours on non-O3episode days.
To improve the air quality, the Hong Kong Environmental Protection Department (HKEPD) launched a series of pro-grams including a stepwise LPG replacement program for taxis and light buses from 1997. By the end of 2010,>99 % of the registered taxis (i.e., 17 950 vehicles) and 51 % of the registered public and private light buses (i.e., 3280 vehicles) were powered by LPG (HKCSD, 2010). Due to the usage of LPG as vehicle fuel, the ambient VOC profile in Hong Kong changed substantially, with the most abundant species switching from toluene to propane andn/ i-butanes (Ou et al., 2015; Guo et al., 2007; Ho et al., 2004). In addition, studies consistently confirmed an increased contribution of LPG-fueled vehicle emissions to ambient VOC levels, which was 11 % at an urban site in 2001 (Guo et al., 2004), 15 % at a suburban site during 2002–2003 (Guo et al., 2007) and 26.9±0.6 % and 40.8±0.8 % at an urban site during 2002– 2003 and 2006–2007, respectively (Lau et al., 2010). More-over, O3has been experiencing an increasing trend in Hong
Kong over the last 2 decades (Wang et al., 2009; Guo et al., 2009). As O3formation was generally VOC-limited in Hong
Kong (Cheng et al., 2010; Zhang et al., 2007), the contribu-tion of LPG-fueled vehicle emissions to O3was not
negligi-ble, in view of the dominance of propane andn/ i-butanes in ambient air and the high contribution of LPG-fueled vehicle emissions to ambient VOC levels. As such, an intervention program which aimed to reduce VOCs and NOx emitted by LPG-fueled vehicles was initiated in September 2013. This subsidy program promoted the replacement of aging catalytic converters in LPG-fueled vehicles, and the catalytic convert-ers in∼75 % of LPG-fueled vehicles were replaced by the end of May 2014. Although laboratory studies identified a high removal efficiency of the new catalytic converter on VOCs and NOxemissions (Table S1 in the Supplement), the impact of the program on roadside air quality, which is more complex, required investigation.
In this study, the effectiveness of the intervention program on the reduction of LPG-related VOCs and NOx, on O3
pro-duction and on the photochemical reactivity driving the O3
formation was evaluated. Furthermore, the sensitivity of O3
variation (i.e., the difference of net O3 production by LPG
reasonable reduction ratio of VOCs/NOxwere proposed for achieving the best O3reduction.
2 Methodology 2.1 Site description
Hong Kong, located on the coast of the South China Sea (SCS), constitutes the greater Pearl River Delta (PRD) to-gether with Macao and nine mainland cities in Guang-dong province (i.e., Guangzhou, Shenzhen, Zhuhai, Fos-han, Dongguan, ZhongsFos-han, Huizhou, Jiangmen and Zhao-qing). Hong Kong has a typical coastal hilly terrain, with a large area of water (∼60 %) and large vegetation coverage (∼70 % of land area). A marine subtropical monsoon climate dominates, and the prevailing winds are north and northeast in winter, east in spring and autumn and south and southwest in summer.
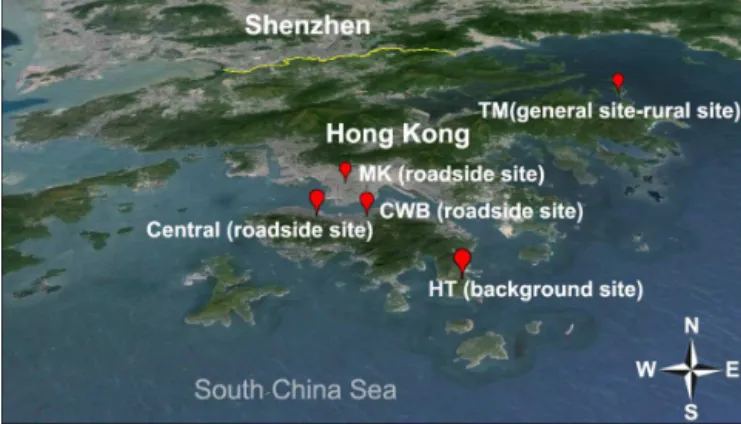
This study involves three roadside sites (Mong Kok (MK, 22.32◦N, 114.17◦E), Causeway Bay (CWB, 22.28◦N, 114.19◦E) and Central (22.28◦N, 114.16◦E)), a general site (Tap Mun (TM, 22.47◦N, 114.36◦E)) and a back-ground site (Hok Tsui (HT, 22.22◦N, 114.25◦E)). MK, CWB and Central are in mixed residential/commercial areas with heavy traffic and are surrounded by dense tall buildings. TM is a rural site surrounded by country parks, and is upwind of Hong Kong in autumn/winter seasons. These four sites have air quality monitor-ing stations deployed by Hong Kong Environmental Protection Department (HKEPD) (more details are pro-vided at http://www.aqhi.gov.hk/en/monitoring-network/ air-quality-monitoring-stations9c57.html?stationid=81). HT is a remote site at the tip of southeastern Hong Kong, ∼25 km from the urban core. It receives air masses from SCS in summer and from continental areas including Hong Kong and PRD in autumn/winter. Therefore, air masses at HT are a mix of marine and continental background air. Indeed, HT has been serving as a background site and is extensively used for air quality studies in Hong Kong (Wang et al., 2009; Ho et al., 2006; Lee et al., 2002). Figure 1 shows the geographical location of the sampling sites.
2.2 Continuous measurements 2.2.1 Trace gases
Five trace gases (i.e., CO, SO2, NO, NO2and O3)were
con-tinuously measured at all the sites from 2011 to 2014. The analyzers were deployed in the air quality monitoring sta-tions, with a height of 3.0 m (MK and CWB), 4.5 m (Cen-tral), 11.0 m (TM) and 20.0 m (HT) above ground level. Air samples were drawn through a perfluoroalkoxy (PFA) Teflon tube with an outside diameter (OD) of 12.7 mm and an inside diameter (ID) of 9.6 mm. The inlet of the tube was approxi-mately 0.5 m above the rooftop of the monitoring station, and
Figure 1.Geographical location of the sampling sites. The yellow line represents the border between Hong Kong and mainland China.
the outlet was connected to a PFA manifold with a bypass pump, drawing air into the analyzers at a rate of 5 L min−1. Details about the analyzers are provided elsewhere (HKEPD, 2014; So and Wang, 2003).
Briefly, CO was analyzed using the method of non-dispersive infrared absorption with gas filter correlation (TECO 48C/API 300); SO2was detected with UV
fluores-cence analyzers (TECO 43A/API 100E/TECO 43I); NO– NO2–NOxwere measured by chemiluminescence technique (API 200A); and O3was monitored with the UV absorption
method (API 400/API 400A). The detection limits for CO, SO2, NO, NO2and O3were 50.0, 1.0, 0.5, 0.5 and 2.0 ppbv,
respectively. 2.2.2 VOCs
Thirty C2–C10 non-methane hydrocarbons (NMHCs),
in-cluding 11 alkanes, 10 alkenes and 9 aromatics, were con-tinuously measured at MK and HT from 2011 to 2014. The VOC samples were collected and analyzed every 30 min with an online analytical system (Syntech Spectra GC 955, Se-ries 600/800, the Netherlands). The data were averaged into hourly values. The detection limits varied by VOC species and were in the range of 0.002–0.787 ppbv.
respectively. These fractional contributions suggest the im-portance of LPG-related VOCs in the budgets of VOCs and O3 in Hong Kong. Consistent with the decreases of
frac-tional contributions once the program started, the mixing ra-tios (29.4±3.3 and 21.0±2.2 ppbv for before and during the program, respectively) and OH reactivity (1.12±0.04 and 0.79±0.02 s−1before and during the program, respec-tively) of LPG-related VOCs significantly declined at MK (p <0.05), while at HT, their mixing ratios increased from 1.5±0.1 to 1.9±0.04 ppbv, and the OH reactivity increased from 0.06±0.004 to 0.07±0.003 s−1. The minor variation of background LPG-related VOCs relative to the decreases at MK (4.8 % in mixing ratios and 3.0 % in OH reactivity of VOCs) indicated that the influences of the background con-centrations on the variations of LPG-related VOCs and O3at
MK were minimal and can be neglected.
2.2.3 Quality assurance and control (QA/QC)
To guarantee the quality of the data acquired from the on-line monitoring systems, the instruments and QA/QC proce-dures for trace gases measurements were identical to those in the US air quality monitoring program (http://epic.epd.gov. hk/ca/uid/airdata). The measurements have been accredited by the Hong Kong Laboratory Accreditation Scheme (HOK-LAS). All the instruments were regularly calibrated, tested and audited by standards with known traceability for mea-surements of trace gases. According to HOKLAS criteria, a quality system was established to control the accuracy and precision within the limits of±15 and±20 %, respectively (HKEPD, 2014). For VOC analysis, a built-in computer-ized program, including auto-linearization, auto-calibration and calibration with span gas, was adopted to control the quality. The accuracy and precision of VOC measurements were 1.0–10 % and 2.5–20 %, respectively. The accuracy was based on weekly span checks, monthly calibration and an-nual auto-linearization using the National Physical Labora-tory (NPL) span gas. The precision was based on quarterly precision check results (the 95 % probability limits for the integrated precision based on weekly precision check results of the latest 3 months). Moreover, the online measurements of VOCs were regularly compared with whole-air canister samples collected and analyzed by University of California at Irvine (UCI). Good agreements were identified for the alkanes (e.g.,R2=0.95 and 0.85, slope=1.14 and 0.97 for propane and butanes, respectively), while the agreements for the more reactive alkenes and aromatics were also reasonable (e.g.,R2=0.64 and 0.94, slope=1.34 and 0.86 for propene and toluene, respectively).
2.3 Theoretical calculation and model description 2.3.1 Primary emissions of VOCs and NOx
The measured concentrations of VOCs and trace gases were composed of the backgrounds, primary emissions and sec-ondary formation (applicable to O3and NO2). To obtain the
concentrations of LPG-related VOCs and NOxemitted from primary sources at the roadside sites, the background con-centrations and the concon-centrations elevated by the secondary formation (if applicable) in this study were excluded using Eqs. (1)–(5) (Takekawa et al., 2013):
[VOC]prim.=[VOC]obs.−[VOC]bg. (1)
[NO2]sec.= [O3]bg.− [O3]obs. (2)
[NO2]prim.= [NO2]obs.− [NO2]sec.− [NO2]bg. (3)
[NOx]prim.= [NOx]obs.− [NOx]bg. (4)
[NO]prim.= [NOx]prim.− [NO2]prim., (5)
where [xx]obs., [xx]prim., [xx]sec. and [xx]bg. represent the
observed concentrations, the concentrations emitted from primary sources, secondary formation and the backgrounds, respectively. In this study, the hourly measured VOCs at HT were considered as the background levels for VOCs. For O3
and NOx, the 8 h averages at TM were treated as background values because (1) O3and NOxare highly reactive, and the use of 8 h averages would minimize the impact of abrupt changes; (2) TM is located at the upwind location of Hong Kong, and is a rural coastal site; (3) 8 h averages of O3and
NOx showed good correlations (R2=0.75 and 0.57 for O3
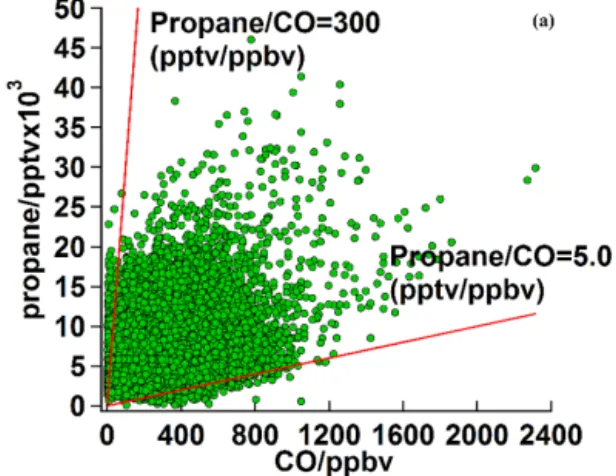
Figure 2.Hourly ratio of propane/CO at MK during 2011–2014.
higher after the background values were deducted. The re-sults suggested that air masses at MK were dominated by fresh emissions.
However, regional and super-regional transport cannot be completely eliminated only with the VOC ratios, and the in-fluence of regional/super-regional air should be further ex-amined when studying the emissions of local LPG-fueled vehicles. Using the propane/CO ratio method proposed by Guo et al. (2006), i.e., the ratio range of 5.0–300 pptv ppbv−1 for air masses in Hong Kong, the influence of regional/super-regional air masses on local air was evaluated. Figure 2 shows the ratios of propane/CO at MK from 2011 to 2014. The propane/CO ratios of∼96 % air masses were between 5.0 and 300 pptv ppbv−1. Further inspection of the values of LPG-related VOCs and NOx with ratios of 5.0–300 showed insignificant differences (p >0.1) to those with ratios be-yond 5–300, suggesting that the air masses at MK were seldom influenced by regional/super-regional air. Moreover, wind speeds were lower than 2.0 m s−1for more than 95 % of the time (i.e., calm or light air according to the Beaufort Wind Scale) (http://www.spc.noaa.gov/faq/tornado/beaufort.html), and the values of LPG-related VOCs and NOx in all air masses were not different to those in the air masses with wind speeds lower than 2.0 m s−1 (p >0.1), confirming a minor impact of regional/super-regional pollution on air at MK. In-deed, the prevailing wind direction was from the east, where local urban areas are located.
2.3.3 PMF model
Positive matrix factorization (PMF) is a receptor model for source apportionment and has been extensively used in many fields (i.e., PM, VOCs and sediment) (Brown et al., 2007; Lee et al., 1999). Based on the principle of mass balance, it decomposes the matrix of measurement (X) into the ma-trices of factor contributions (G) and factor profiles (F) in p sources, as shown in Eq. (6) (Paatero, 1997; Paatero and
Tapper, 1994):
xij= p
X
k=1
gikfkj+eij, (6)
wherexij is the measured concentration of j species in i sample,gikrepresents the contribution ofkth source toi sam-ple,fkj indicates the fraction ofj species inkth source and eij is the residual forj species inisample.
The matrices ofGandF are obtained in the case of the minimum of objective functionQ, as shown in Eq. (7):
Q= n
X
i=1 m
X
j=1
xij− p
P
k=1
gikfkj
uij
2
, (7)
wheremandnrepresent the number of species and samples, respectively, anduijis the uncertainty ofj species ini sam-ple.Q(robust) is automatically calculated by excluding the points not fit by the model, and the run with lowestQ (ro-bust) value is selected as the optimum solution by the model. 2.3.4 PBM-MCM model
The photochemical box model incorporating the master chemical mechanism (PBM-MCM) is a computing model based on the chemical reactions of observed species. It has been introduced and successfully applied in many previous studies in reproducing the observed values, describing the production and destruction mechanisms and simulating the photochemical reactivity (Ling et al., 2014; Lam et al., 2013; Cheng et al., 2010). Briefly, the observations of VOCs, trace gases and meteorological parameters are input to construct and constrain the model, which consists of 5900 reactions and 16 500 species in the latest version (MCM 3.2). How-ever, it is noteworthy that the heterogeneous reactions are not included, and the model does not consider the transport pro-cesses (i.e., horizontal and vertical transport).
In this study, CO, SO2, NO, NO2, O3, 27 VOCs and
Table 1.Ratios of toluene/benzene and xylenes/ethylbenzene at MK and other sites in Hong Kong from October 2012 to May 2014 (unit: ppbv ppbv−1).
Toluene/benzene Xylenes/ethylbenzene
MK (roadside site) 4.1±0.04 3.0±0.02 MK∗(roadside site) 11.3±0.9 5.7±0.2
TC (general site) 0.7±0.1 –
YL (general site) 3.7±0.04 2.4±0.02 HT (background site) 2.5±0.1 1.8±0.03
MK∗refers to VOCs at MK with the background values removed.
Table 2.Formation and loss pathways of OH and HO2considered in this study.
OH HO2
Formation pathways HO2+NO RO2+NO
HONO+hv OH+CO
O (1D)+H2O OH+HCHO O3+alkenes HCHO+hv
O3+alkenes
Loss pathways OH+VOCs HO2+NO
OH+NO2 OH+CO OH+NO
A base case was established to simulate O3and the
pho-tochemical reactivity (i.e., the formation and loss pathways of OH and HO2listed in Table 2). The observed VOCs and
trace gases were input to construct the base case, and the simulated O3was compared with the observed levels to
val-idate the model and check the influence of regional transport during daytime hours. At low wind speed (1.3±0.01 m s−1) and high NOx (223.2±1.8 ppbv) at MK, the majority of re-gional O3 would be completely consumed before being
de-tected by measurement instruments. In fact, the PBM-MCM model considered the regionally transported concentrations of O3precursors, as the observed concentrations input into
the model included the regional fractions. Moreover, since O3 levels were higher at night (8.1±0.2 ppbv) than those
during daytime (5.9±0.1 ppbv) at MK, it suggests the ex-istence of nocturnal regional transport. Hence, the observed O3at 07:00 was input into the model to initiate the
simula-tion for daytime hours; i.e., the nocturnal regional transport of O3was also considered.
To simulate the contribution of LPG source to O3
for-mation, the following approach was adopted to avoid alter-ing the real ambient environment for atmospheric chemistry. Briefly, the concentration of speciesXin the whole air and in the assigned LPG source was defined asXwhole airandXLPG,
respectively. Hence, the concentration of Xwhole air−XLPG
was the input for the constrained cases, whileXwhole airwas
the input for the base case. The three constrained cases were
as follows: (i) only VOCs in the LPG source were excluded from the whole air; (ii) only NOxin the LPG source was ex-cluded; and (iii) both VOCs and NOxwere removed simulta-neously. As such, the differences of the outputs between the base case and the three constrained cases were the contribu-tions of (i) VOCs, (ii) NOx and (iii) VOCs +NOx in the LPG source to the O3formation, respectively. The changes
of these contributions from the period before the program to during the program represented the impact of the interven-tion program on O3formation. Table S3 in the Supplement
lists the configurations of the model input for the base case and the three constrained cases.
2.3.5 Relative incremental reactivity (RIR)
RIR, initially proposed by Carter and Atkinson (1989), has been extensively used to describe the relationship between O3and its precursors, i.e., VOCs, NOxand CO. Although the observation-based models incorporating carbon bond mech-anisms were often utilized to simulate the O3production rate
(Ling et al., 2011; Zhang et al., 2007; Martien et al., 2003), a more explicit PBM-MCM model was applied in this study. The RIR and RIR (weighted concentration) were calculated using Eqs. (8) and (9) (Ling et al., 2011):
RIRS(X)=
h
POS
3−NO(X)−P
S
O3−NO(X−1X)
i
/POS
3−NO(X)
1S(X)/S(X) (8)
RIR (weighted concentration)=RIR(X) ×concentration RIR (weighted concentration)
=RIR(X)×concentration, (9)
where PSO3−NO(X) and PSO3−NO(X−1X) represent the original O3 production rate, and that in the scenario,
with a hypothetical change (1X) (10 % in this study) in source/speciesX, respectively, both of which considered O3
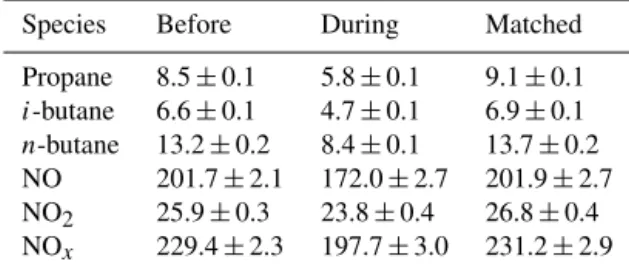
Table 3.Mixing ratios of LPG-related VOCs and NOxduring the period before the program, the matched period and the period during the program (unit: ppbv).
Species Before During Matched
Propane 8.5±0.1 5.8±0.1 9.1±0.1 i-butane 6.6±0.1 4.7±0.1 6.9±0.1 n-butane 13.2±0.2 8.4±0.1 13.7±0.2 NO 201.7±2.1 172.0±2.7 201.9±2.7 NO2 25.9±0.3 23.8±0.4 26.8±0.4 NOx 229.4±2.3 197.7±3.0 231.2±2.9
3 Results and discussion
3.1 Variations of LPG-related VOCs and NOx during
the intervention program
3.1.1 Concentrations of primary LPG-related VOCs and NOx
Table 3 shows the mixing ratios of the primarily emitted LPG-related VOCs and NOxbefore and during the program. The LPG-related VOCs and NOxwere reduced significantly from the period before the program to during the program (p <0.05). To investigate the meteorological influences on these reductions, we looked into the average geopotential height (HGT) and wind field on 1000 hPa for East Asia for the matched period and the period during the program, as shown in Fig. S1 in the Supplement (the matched period (Oc-tober 2012–May 2013) was defined as the same time span as that during the program, but in different years.) Notice-ably, the meteorological conditions were fairly similar be-tween the two periods; i.e., the pressure decline (indicated by the decrease of HGT) from northern China to SCS led to the prevailing northeasterly winds in Hong Kong, and the dif-ferences of HGT and wind speed between the two periods for Hong Kong were only 0–2 gpm and less than 1 m s−1, respec-tively. Ground monitoring data also indicated insignificant differences of temperature (matched: 21.9±0.5◦C; during: 21.2±0.7◦C) between the two periods (p >0.05). However, the mixing ratios of LPG-related VOCs and NOx during the matched period were comparable to those before the pro-gram, and absolutely higher than those during the program (p <0.05) (see Table 3). Given the similar meteorological conditions between the matched period and during the pro-gram, the significant decreases of LPG-related VOCs and NOxwere caused by the interventional program, rather than meteorological variations.
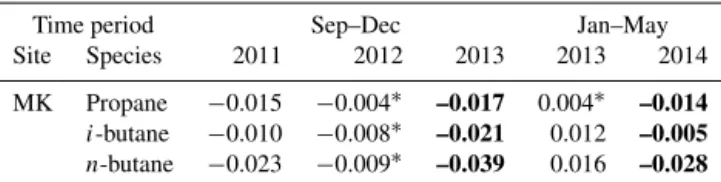
To further understand the effectiveness of the program, the monthly reductions of LPG-related VOCs after the com-mencement of the converter replacement were calculated and compared with those before the program (Fig. 3). Since the program was initiated in October 2013, the averages of VOC species in September in each year were taken as the
base-lines for the calculation of monthly reduction. Briefly, the monthly reductions of LPG-related VOCs were the differ-ences between their averages in September and those in the other months. Hence, positive and negative values indicate reductions and increments of the corresponding species, re-spectively. It was found that the monthly averages of LPG-related VOCs consistently decreased from September 2013 to May 2014 except forn-butane in October 2013 when the program was just initiated. Compared to those before the pro-gram (i.e. September 2013), the mixing ratios of propane, i-butane and n-butane decreased 3.2±0.2, 2.8±0.2 and 4.9±0.2 ppbv by May 2014, respectively, when 99.2 % of catalytic converters participating in the program had been exchanged. Furthermore, the monthly reductions correlated well with the cumulative converter replacements (R2=0.92,
0.93 and 0.89 for propane,i-butane and n-butane, respec-tively). In contrast, no consistent reduction was observed from September 2012 to May 2013 for LPG-related VOCs, suggesting the effectiveness of the program on the reduction of LPG-related VOCs. On the other hand, although the aver-age mixing ratios of NOxdecreased significantly during the program as shown in Table 3, no consistent reductions were found for their monthly averages. This might be due to the fact that NOx emitted from LPG-fueled vehicles was minor compared to gasoline- and diesel-fueled vehicles (∼4.0 % from emission inventory, and 1.1–7.3 % from source appor-tionment. See Sect. 3.2.2).
3.1.2 Temporal variations of primary LPG-related VOCs and NOx
Figure 3.Monthly reductions of LPG-related VOCs at MK before (blue bar) and during (red bar) the program. (The average value of VOC species in September is the baseline. The values along the dot line were the cumulative numbers of converters replaced. The bars above and below thexaxis refer to the reduction and increase of VOC mixing ratio, respectively.)
was no significant difference in 2012. In general, the lev-els of VOCs in the atmosphere are associated with source emissions, photochemical reactions and regional transport. As the regional influence was excluded in this study, source emissions and photochemical reactions became the main fac-tors determining the ambient concentrations of VOCs. The decreasing and unchanged trends in 2011 and 2012 respec-tively might be related to the integrated influence of reduced photochemical degradation (which increases ambient VOC levels) and temperature decrease (which reduces evapora-tive emissions of VOCs) from September to December. It is noticeable that the LPG-related VOCs had the highest de-creasing rates in September–December 2013, compared to
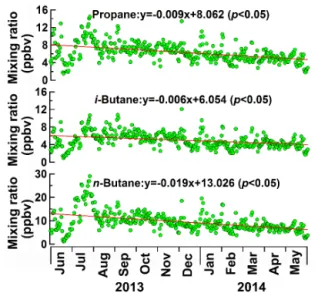
Figure 4.Variation trends of the daily average propane andn/ i -butanes at MK from June 2013 to May 2014. In the equation, label xhas a unit of days.
those in previous years. The higher decreasing rates of LPG-related VOCs in September–December 2013 implied the pos-sible effectiveness of the interventional program on VOCs reduction. For the period of January–May, the LPG-related VOCs increased in January–May 2013, except for propane which did not show significant change from January to May. However, significant decreasing trends (p <0.05) were ob-served for propane and n/ i-butanes during the same pe-riod in 2014, which was likely owing to the continuous re-placement of catalytic converters on LPG-fueled vehicles. By comparison, the reduction rates of LPG-related VOCs in January–May 2014 were all lower than those in September– December 2013. This was mainly attributable to the fact that a large portion (i.e.∼69 %) of the converter replace-ments were completed by the end of December 2013, and there were much fewer replaced converters (i.e.∼31 %) in January–May 2014.
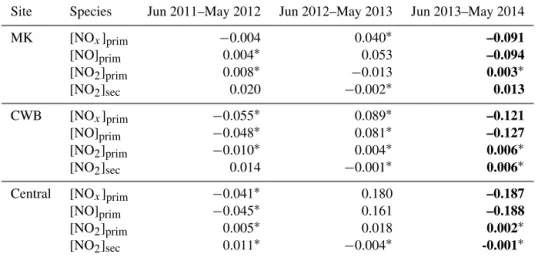
Figure 5 shows the temporal variations of primary NOx, NO, NO2 and secondary NO2 at MK from June 2013 to
May 2014. The primary NOx and NO mixing ratios de-creased significantly (p <0.05), implying the possible effec-tiveness of the intervention program on NO/NOxreduction. However, the secondary NO2 levels increased, while there
was no significant change (p >0.05) for primary NO2. To
explore the reasons of NO–NO2–NOxvariations, the chang-ing rates of primary NOx, NO, NO2and secondary NO2
dur-ing the same period (i.e., June in the previous year to May in the following year) in different years were compared. Ta-ble 5 shows the statistics of changing rates of NOx–NO– NO2at the roadside sites (i.e., MK, CWB and Central) from
Table 4.Changing rates of propane andn/ i-butanes in September– December and January–May in different years (ppbv day−1).
Time period Sep–Dec Jan–May Site Species 2011 2012 2013 2013 2014 MK Propane −0.015 −0.004∗ –0.017 0.004∗ –0.014 i-butane −0.010 −0.008∗ –0.021 0.012 –0.005 n-butane −0.023 −0.009∗ –0.039 0.016 –0.028
∗The changing rate insignificant (p >0.05); the bold numbers are changing rates during the
implementation of the program.
than during the same period in 2011–2012 and 2012–2013, suggesting the effectiveness of the program in reducing NOx and NO. Compared to the decreasing rate in June 2012– May 2013 (i.e., 13 pptv day−1), no significant change (p > 0.05) was observed for primary NO2 from June 2013 to
May 2014. However, it cannot be concluded that the program caused the increase of primary NO2, in view of the same
in-significant variation in June 2011–May 2012 and the fact that LPG-fueled vehicles emit negligible NO2 (see Sect. 3.2.2).
In contrast, secondary NO2 significantly increased (with a
rate of 13 pptv day−1) from June 2013 to May 2014, which was also observed in June 2011–May 2012 (i.e., increasing rate of 20 pptv day−1). Since secondary NO2 is formed by
NO reacting with O3, inspection of the O3production would
provide more comprehensive interpretation on the secondary NO2increment during the program. Similar variations were
observed at CWB and Central, where primary NOx and NO showed significant decreasing trends, whereas the variations of primary and secondary NO2were insignificant (p >0.05).
In summary, the LPG-related VOCs were significantly lowered during the program with monthly reductions of 3.2±0.2, 2.8±0.2 and 4.9±0.2 ppbv for propane,i-butane andn-butane by the end of this study, respectively. Continu-ous decreasing trends were observed for LPG-related VOCs, and the reduction rates were almost unprecedented, e.g., 39 pptv day−1 for n-butane. Furthermore, the mixing ratios of NO and NOx decreased as well during the program. The reduction rates of NO and NOxduring June 2013–May 2014 at the three roadside sites were much higher than those in previous years. Overall, the field measurement data indicated that the program was effective in reducing emissions of LPG-related VOCs and NOx.
3.2 Variations of LPG contributions to VOCs and NOx
3.2.1 Source identification
To investigate the change of the contributions of LPG-fueled vehicles to VOCs and NOx, the online data of 15 VOCs and three trace gases at MK before (i.e., 8753 samples dur-ing October 2012–September 2013) and durdur-ing the inter-vention program (i.e., 5833 samples during October 2013– May 2014) were separately applied to PMF for source ap-portionments. It is noteworthy that the whole-air ambient
concentrations of VOCs and trace gases, rather than those with the backgrounds deducted were used here, in order to keep consistency with the simulations of whole-air ambient O3and photochemical reactivity. Figure 6 shows the source
profiles of the four factors that best reproduced the concen-trations of the input species before and during the interven-tion program, respectively. The first factor had high loadings of C3–C5hydrocarbons and toluene, and was dominated by
CO, NO and NO2, which are all main components of
vehi-cle exhaust (Guo et al., 2011a; Ho et al., 2009). Then/ i-pentanes and toluene indicated emissions from gasoline ve-hicles, while the high NOxloading was a signature of diesel exhaust. Since propane andn/ i-butanes were not prominent, this factor was assigned as gasoline and diesel-fueled vehi-cle exhaust. Factor 2 was closely associated with LPG-fueled vehicle exhaust, with the dominance of propane,n/ i-butanes and propene, the major components and combustion product of LPG (Guo et al., 2011b; Blake and Rowland, 1995). Fac-tor 3 was distinguished by NO2and the long-lived species,
i.e., ethane, ethyne, benzene and CO. The long-lived species were the indicators of aged air masses, in which NO2was
ac-cumulated due to photochemical reactions. Hence, this factor represented aged air masses. Indeed, this profile highly coin-cided with the aged air in Hong Kong identified by Lau et al. (2010). The last factor explained most of the TEX com-pounds (toluene/ethylbenzene/xylenes), the tracers of sol-vent usage (Guo et al., 2007; Borbon et al., 2002). Therefore, factor 4 was identified as solvent usage.
3.2.2 Source contribution
Figure 5.Variation trends of the daily average primary NOx, NO and NO2and secondary NO2at MK from June 2013 to May 2014. In the equation labelxhas a unit of days.
Table 5.Changing rates of primary NOx, NO, NO2and secondary NO2(ppbv day−1).
Site Species Jun 2011–May 2012 Jun 2012–May 2013 Jun 2013–May 2014
MK [NOx]prim −0.004 0.040∗ –0.091
[NO]prim 0.004∗ 0.053 –0.094
[NO2]prim 0.008∗ −0.013 0.003∗
[NO2]sec 0.020 −0.002∗ 0.013
CWB [NOx]prim −0.055∗ 0.089∗ –0.121 [NO]prim −0.048∗ 0.081∗ –0.127 [NO2]prim −0.010∗ 0.004∗ 0.006∗
[NO2]sec 0.014 −0.001∗ 0.006∗
Central [NOx]prim −0.041∗ 0.180 –0.187
[NO]prim −0.045∗ 0.161 –0.188
[NO2]prim 0.005∗ 0.018 0.002∗
[NO2]sec 0.011∗ −0.004∗ -0.001∗
∗The changing rate is insignificant (p >0.05); the bold numbers are changing rates during the implementation of the program.
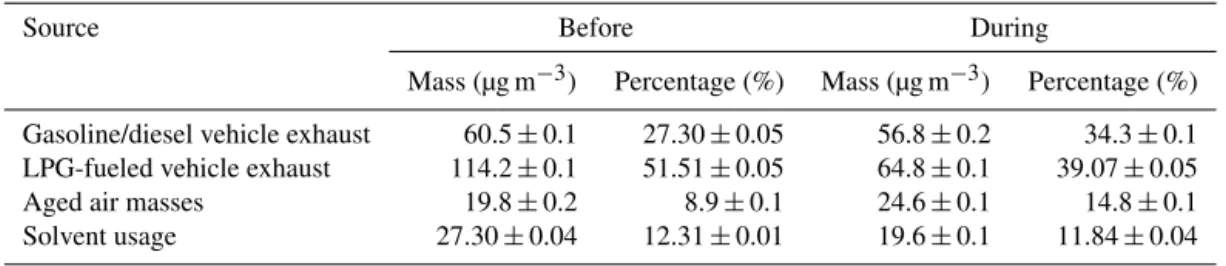
made the highest contribution to VOCs, in view of low vapor pressure of the LPG component and high-density flow of the LPG-fueled vehicles at MK. Apart from vehicular exhaust, the aged VOCs and solvent usage also contributed∼24 % to VOCs at MK.
Table 7 lists the reduction of individual species from LPG-fueled vehicles due to the intervention program. Propane (before: 21.15±0.02 µg m−3; during: 12.53±0.01 µg m−3), n-butane (before: 57.96±0.01 µg m−3; during: 30.27± 0.02 µg m−3) and i-butane (before: 27.20±0.02 µg m−3; during: 17.50±0.01 µg m−3) all decreased remarkably throughout the study period (p <0.05). Meanwhile, the
concentrations of CO and NO were also reduced from 248.4±1.3 and 18.2±0.1 µg m−3 to 228.9±0.6 and 2.08±0.04 µg m−3, respectively. However, NO2
appor-tioned in LPG exhaust was extremely minor (i.e., 0.6±0.2 µg m−3and nil before and during the program, re-spectively), which might explain the insignificant decrease or even increase of NO2. During the study period, the
re-Figure 6. Source profiles resolved by PMF before (red bar) and during (green bar) the program. The standard errors are estimated with the bootstrap method in the model.
ductions of VOCs and NO in LPG-fueled vehicle exhaust benefited from the intervention program.
3.3 Impact of the intervention program on O3 production
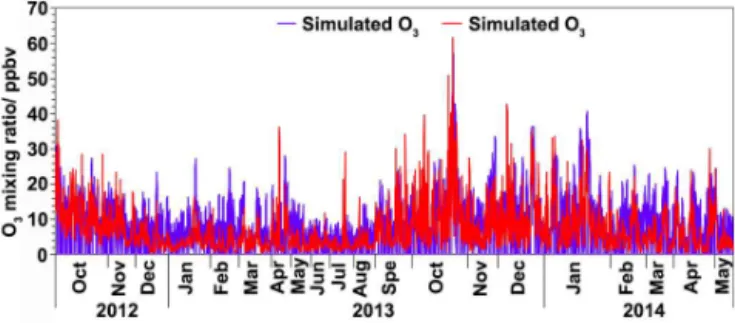
3.3.1 O3simulation
As VOCs and NOx are key O3precursors, it is essential to
examine the impact of the reduction of VOCs and NOx dur-ing the program on the O3 production. Figure 7 compares
the observed and simulated O3during daytime (07:00–19:00
local time (LT)) in the base case.
To quantitatively evaluate the performance of the model, the index of agreement (IOA) was introduced to test the agreement between the simulated and observed O3. Ranging
from 0 to 1, higher values of IOA indicate better agreement between the simulation and observation. The IOA was calcu-lated using Eq. (10) (Huang et al., 2005):
IOA=1−
n
P
i=1
(Oi−Si)2
n
P
1i=1
(|Oi− ¯O| + |Si− ¯O|)2
, (10)
whereOi andSi are the hourly observed and simulated val-ues, and O¯ represents the average of observations. In this study, the IOA reached 0.75, and the accuracy of the simu-lation was 16.7±2.1 %, suggesting good performance of the model in O3simulation. Bearing in mind the uncertainty of
the model, the good agreement between the simulated and observed O3 implied a minor regional contribution at this
roadside site.
Figure 7.Hourly simulated and observed O3during daytime hours (07:00–19:00 LT) at MK.
3.3.2 Net O3production
Figure 8 shows the net O3 variations induced by VOCs,
NOx and VOCs +NOx in LPG-fueled vehicle exhaust be-fore and during the program. From bebe-fore to during the intervention program, the daily average O3 variation
in-duced by VOCs decreased significantly (p <0.05), with a rate of−9.3×10⁻⁵ppbv day−1, whereas O3increased
sig-nificantly at a rate of 1.3×10⁻³ppbv day−1 due to the reduction of NOx titration (p <0.01). As a result, the net contribution to O3 made by the LPG-fueled vehicle
exhaust increased (p <0.01) from −0.47±0.03 ppbv be-fore the program to−0.06±0.02 ppbv during the program, with a rate of 1.2×10⁻³ppbv day−1; namely, O3increased
by 0.40±0.03 ppbv, ∼5.6 % of the observed O3 at MK
(7.14±0.21 ppbv). The simulation results for the scenar-ios with and without the input of background tions indicated minor contribution of background concentra-tions to O3for both periods of before (0.24 ppbv,
account-ing for∼3.5 % of measured average) and during (0.27 ppbv; ∼3.7 %) the program, suggesting the use of whole-air am-bient concentrations without background subtraction for O3 simulation was appropriate. The slight increase of O3
(∼0.03 ppbv) caused by the background variations of O3
precursors from period before the program to during the program constituted only ∼7.5 % of the O3 enhancement
(0.40±0.03 ppbv) due to the replacement program, further confirming a negligible impact of the background on the as-sessment of the program. It is noteworthy that the increase was not a sudden change in reality, but was caused by the segmentation of source apportionment (i.e., October 2012– September 2013 and October 2013–May 2014). Indeed, the measurement data also revealed an increasing O3trend from
October 2012 to May 2014, with a rate of 3.3 pptv day−1 (p <0.05), higher than the O3increase caused by LPG. This
discrepancy might be related to the O3production by other
Table 6.Mass concentration and percentage contribution of the four sources to VOCs at MK before and during the program.
Source Before During
Mass (µg m−3) Percentage (%) Mass (µg m−3) Percentage (%)
Gasoline/diesel vehicle exhaust 60.5±0.1 27.30±0.05 56.8±0.2 34.3±0.1 LPG-fueled vehicle exhaust 114.2±0.1 51.51±0.05 64.8±0.1 39.07±0.05
Aged air masses 19.8±0.2 8.9±0.1 24.6±0.1 14.8±0.1
Solvent usage 27.30±0.04 12.31±0.01 19.6±0.1 11.84±0.04
Table 7.VOCs and trace gases emitted from LPG-fueled vehicles before and during the intervention program (unit: µg m−3unless otherwise specified). The standard errors are estimated with the bootstrap method in the PMF model. The bold fonts demonstrate significant reductions of LPG related VOCs and NOx.
Before During Ethane 1.192±0.001 1.19±0.01 Ethene 1.327±0.005 0.431±0.004 Ethyne 0.0000±0.0004 0.000±0.001 Propane 21.15±0.02 12.53±0.01
Propene 2.860±0.004 1.553±0.001 n-butane 57.96±0.01 30.27±0.02 i-butane 27.20±0.02 17.50±0.01 n-pentane 0.251±0.003 0.039±0.002
i-pentane 1.04±0.01 0.786±0.002 Benzene 0.00±0.01 0.000±0.001 Toluene 0.66±0.02 0.50±0.01 Ethylbenzene 0.000±0.001 0.000±0.004
m, p-xylene 0.416±0.003 0.00±0.01
o-xylene 0.144±0.001 0.006±0.001 CO 248.4±1.3 228.9±0.6 NO 18.2±0.1 2.08±0.04
NO2 0.6±0.2 0.00±0.08 Sum of VOCs 114.2±0.1 64.8±0.1 Contribution to VOCs (%) 51.5±0.1 39.1±0.1
3.4 Photochemical reactivity
3.4.1 OH, HO2and their formation/loss rates in whole air
As the “detergent” of atmosphere, OH initiates the oxidation of air pollutants including VOCs, CO and NOx, leading to O3formation, and the cycling between OH and HO2
acceler-ates the propagation of the chain reactions. Thus, the budget of OH and HO2is an important parameter of a
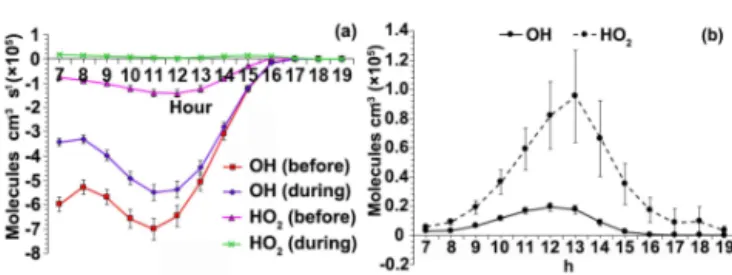
photochem-ical system. Figure 9 presents the average daytime patterns of OH and HO2before and during the program. Typical
bell-shaped patterns were observed for OH and HO2, which
in-creased from morning to noon, peaked at 12:00–13:00 and then decreased to low levels in the afternoon.
The average simulated concentrations of OH and HO2 were 1.64±0.78×10⁵ and
2.49±1.28×10⁵molecules cm−3 before the program, and
Figure 8.Net O3variation as a function of VOCs, NOxand VOCs +NOxemitted from LPG-fueled vehicles.
1.80±0.85×10⁵ and 4.18±2.03×10⁵molecules cm−3 during the program, respectively. Compared to those modeled at an urban site in Hong Kong (2.3–3.6×10⁶molecules cm−3 for OH and 3.4– 4.4×10⁸molecules cm−3 for HO2) (Ling et al., 2014),
and those measured at a VOC-rich site in PRD (15×106and 18×108molecules cm−3for OH and HO2, respectively) (Lu
et al., 2012; Lou et al., 2010), the OH and HO2levels were
much lower at MK. This is not surprising because much OH and HO2were consumed by high levels of VOCs and NOx at the roadside MK (Fig. S3 in the Supplementary material shows the simulated OH and HO2at different sites with the
PBM-MCM model). In addition, this study covered different seasons of the study years, rather than the O3 episodes in
Ling et al. (2014) and summer only in Lu et al. (2012) and Lou et al. (2010) when photochemical reactivity was usually stronger. Apart from the increase of OH and HO2from the
period before the program to during the program, the ratio of HO2/OH was significantly higher during the program
(i.e., 3.7±0.5) than that before (i.e., 1.9±0.3) (p <0.05), which might partly explain the increase of O3throughout the
study period. Nevertheless, since the OH, HO2and HO2/OH
were simulated using the whole-air concentrations of O3
precursors, whether their increases were mainly caused by the intervention program requires further investigation, as shown below.
Figure 9.Daytime patterns of OH and HO2(a)before and(b) dur-ing the program.
Figure 10.Average formation and loss pathways of OH and HO2 at MK during the study period.
were minor for each pathway of OH and HO2, Fig. 10
presents their average pathway-specific formation and loss rates over the whole study period. The total forma-tion/loss rates of OH and HO2 were 5.8±2.4×10⁶ and
2.6±1.0×10⁶molecules cm−3s−1, respectively. The reac-tion of HO2 with NO, HONO photolysis, O3
photoly-sis and ozonolyphotoly-sis of alkenes were the main sources of OH, with contributions of 56.7±11.6, 31.7±10.7, 6.6±3.3 and 5.0±1.7 %, respectively. On the other hand, OH was consumed by reaction with NO (36.5±5.5 %), NO2
(35.1±4.6 %), VOCs (14.8±1.2 %) and CO (13.6±1.0 %). For HO2formation, the reaction between RO2and NO was
the most predominant pathway (54.8±8.8 %), followed by the reaction of OH with CO (23.3±3.9 %), HCHO photol-ysis (13.1±4.6 %), ozonolysis of alkenes (7.9±2.1 %) and the reaction of OH with HCHO (0.8±0.2 %). Meanwhile, HO2was almost exclusively consumed by reacting with NO.
3.4.2 Influence of the program on photochemical reactivity
The differences between the simulation outputs of the sce-narios with and without LPG VOCs and NOx inputs deter-mined the contributions of LPG-fueled vehicle exhaust to the formation/loss rates of OH and HO2, as summarized in
Table 8. Generally, the formation/loss rates of OH and HO2
contributed by the LPG source decreased from the period be-fore the program to during the program, which was caused by the reduction of VOCs and NOxin the LPG source. Further-more, since the sum of the formation rates was lower than the
Figure 11. (a)Net production of OH and HO2by LPG-fueled ve-hicle exhaust (negative values indicate net destruction); and(b) in-creases of OH and HO2from the period before the program to dur-ing the program.
loss rates for OH for both before and during the program, but for only HO2before the program, the net effects of the LPG
source to OH and HO2were destructive. However, the HO2
formation rate exceeded its loss rate for the period of during the program, indicating a net production of HO2by the LPG
source.
Figure 11a shows the net effects of the LPG source on the production of OH and HO2. From before to during the
program, the destruction rate of OH decreased, while the destruction of HO2 switched to production. These
varia-tions led to the increases of OH and HO2 from the
pe-riod before the program to during the program, as shown in Fig. 11b. Different from the increases of OH and HO2
in the whole air as shown in Fig. 9, the increases here were caused by the intervention program. The OH and HO2levels increased by 6.9±1.1×10³molecules cm−3and
3.4±1.2×10⁴molecules cm−3, respectively. The higher in-crease of HO2 than OH led to a higher ratio of HO2/OH
during the program, resulting in a consequent O3increment.
3.5 Improvement of the intervention program 3.5.1 O3–VOCs–NOx sensitivity in the whole air
O3–VOCs–NOx sensitivity can reflect the O3variation
rel-ative to the change of VOCs and NOx, from which VOC-limited regimes and NOx-limited regimes in O3 formation
can be indicated. Figure 12a and b show the O3–VOCs–
NOx sensitivity in the air at MK between 40 and 100 and 0.5 and 40 % of the observed average NOx, respectively. The ranges were selected according to the O3levels and
Table 8.Contributions of LPG-fueled vehicle exhaust to the formation and loss of OH and HO2before and during the program. The bold fonts demonstrate the sum of OH/HO2 formation/loss rates or the net formation rate of OH/HO2.
Reaction Before During
(molecules cm−3s−1) (molecules cm−3s−1)
OH formation HO2 +NO (1.8±0.8)×105 (2.8±1.2)×104 O3 +alkenes (3.3±1.2)×104 (3.1±1.2)×104 Sum of OH formation (2.2±0.9)×105 (5.2±1.9)×104
OH loss OH+CO (1.4±0.6)×104 (1.5±0.6)×105
OH+NO2 (5.0±2.0)×103 –
OH+NO (1.9±0.02)×105 (2.4±1.0)×104 OH+VOCs (2.3±0.02)×105 (1.5±0.6)×105 Sum of OH loss (5.7±1.6)×105 (3.2±1.4)×105
Net OH formation −(3.6±0.8)×105 −(2.7±1.2)×105
HO2formation RO2 +NO (8.1±3.4)×104 (1.3±0.5)×104 O3+alkenes (3.3±1.2)×104 (3.1±1.2)×104 Sum of HO2formation (1.1±0.4)×105 (3.6±1.3)×104 HO2loss HO2 +NO (1.8±0.8)×105 (2.8±1.2)×104 Sum of HO2loss (1.8±0.8)×105 (2.8±1.2)×104
Net HO2formation −(7.0±3.1)×104 (7.8±3.1)×103
by 20 %. O3was simulated in 220 cases (i.e., 10 VOCs×22
NOx), and the maximum O3in each case was extracted.
It was found that within the cutting range of 0–60 % of NOx(Fig. 12a), O3increased with the increase of VOCs and
the decrease of NOx, indicating a VOC-limited regime in O3
formation. The black curve, perpendicular to the isopleths of O3, demonstrated the most sensitive response of O3to VOCs
and NOx. Namely, O3reduction could be achieved most
effi-ciently towards the abscissa. Using the absolute value of RIR (i.e.,|RIR|) as a measure of the O3–VOCs–NOxsensitivity, it increased with the reduction of VOCs and NOx. For example, |RIR|for VOCs and NOx increased from 0.09 and 0.22 in the scenario of 90 % VOCs and 90 % NOx, to 0.25 and 0.90 in the scenario of 50 % VOCs and 50 % NOx, respectively. From before to during the program, VOCs and NOx de-creased∼12 and∼15 %, respectively (i.e., from point A to B), causing a slight O3increment as described in Sect. 3.3.2.
The red and green curves in the lower right corner of Fig. 12a show the O3 production as a function of VOCs cut before
(NOx=100 %) and during the program (NOx= ∼85 %), re-spectively. With the reduction of VOCs, O3decreased. Since
O3–VOCs–NOxsensitivity increased during the program, O3
decreased by 45.5 and 67.6 pptv with 10 % cut of VOCs be-fore and during the program, respectively, which means that O3 reduction could be achieved more efficiently by further
cutting VOCs during the program.
With the continuous reduction of NOx, it was expected that the O3–VOCs–NOx sensitivity might change substan-tially due to the dual role of NOx in O3formation and
titra-tion. Figure 12b shows the O3–VOCs–NOxsensitivity in the
cutting range of 60–99.5 % of NOx. It is noticeable that in the cutting range of∼60–89.5 % of NOx, O3increased with
the increase of VOCs and decrease of NOx, similar to that in the cutting range of 0-60 % of NOx. However, a tran-sition area appeared when NOx was further cut, where O3
stayed relatively stable with NOx variations, and decreased with VOC reductions. This transition area changed from ∼5.5–10.5 % (i.e., VOCs =100 %) to ∼2.5–6 % of NOx (i.e., VOCs=10 %). The appearance of the transition area implied that the titration of O3 by NOx reached the mini-mum level, and further cutting of NOxmight actually cause O3reduction. As expected, O3decreased with the reduction
Figure 12. (a)O3–VOCs–NOxsensitivity within the cutting range of 0–60 % of NOx. The black curve demonstrates the most sen-sitive response of O3to VOCs and NOx. Points A and B represent the O3–VOCs–NOxrelationship before and during the program, re-spectively. The red and green curves in the small legend show the O3production as a function of VOC cuts before and during the pro-gram, respectively.(b)O3–VOCs–NOx sensitivity within the cut-ting range of 60–99.5 % of NOx.
Table 9. RIR and RIR (weighted concentration) of LPG-related VOCs.
RIR RIR
(%/%×10−2) (weighted concentration) (µg m−3)
Propane 3.47 1.04
Propene 5.21 0.30
i-butane 3.47 1.33
n-butane 3.47 2.61
3.5.2 O3–VOCs–NOxsensitivity in LPG
Figure 13 shows the net O3increment (i.e., positive and
neg-ative values indicate the increase and decrease of O3,
respec-tively) as a response of the reduction of VOCs and NOx in LPG-fueled vehicle exhaust. It was found that the net O3
in-crement uniformly increased with the increase of NOx cut and the decrease of VOCs cut. To ensure that O3would not
increase during the program, the reduction of VOCs and NOx should be within the highlighted area; that is, the highest cut-ting percentage of NOxshould be less than 68.9 % (i.e., point
Figure 13.Net O3increment as a function of the reduction per-centages of VOCs and NOx in LPG-fueled vehicle exhaust. The highlighted area indicates zero O3increment.
A). Furthermore, when the cutting percentage of VOCs in-creased from 20 to 100 %, the maximum cutting percentage of NOxfor zero O3increment was between 18.2 and 68.9 %,
and the cutting ratio of VOCs/NOx increased from 1.1 to 1.45, suggesting that the cutting ratio of VOCs/NOxshould be >1.1 in order to maintain zero O3 increment. During
the program, VOCs and NOxin LPG-fueled vehicle exhaust were cut by∼43 and∼89 % (i.e., point B), respectively. Ac-cording to the cutting ratios of VOCs/NOx (∼1.45) in the high cutting range of NOx, the minimum reduction percent-age of VOCs should be∼129 % when NOx was cut by∼ 89 %. In other words, O3 would inevitably increase in this
case.
Indeed, NO2 experienced an overall increase from 1999
to 2013 at the roadsides in Hong Kong (HKEPD, 2014). According to this study, secondary NO2 might be more
responsible for the increase. Considering nil emission of NO2 (Sect. 3.2.2) and low emission of NO from LPG
us-age (i.e., 4.0 and 1.1–7.3 % based on the emission inven-tory and source apportionment, respectively), an alternative scheme was proposed; namely, reasonable cutting ratio of VOCs/NOxwas used to fulfill zero O3increase when VOC
and NOxwere cut. Although the O3production increase was
minor (i.e., 0.4 ppbv or 5.6 %) in this study, this scheme could be applicable in future programs. Moreover, since the reac-tivity and concentration of VOCs influenced their O3
forma-tion potential, the relative incremental reactivity (RIR) and RIR (weighted concentration) of LPG-related VOCs were calculated. Table 9 shows the RIR and RIR-weighted con-centration of propane, propene andn/ i-butanes. Propene had the highest RIR (i.e., 5.21×10⁻²), suggesting the highest sensitivity of O3production to propene. However,n-butane
4 Conclusions
In this study, an intervention program, initiated in Septem-ber 2013, and which aimed to reduce emissions of VOCs and NOx from LPG-fueled vehicles in Hong Kong, was evalu-ated. The results indicated that LPG-related VOCs and NOx decreased significantly during the program, when higher re-duction rates were observed for LPG-related VOCs and NOx compared to those in previous years. Source apportionment revealed that propane, n/ i-butanes and NO in LPG-fueled vehicle emissions were significantly lower during than be-fore the program. It was therebe-fore concluded that the pro-gram was remarkably effective in reducing VOCs and NOx. To evaluate the program more comprehensively, the varia-tion of O3 production was simulated with the PBM-MCM
model. It was found that LPG-fueled vehicular emission was generally O3-destructive at the roadside MK site, and the O3
destruction decreased from 0.47 to 0.06 ppbv due to the in-tervention program, causing an hourly average O3increase of
0.40 ppbv (∼5.6 %). The LPG-fueled vehicle exhaust gener-ally made negative contributions to the production of OH and HO2. During the program, the destructive effect weakened
and even turned to a positive contribution to HO2
produc-tion, resulting in the increases of OH, HO2and HO2/OH.
This was in line with the fact that O3increased slightly
dur-ing the implementation of the program. To improve the pro-gram for future application, an O3–VOCs–NOx sensitivity analysis was conducted for ambient air that is not partitioned to sources, and the individual source of LPG-fueled vehicle exhaust. The NOx-limited regime in O3formation was only
found when NOx was reduced to less than 5.5 %. Further-more, for the emission reductions in LPG-fueled vehicle ex-haust, the maximum NOx cutting percentage of 68.9 % and the lowest cutting ratio of VOCs/NOx(i.e., 1.1) were deter-mined to maintain zero O3increment.
The Supplement related to this article is available online at doi:10.5194/acp-16-6609-2016-supplement.
Acknowledgements. This study was supported by the Research Grants Council of the Hong Kong Special Administrative Region via grants PolyU5154/13E and PolyU152052/14E, and the Hong Kong Polytechnic University PhD scholarships (project no. RTUP). This study is partly supported by the Public Policy Research Funding Scheme (2013.A6.012.13A), Hong Kong PolyU internal grant (87UB) and the National Natural Science Foundation of China (no. 41275122).
Edited by: A. B. Guenther
References
Barletta, B., Meinardi, S., Simpson, I. J., Khwaja, H. A., Blake, D. R., and Rowland, F. S.: Mixing ratios of volatile organic com-pounds (VOCs) in the atmosphere of Karachi, Pakistan, Atmos. Environ., 36, 3429–3443, 2002.
Blake, D. R. and Rowland, F. S.: Urban Leakage of Liquefied Petroleum Gas and Its Impact on Mexico City Air Quality, Sci-ence, 269, 953-956, 1995.
Borbon, A., Locoge, N., Veilerot, M., Galloo, J. C., and Guillermo, R.: Characterization of NMHCs in a French urban atmospheric: overview of the main sources, Sci. Total Environ., 292, 177–191, 2002.
Brown, S. G., Frankel, A., and Hafner, H. R.: Source apportionment of VOCs in Los Angeles area using positive matrix factorization, Atmos. Environ., 41, 227–237, 2007.
Carter, W. L. and Atkinson, R.: Computer modeling study of incre-mental hydrocarbon reactivity, Environ. Sci. Tech., 23, 864–880, 1989.
Chan, C. Y. and Chan, L. Y.: Effect of meteorology and air pollutant transport on ozone episodes at a subtropical coastal Asian city, Hong Kong, J. Geophys. Res., 105, 20707–20724, 2000. Cheng, H. R., Guo, H., Wang, X. M., Saunders, S. M., Lam, S. H.
M., Jiang, F., Wang, T., Ding, A., Lee, S. C., and Ho, K. F.: On the relationship between ozone and its precursors in the Pearl River Delta: application of an observation-based model (OBM), Environ. Sci. Pollut. Res., 17, 547–560, 2010.
Chikhi, S., Boughedaoui, M., Kerbachi, R., and Joumard, R.: On-board measurement of emissions from liquefied petroleum gas, gasoline and diesel powered passenger cars in Algeria, J. Envi-ron. Sci., 26, 1651–1659, 2014.
Ciccone, G., Forastiere, F., Agabiti, N., Biggeri, A., Bisanti, L., Chellini, E., Corbo, G., Dell’Orco, V., Dalmasso, P., Volante, T. F., Galassi, C., Piffer, S., Renzoni, E., Rusconi, F., Sestini, P., and Viegi, G.: Road traffic and adverse respiratory effects in children, J. Occup. Environ. Med., 55, 771-778, 1998.
Farmer, D. K., Perring, A. E., Wooldridge, P. J., Blake, D. R., Baker, A., Meinardi, S., Huey, L. G., Tanner, D., Vargas, O., and Co-hen, R. C.: Impact of organic nitrates on urban ozone production, Atmos. Chem. Phys., 11, 4085–4094, doi:10.5194/acp-11-4085-2011, 2011.
Gamas, E. D., Diaz, L., Rodriguez, R., Lopez-Salinas, E., and Schifter, I.: Exhaust emissions from gasoline- and LPG-powered vehicles operating at the altitude of Mexico city, J. Air Waste Manage., 49, 1179–1189, 1999.
Guo, H., Wang, T., and Louie, P. K. K.: Source apportionment of ambient non-methane hydrocarbons in Hong Kong: Application of a principal component analysis/absolute principal component scores (PCA/APCS) receptor model, Environ. Pollut., 129, 489– 498, 2004.
Guo, H., Wang, T., Blake, D. R., Simpson, I. J., Kwok, Y. H., and Li, Y. S.: Regional and local contributions to ambient non-methane volatile organic compounds at a polluted rural/coastal site in Pearl River Delta, China, Atmos. Environ., 40, 2345–2359, 2006. Guo, H., So, K. L., Simpson, I. J., Barletta, B., Meinardi, S., and Blake, D. R.: C1-C8 volatile organic compounds in the atmo-sphere of Hong Kong: Overview of atmospheric processing and source apportionment, Atmos. Environ., 41, 1456–1472, 2007. Guo, H., Jiang, F., Cheng, H. R., Simpson, I. J., Wang, X. M., Ding,
Blake, D. R., Zhang, Y. L., and Xie, M.: Concurrent observa-tions of air pollutants at two sites in the Pearl River Delta and the implication of regional transport, Atmos. Chem. Phys., 9, 7343– 7360, doi:10.5194/acp-9-7343-2009, 2009.
Guo, H., Cheng, H. R., Ling, Z. H., Louie, P. K. K., and Ayoko, G. A.: Which emission sources are responsible for the volatile organic compounds in the atmosphere of Pearl River Delta?, J. Hazard. Mater., 188, 116–124, 2011a.
Guo, H., Zou, S.C ., Tsai, W. Y., Chan, L. Y., and Blake, D. R.: Emission characteristics of non-methane hydrocarbons from pri-vate cars and taxis at different driving speeds in Hong Kong, At-mos. Environ., 45, 2711–2721, 2011b.
HKCSD (Hong Kong Census and Statistics Department): Hong Kong Energy Statistics: Annual Report, available at: http://www. censtatd.gov.hk (last access: 15 March 2016), 2010.
HKEPD (Hong Kong Environmental Protection Depart-ment): Air quality in Hong Kong 2013, available at: http://www.aqhi.gov.hk/en/download/air-quality-reportse469. html?showall=_&start=_1) (last access: 15 March 2016), 2014. Ho, K. F., Lee, S. C., Guo, H., and Tsai, W. Y.: Seasonal and diurnal
variations of volatile organic compounds (VOCs) in the atmo-sphere of Hong Kong, Sci. Total Environ., 322, 155–166, 2004. Ho, K. F., Lee, S. C., Cao, J. J., Chow J. C., Watson, J. G., and
Chan, C. K.: Seasonal variations and mass closure analysis of particulate matter in Hong Kong, Sci. Total Environ., 355, 276– 287, 2006.
Ho, K. F., Lee, S. C., Ho, W. K., Blake, D. R., Cheng, Y., Li, Y. S., Ho, S. S. H., Fung, K., Louie, P. K. K., and Park, D.: Ve-hicular emission of volatile organic compounds (VOCs) from a tunnel study in Hong Kong, Atmos. Chem. Phys., 9, 7491–7504, doi:10.5194/acp-9-7491-2009, 2009.
Huang, J. P., Fung, J. C. H., Lau, A. K. H., and Qin, Y.: Numerical simulation and process analysis of typhoon-related O3 episodes in Hong Kong, J. Geophys. Res., 110, D05301, doi:10.1029/2004JD004914, 2005.
Huang, J. P., Fung, J. C. H. and Lau, A. K. H.: Integrated pro-cesses analysis and systematic meteorological classification of ozone episodes in Hong Kong, J. Geophys. Res., 111, D20309, doi:10.1029/2005JD007012, 2006.
Jiang, F., Wang, T. J., Wang, T. T., Xie, M., and Zhao, H.: Numeri-cal modeling of a continuous photochemiNumeri-cal pollution episode in Hong Kong using QRF-chem, Atmos. Environ., 42, 8717–8727, 2008.
Lai, C. H., Chang, C. C., Wang, C. H., Shao, M., Zhang, Y. H., and Wang, J. L.: Emissions of liquefied petroleum gas (LPG) from motor vehicles, Atmos. Environ., 43, 1456–1463, 2009. Lam, K. S., Wang, T. J., Wu, C. L., and Li, Y. S.: Study on an ozone
episode in hot season in Hong Kong and transboundary air pol-lution over Pearl River Delta region of China, Atmos. Environ., 39, 1967–1977, 2005.
Lam, S. H. M., Saunders, S. M., Guo, H., Ling, Z. H., Jiang, F., Wang, X. M., and Wang, T. J.: Modelling VOC source impacts on high ozone episode days observed at a mountain summit in Hong Kong under the influence of mountain-valley breezes, At-mos. Environ., 81, 166–176, 2013.
Lau, A. K. H., Yuan, Z. B., Yu, J. Z., and Louie, P. K. K.: Source apportionment of ambient volatile organic compounds in Hong Kong, Sci. Total Environ., 408, 4138–4149, 2010.
Lau, J., Hung, W. T., and Cheung, C. S.: On-board gaseous emis-sions of LPG taxis and estimation of taxi fleet emisemis-sions, Sci. Total Environ., 409, 5292–5300, 2011.
Lee, E., Chan, C. K., and Paatero, P.: Application of positive matrix factorization in source apportionment of particulate pollutants in Hong Kong, Atmos. Environ., 33, 3201–3212, 1999.
Lee, S. C., Chiu, M. Y., Ho, K. F., Zou, S. C., and Wang, X. M.: Volatile organic compounds (VOCs) in urban atmosphere of Hong Kong, Chemosphere, 48, 375–382, 2002.
Ling, Z. H. and Guo, H.: Contribution of VOC sources to photo-chemical ozone formation and its control policy implication in Hong Kong, Environ. Sci. Policy, 38, 180–191, 2014.
Ling, Z. H., Guo, H., Cheng, H. R., and Yu, Y. F.: Sources of am-bient volatile organic compounds and their contributions to pho-tochemical ozone formation at a site in the Pearl River Delta, southern China, Environ. Pollut., 159, 2310–2319, 2011. Ling, Z. H., Guo, H., Zheng, J. Y., Louie, P. K. K., Cheng, H. R.,
Jiang, F., Cheung, K., Wong, L. C., and Feng, X. Q.: Establishing a conceptual model for photochemical ozone pollution in sub-tropical Hong Kong, Atmos. Environ., 76, 208–220, 2013. Ling, Z. H., Guo, H., Lam, S. H. M., Saunders, S. M., and Wang,
T.: Atmospheric photochemical reactivity and ozone production at two sites in Hong Kong: Application of a Master Chemical Mechanism-photochemical box model, J. Geophys. Res. Atmos., 119, 10567–10582, doi:10.1002/2014JD021794, 2014.
Liu, Y., Shao, M., Lu, S. H., Chang, C. C., Wang, J. L., and Fu, L. L.: Source apportionment of ambient volatile organic compounds in the Pearl River Delta, China: Part II, Atmos. Environ., 42, 6261– 6274, 2008.
Lou, S., Holland, F., Rohrer, F., Lu, K., Bohn, B., Brauers, T., Chang, C. C., Fuchs, H., Häseler, R., Kita, K., Kondo, Y., Li, X., Shao, M., Zeng, L., Wahner, A., Zhang, Y., Wang, W., and Hofzumahaus, A.: Atmospheric OH reactivities in the Pearl River Delta – China in summer 2006: measurement and model results, Atmos. Chem. Phys., 10, 11243–11260, doi:10.5194/acp-10-11243-2010, 2010.
Lu, K. D., Rohrer, F., Holland, F., Fuchs, H., Bohn, B., Brauers, T., Chang, C. C., Häseler, R., Hu, M., Kita, K., Kondo, Y., Li, X., Lou, S. R., Nehr, S., Shao, M., Zeng, L. M., Wahner, A., Zhang, Y. H., and Hofzumahaus, A.: Observation and modelling of OH and HO2concentrations in the Pearl River Delta 2006: a missing OH source in a VOC rich atmosphere, Atmos. Chem. Phys., 12, 1541–1569, doi:10.5194/acp-12-1541-2012, 2012.
Madronich, S. and Flocke, S.: Theoretical estimation of biologically effective UV radiation at the Earth’s surface, in: Solar Ultravio-let Radiation-Modeling, Measurements and Effects, edited by: Zerefos, C., NATO ASI Series, vol. I52. Springer-Verlag, Berlin, 1997.
Martien, P. T., Harley, R. A., Milford, J. B., and Russell, A. G.: Evaluation of incremental reactivity and its uncertainty in South-ern California, Environ. Sci. Technol., 37, 1598–1608, 2003. Myung, C. L., Kim, J., Choi, K., Hwang, I. G., and Park, S.:
Com-parative study of engine control strategies for particulate emis-sions from direct injection light-duty vehicle fueled with gaso-line and liquid phase liquefied petroleum gas (LPG), Fuel, 94, 348–355, 2012.
Kong: A multi-year real-time data analysis, Atmos. Environ., 103, 196–206, 2015.
Paatero, P.: Least squares formulation of robust non-negative factor analysis, Chemom. Intell. Lab. Sys., 37, 23–35, 1997.
Paatero, P. and Tapper, U.: Positive matrix factorization: A non-negative factor model with optimal utilization of error estimates of data values, Environmetrics, 5, 111–126, 1994.
Ren, X. R., Harder, H., Martinez, M., Lesher, R. L., Oliger, A., Sim-pas, J. B., Brune, W. H., Schwab, J. J., Demerjian, K. L., He, Y., Zhou, X. L., and Gao, H. L.: OH and HO2chemistry in the urban atmosphere of New York City, Atmos. Environ., 37, 3639–3651, 2003.
Ruellan, S. and Cachier, H.: Characterisation of fresh particulate vehicular exhausts near a Paris high flow road, Atmos. Environ., 35, 453–468, 2001.
Schifter, I., Diaz, L., Lopez-Salinas, E., Rodriguez, R., Avalos, S., and Guerrero, V.: An evaluation of the LPG vehicles program in the metropolitan area of Mexico city, J. Air Waste Manage., 50, 301–309, 2000.
So, K. L. and Wang, T.: On the local and regional influence on ground-level ozone concentrations in Hong Kong, Environ. Pol-lut., 123, 307–317, 2003.
Takekawa, H., Chatani, S., and Akiyoshi, I.: A new approach for estimation of the effect of NOx emission reduction on road-side NO2concentration in Tokyo, Atmos. Environ., 68, 92–102, 2013.
Wang, T., Guo, H., Blake, D. R., Kwok, Y. H., Simpson, I. J., and Li, Y. S.: Measurements of trace gases in the inflow of South China Sea background air and outflow of regional pollution at Tai O, southern China, J. Atmos. Chem. 52, 295–317, 2005.
Wang, T., Wei, X. L., Ding, A. J., Poon, C. N., Lam, K. S., Li, Y. S., Chan, L. Y., and Anson, M.: Increasing surface ozone concen-trations in the background atmosphere of Southern China, 1994– 2007, Atmos. Chem. Phys., 9, 6217–6227, doi:10.5194/acp-9-6217-2009, 2009.
Wang, T. J., Lam, K. S., Xie, M., Wang, X. M., Carmichael, G., and Li, Y. S.: Integrated studies of a photochemical smog episode in Hong Kong and regional transport in the Pearl River Delta of China, Tellus B, 58, 31–40, 2006.
Xie, S. D., Zhang, Y. H., Li, Q., and Tang, X. Y.: Spatial distribu-tion of traffic-related pollutant concentradistribu-tions in street canyons, Atmos. Environ., 37, 3213–3224, 2003.